Growth was the place to be through the covid-19 pandemic while value managers couldn’t catch a break.
Mentioned: Hyperion Global Growth Companies B (42173), GQG Partners Emerging Markets Equity (43156), Lazard Select Australian Equity W Cl (10702), Hyperion Australian Growth Companies (3344), Robeco Emerging Conservative Equity AUD (40081), Hyperion Small Growth Companies (4242), Investors Mutual WS Future Leaders (8741), SPDR® S&P Global Dividend ETF (WDIV).
This is a round-up of the best and worst performing equity funds under Morningstar coverage for 2020. Morningstar fund analysts conduct reviews of over 480 flagship Australian funds, exchange-traded funds and listed investment companies. Data is not available for LICs. Performance of all funds over the calendar year is available via the Morningstar Adviser Research Centre Fund Screener.
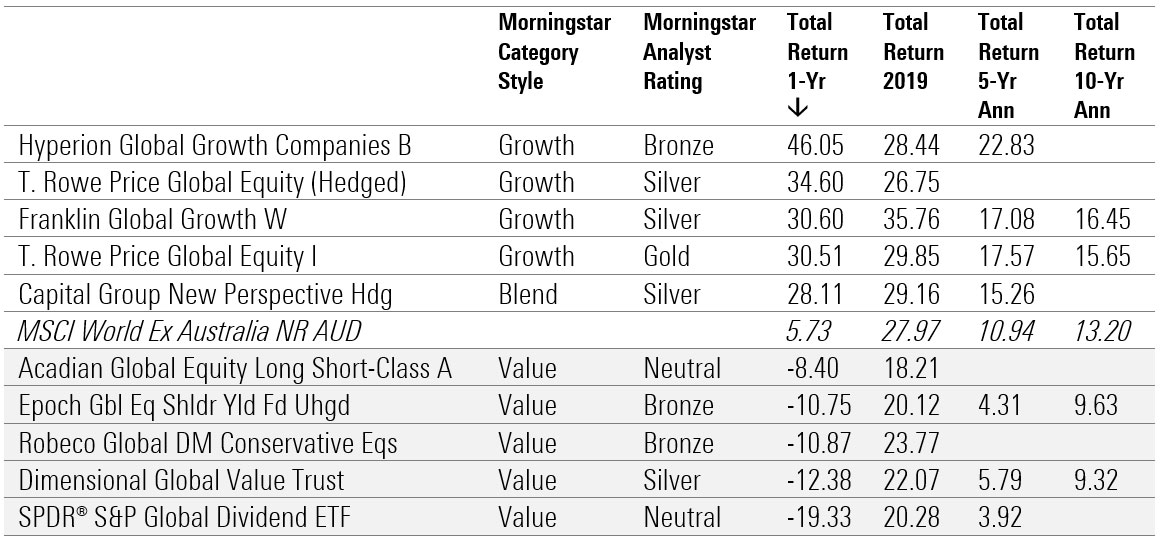
Brisbane-based growth manager Hyperion Asset Management has swept several categories after taking strong bets on highly quality tech firms which benefited from the pandemic.
The boutique manager topped three Morningstar categories – Australian Equity Large Cap, Australian Equity Small/Mid cap and Global Equity Large Cap – delivering returns well above the index.
Morningstar senior fund analyst Christopher Franz said Hyperion portfolio managers Mark Arnold and Jason Orthman had a spectacular year, taking positions in companies that thrived from people staying indoors. The managers’ global fund features several US megacaps like Amazon, PayPal Holdings, Facebook Inc and Salesforce, while locally it holds sizeable positions in CSL Ltd,
Xero Ltd, HUB24 and Domino’s Pizza.
“Hyperion’s highly concentrated growth portfolios delivered yet again in 2020 across domestic and global markets,” Franz says.
“The manager’s preference for disruptive structural growth names have long pointed them towards technology, healthcare, and discretionary names, which were either unfazed or quick to recover from the early year selloff and pushed the portfolios to top-decile performance across the board.”
Growth managers dominated overall thanks in part to the low interest rate environment and global lockdowns, which fuelled the strength of remote working stocks such as Zoom and Slack, stay-at-home winner Amazon and music streaming service Spotify. The top-5 mega US tech companies – Microsoft, Apple, Amazon, Alphabet and Facebook – now make up over 20 per cent of the S&P 500 Index, with their market share increasing 25 per cent in the first six months of this year. Australian investors were drawn to a local version of growth darlings as names such as Afterpay, Xero and Kogan continued their growth streak.
Style wars
Value managers continued to test the faith of their investors, extending their underperformance. Growth-at-any-price became the mantra for 2020, while traditional value areas of the market such as energy and financials languished. Managers who didn’t participate in the strong tech run struggled to outperform even the index.
“Value is a word on many people’s lips at the moment, and it’s for some been quite a dirty word in investment terms over the last couple of years because so-called value managers have performed pretty poorly,” says Morningstar Investment Dan Kamp.
“That’s because people have become very enthusiastic about growth stocks, technology stocks, so-called working-from-home stocks that are expected to benefit from the current environment.
“These were already expensive coming into the pandemic and really the pandemic has just heightened the price of some of these growth, technology, working-from-home stocks.”
However, the tide could be turning. If 2016 was a value year, then November 2020 was a value month. While global equities as a whole rose 8.8 per cent over the month, there was a wide disparity between styles: the value index soared 11.1 per cent while the global growth index climbed 6.8 per cent.
Kemp believes that growth is poised to underperform value over the next year as “valuations reassert themselves back to something approaching normality.”
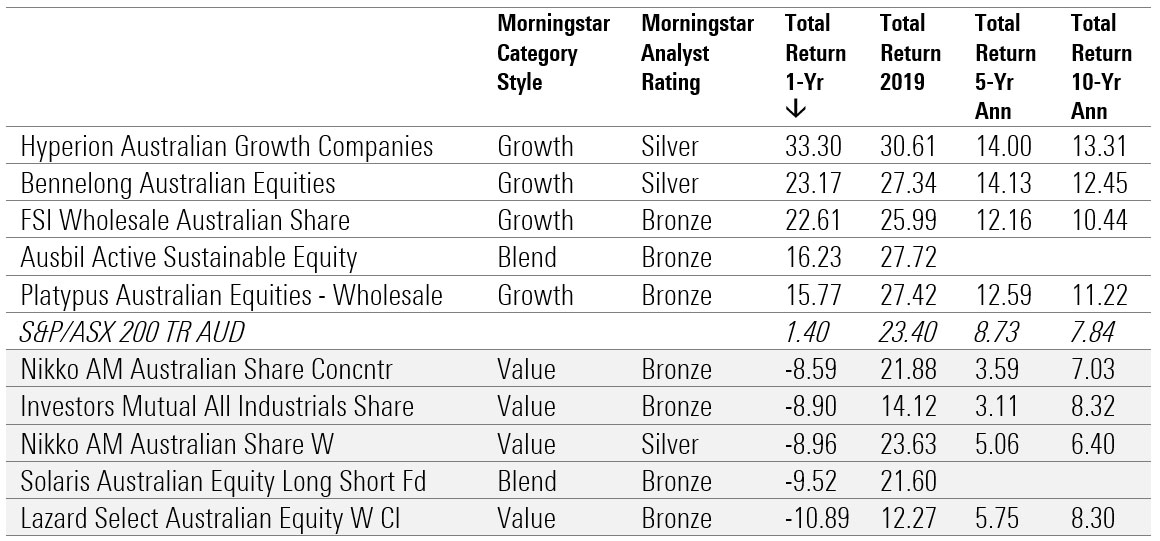
Australia Equity Large Cap
Silver-rated Hyperion Australian Growth Companies led the Australian equity large cap category for a second year in a row, delivering a return of 31.90 per cent above the S&P/ASX 200 Index. 2020 has been a banner year for the fund, outperforming the benchmark in both the coronavirus-driven sell-off and subsequent rebound.
Morningstar director, manager research, Michael Malseed says the portfolio managers are willing to look past expensive near-term earnings multiples, as well as any short-term trading weakness, as long as the long-term thesis remains intact. The portfolio is highly concentrated (15-30 holdings) and skews heavily to certain sectors such as technology and healthcare. Major wins for the fund in 2020 include an overweight position in information technology, healthcare and consumer discretionary sectors. Leading contributors to performance included tech firms Afterpay and Xero, fast-food chain Domino’s Pizza and global building materials company James Hardie Industries.
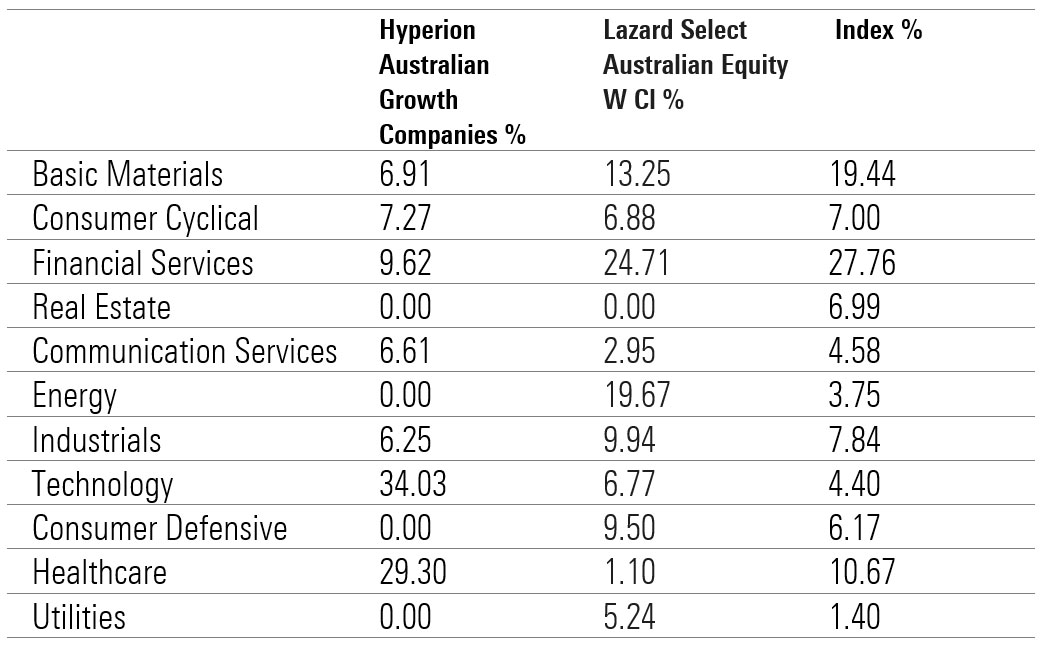
Hyperion typically holds no materials and energy stocks, reflecting managers’ lack of confidence in the sectors’ earnings predictability and pricing power. Hyperion also prefers nonbank financials, with strong organic growth prospects such as Netwealth and Hub24, and since late 2018 has held none of the big four banks.
Sector exposure | Hyperion v Lazard v S&P/ASX 200 (current portfolio)
Source: Morningstar Direct
Hyperion’s punchy approach delivers periods of feast and famine however, says Malseed.
“The strategy fell 38.92 per cent in 2008 – worse than the market. It had a peer-beating resurgence of 59.25 per cent in 2009 thanks to sold-down mid-cap names recovering.
“In 2010 and 2011, it was again lacklustre, before stellar returns in each of the following three calendar years, in both absolute and relative terms.
“Though the performance history is undoubtedly top-draw, Hyperion is not immune to mistakes.”
Morningstar senior fund analyst Ross Macmillan says Lazard Select Australian Equity’s underperformance in 2020 can be summed up in two words: concentrated and value.
“It’s not a place you wanted to be last year,” he says.
“The fund was exposed to coal and energy with investments in Whitehaven Coal and Woodside Petroleum and to AMP. These three were in top ten holdings for most of year.”
Stock style | Hyperion v Lazard (current portfolio)
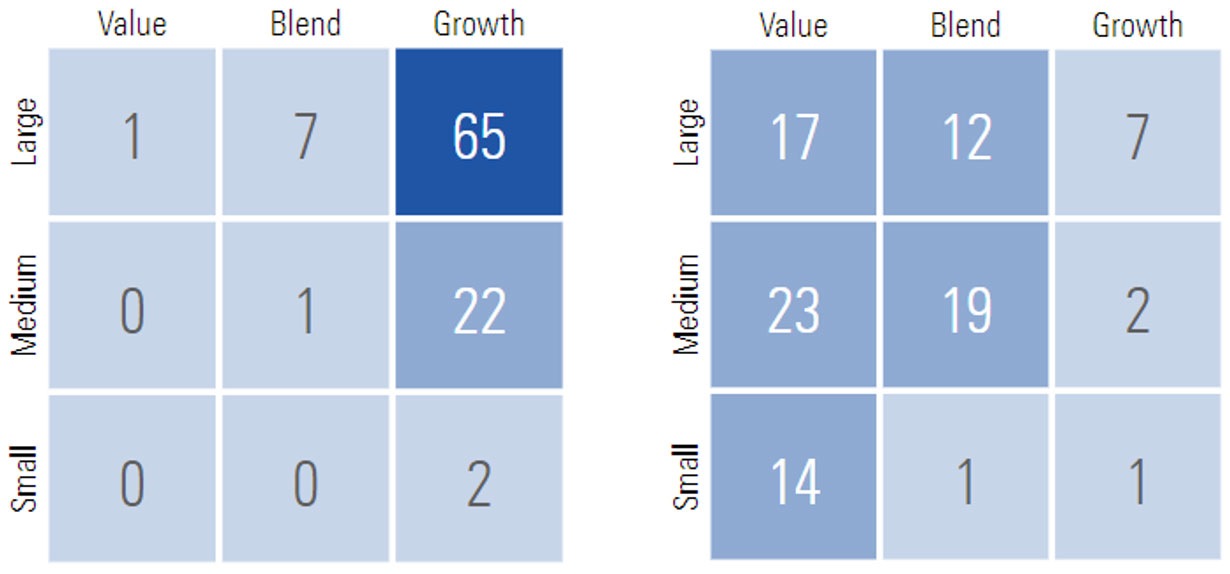
Source: Morningstar Direct
The Bronze-rated manager returned -10.89 per cent in 2020, underperforming the S&P/ASX 200 index by -12.29 per cent. The portfolio managers run a high-conviction value strategy with a portfolio of just 12-30 stocks, adopting a long-term approach will inherently incur volatile annual returns through the cycle.
“The fund is placed in the first quartile among category peers, over 10 years to 31 Aug 2020, though this disguises an occasionally rocky ride,” Macmillan says.
“The strategy’s value skew saw it struggle in the global financial crisis, falling 35 per cent in 2008, and even though it recovered strongly in 2009, it still landed in the fourth quartile that year. However, the team had a great run from 2011 to 2014 when it outperformed the index and the category average in each calendar year.”
Nine of the ten worst performing funds are value-orientated funds.
Source: Morningstar Direct
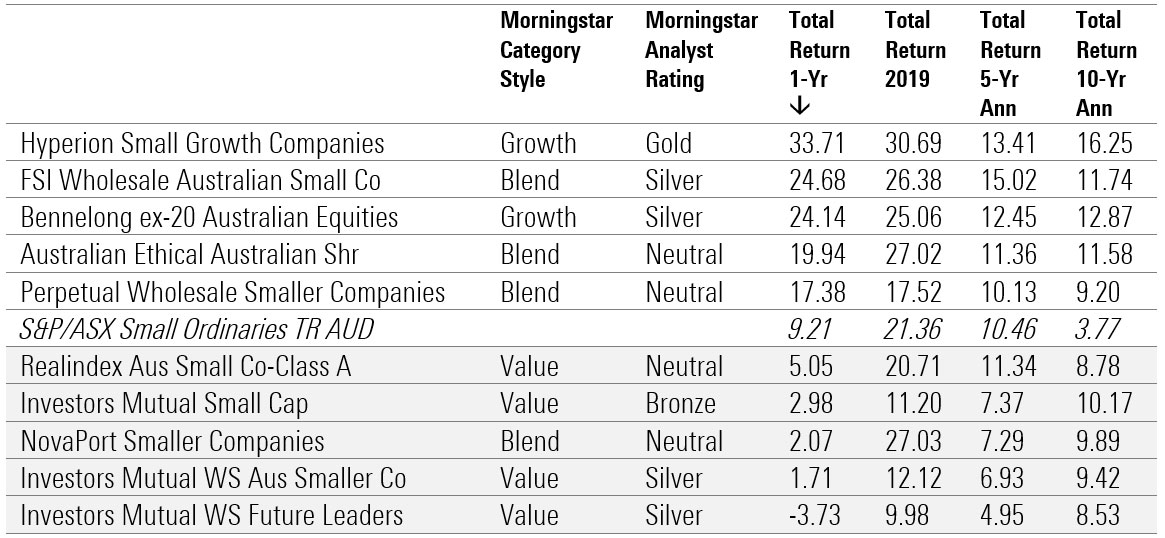
Australia Equity Small/Mid Cap
Hyperion similarly outperformed its peers and the index in the small/mid cap category. The gold-rated Hyperion Small Growth Companies fund returned 33.71 per cent, helped by holdings in Hub24, Pushpay Holdings and Xero.
“The investment process is differentiated by its genuine long-term approach, seeking to identify high-quality companies with enduring competitive advantages that can grow into large total addressable markets over time,” Malseed says.
“This approach is well-suited to the Australian small-cap segment and tends to skew towards technology and healthcare names, as well as consumer discretionary stocks.”
Portfolio managers have delivered strong long-term performance, achieving top-quartile results over the trailing one-, three-, five-, and 10-year periods.
Investors Mutual WS Future Leaders underperformed the index in 2020 due to its value-style. The strategy was also hampered by stocks calls in sectors particularly impacted from persistent coronavirus restrictions, most notably, prominent holdings in Crown Resorts, Event Hospitality and Entertainment, and Skycity Entertainment.
Morningstar fund analyst Chris Tate, however, notes that Investors Mutual Australia Smaller Companies has delivered exceptional long-term returns, beating the benchmark and peers over a variety of market cycles.
“[The fund] has historically delivered particularly strong performance in down markets, achieving an outstanding downside-capture ratio of around 48 per cent for the 18 years to May 2020,” he says.
“However, this downside protection was not evident in the first half of 2020 as it was in past sell-offs.”
2020 proved a difficult year for active managers to outperform with an index-tracking ETF featuring in the top 10. Over the 10 years to May 2020, most active managers have handily beaten small-cap indexes.
Source: Morningstar Direct
Global Equity Large Cap
Hyperion’s outperformance extended to overseas markets, topping the global equity large cap category. Managers of the Hyperion Global Growth Companies fund seek high-quality, global businesses with long-term structural growth and have a clear focus on capital preservation and quality of management. A healthy cash stake helped, as did strong absolute performance from top holdings like Amazon.com, PayPal, Alphabet, and Microsoft. Still, the concentrated, 20-stock portfolio isn’t for the faint of heart, says Franz.
“The fund maintains significant biases towards technology, discretionary, and non-bank financial names, which push the portfolio to extreme growth multiples relative to the MSCI World Index and world large growth Morningstar Category peers,” he says.
“Nearly all the portfolio’s holdings carry Morningstar Economic Moat ratings, and its aggregate portfolio profitability metrics (profit margins and return on capital) are far above the benchmark and peer group.”
BetaShares Global Sustainability Leaders ETF also featured in the top 10 with a return of 24.92 per cent for the year thanks to large exposures to healthcare and tech stocks and evasion of energy and mining. With oil prices collapsing in the early part of 2020 and climate change concerns accelerating, energy stocks have been among the worst performers – and many of these oil giants have compounded investor pain by announcing dividend cuts.
Source: Morningstar Direct
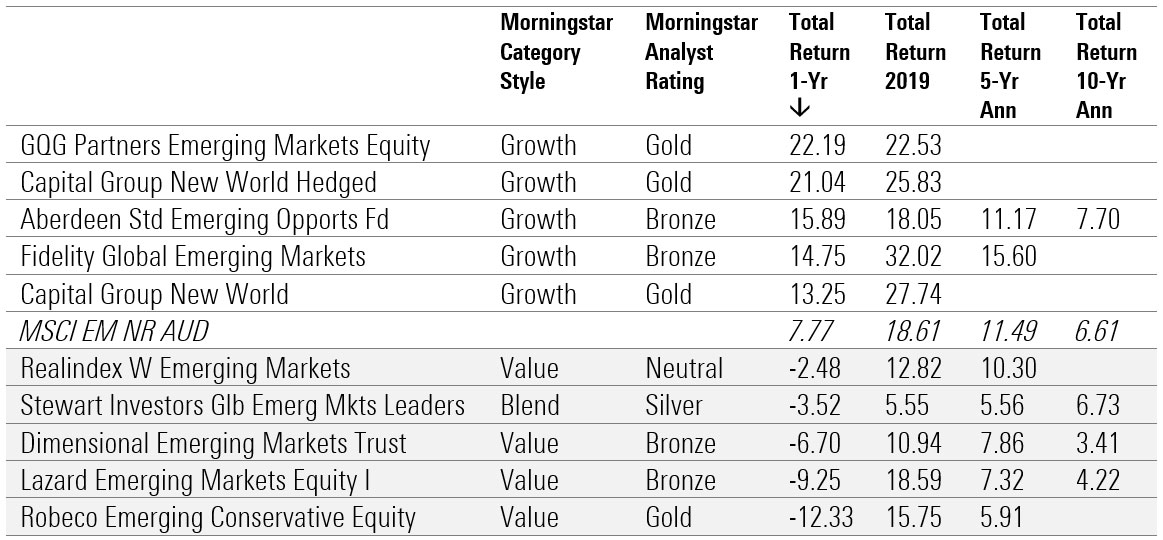
Emerging Market Equity Large Cap
GQG Partners Emerging Markets Equity had a spectacular year thanks largely to its stock-picking prowess. The portfolio featured large holdings in some of the year’s best performing stocks, including online gaming, e-commerce, and digital payments platform Sea Limited, Latin American e-commerce company MercadoLibre and Chinese alcoholic beverage company Wuliangye Yibin Co.
The gold-rated fund, which is new to the Australian market, looks for companies with a manageable (if any) amount of debt; proven leadership with a record of prudent capital allocation; and a history of weathering tough economic conditions.
“Portfolio manager Rajiv Jain is more interested in steady growth than the firms with the highest growth rates,” says Morningstar senior fund analyst Matthew Wilkinson.
“He is willing to pay relatively high prices for top notch opportunities, but if valuations seem excessive for low- or moderate-growth stocks, he turns away.”
Morningstar analysts say Robeco Emerging Conservative Equity’s underweight position in tech and China, and overweight position in sectors and stocks that became the losers of the global lockdown, explain the strategy’s underperformance.
“While the strategy was expected to deliver downside protection during the corona-driven sell-off in 2020, it failed dramatically and also didn’t recover much during the subsequent recovery rally,” analyst Jeffrey Schumacher says.
“The fund suffered from negative effects from lower exposure to Tencent, Alibaba and TSMC and from underweight technology, owning Chinese banks and Thai financials and being overweight to lockdown-sensitive, but normally low-beta Brazilian utilities which also suffered from a weak currency.
“Higher allocation to small- and mid-caps versus peers/index hurt performance too.”
Source: Morningstar Direct
These names have shone but as bubble warnings grow louder their frothy valuations and lack of competitive advantage may concern.
Mentioned: Afterpay Ltd (APT), Netwealth Group Ltd (NWL), Fortescue Metals Group Ltd (FMG), JB Hi Fi Ltd (JBH), Kogan.com Ltd (KGN), Mineral Resources Ltd (MIN), Oz Minerals Ltd (OZL), Rio Tinto PLC ADR (RIO), Washington H Soul Pattinson & Co Ltd (SOL), Wesfarmers Ltd (WES)
When warnings of a stock market bubble emerge it may pay to heed them. And that’s especially the case when such warnings emanate from heavyweight investing veterans. Last week two members of that esteemed club, Jeremy Grantham and Carl Icahn, warned that a speculative bubble is swelling.
“A fully fledged epic bubble” is how Grantham, who co-manages $85 billion as co-founder of GMO, referred to the latest stock market moves. Icahn, for his part, told US business channel CNBC, he is “pretty well hedged right now”. Suffice to say, US markets seemed oblivious to the words of the two stalwarts, and closed the week at fresh records.
Morningstar US analyst Brian Colello says tech stocks are expensive overall, noting that a subset of names (notably Zoom and Shopify) have what he describes as “alarming valuations.”
“Across our coverage, which skews toward large cap, moaty names and is centered around semis, software, and hardware, we view the sector as expensive as the median price to fair value estimate ratio sits at 1.18 as of 30 December, one of the highest ratios we’ve seen since 2007.”
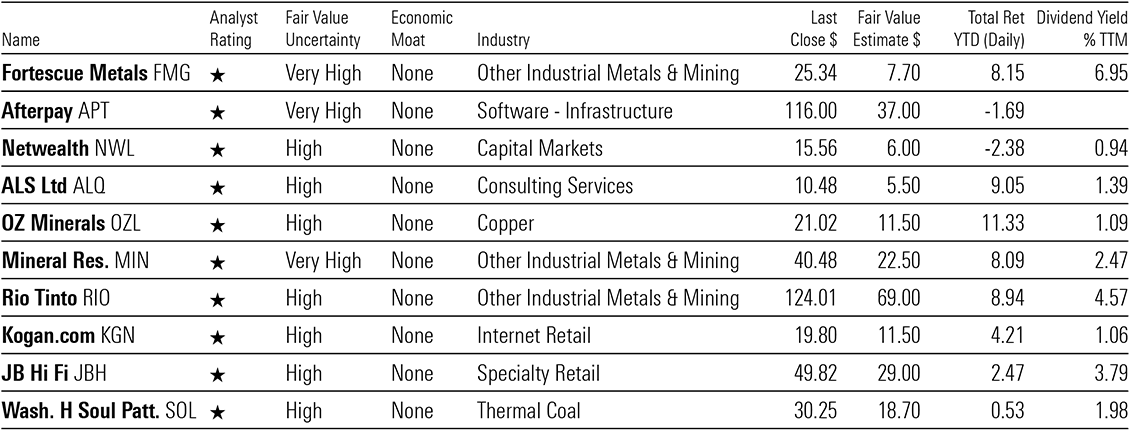
With that in mind it may be useful to reveal the most overvalued Australian stocks under Morningstar coverage.
For the record, the most overvalued wide moat stocks with medium uncertainty are: New Zealand’s chief hub Port of Tauranga (NZE: POT); resources investing vehicle Deterra Royalties (ASX: DRR); conglomerate Wesfarmers (ASX: WES); and hearing implant maker Cochlear (ASX: COH).
But back to our initial list of most overvalued 10 stocks under coverage, with no moat and high to very high uncertainty. The top three names on the list are iron ore miner Fortescue Metals Group (ASX: FMG), buy now, pay later provider Afterpay (ASX: APT) and wealth management platform Netwealth Group (ASX: NWL).
As we suggested, most of the overvalued names feature among the Basic Materials sector. They include: FMG, Oz Minerals (ASX: OZL), Mineral Resources (ASX: MIN), and Rio Tinto (ASX: RIO).
In the Consumer Cyclical sector, two names feature both of which are household names and specialists in ecommerce, particularly electronics sales: JB Hi-Fi (ASX: JBH) and Kogan.com (ASX: KGN).
In the Energy sector, investment house Washington H Soul Pattinson & Co. (ASX: SOL) stands out for its exposure to thermal coal.
In Financial Services, the most overvalued name is Netwealth Group; while in Technology, the standout name is Afterpay.
Despite their frothy valuations, several of these stocks have however recorded strong performances. Afterpay for instance has a one-year annualised return of 285.64 per cent.
And on a 3-year annualised basis, the BNPL pioneer still leads the way with a return of 160 per cent. This is followed by FMG with the return of just under 76 per cent, and Kogan.com with more than 46 per cent.
ALS has the lowest return on a 3-year annualised basis at 15.21 per cent.
It’s also worth mentioning that some of them are generous dividend payers, particularly FMG and Rio, which have a dividend yield of 6.95 per cent and 4.57 per cent respectively.
Overvalued, no moat, high uncertainty
Source: Morningstar Direct; data as at 11 January 2021
Here’s a little more from the respective Morningstar analyst on FMG, Afterpay and Netwealth:
Fortescue Metals Group
“We do not believe that Fortescue Metals Group has an economic moat. The primary source of competitive advantage for a miner is low-cost production. Margins are well below the industry leaders BHP and Rio Tinto, and some way behind Vale, meaning Fortescue sits in the highest half of the cost curve. This is a primary driver of our no-moat rating. Lower margins primarily result from discounts from mining a lower-grade (57 per cent- to 58 per cent-grade) product compared with the benchmark, which is for 62 per cent-grade iron ore. The lower grade is effectively a cost for customers, which results in a lower realised price versus the benchmark.
“Competitive advantage in iron ore is all about low costs, and Fortescue is well behind industry leaders. Fortescue sells an inferior 57 per cent-58 per cent fines iron ore product, with an average 8 per cent-9 per cent moisture content, attracting a significant discount to the spot 62 per cent iron benchmark.” (Mathew Hodge)
Afterpay
“Afterpay does not possess an economic moat. First, we anticipate intensifying competition due to low barriers to entry and the commodity like nature of payment financing, which precludes a sustainable competitive advantage. Secondly, Afterpay faces risks that could lead to material value destruction, such as heightened regulatory scrutiny that may require changes to its processes or technology that make its platform less attractive, and its heavy reliance on capital markets to fund receivables growth and expansion plans. We expect both competition and regulation to even the odds of success between BNPL providers as they participate in the growth of BNPL financing globally, with no single player having a distinct advantage over the rest.” (Shaun Ler)
Netwealth Group
“We don’t believe Netwealth has an economic moat, given the number of competing offerings with very similar functionality and the ease with which improvements in its software functionality can be replicated by competitors. Netwealth does not own an aligned financial advisor network to help direct funds under administration to its platform.
“Despite strong earnings growth and returns on invested capital, Netwealth operates in a commoditised industry with several independent investment management platform competitors, including Hub 24 (ASX: HUB), Praemium (ASX: PPS), Onevue Holdings (ASX: OVH), Xplore Wealth (ASX: XPL), and Powerwrap (ASX:PWL), in addition to platforms owned by the large vertically integrated wealth management firms. Platforms largely compete on functionality, customer service, and price but rarely have exclusivity with their financial advisor customers, and the average financial adviser uses two or three different platforms.” (Gareth James)
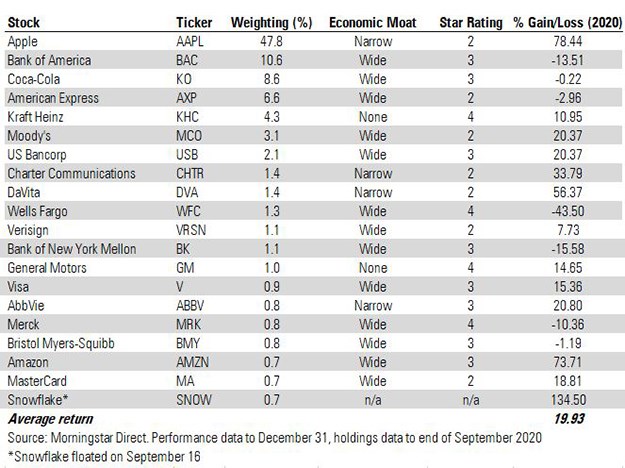
Billionaire investor Warren Buffett had a mixed year by his standards, with some winners such as Apple and Snowflake balanced by banks and energy
In a tough year for most investors, even Warren Buffett had a mixed year by his standards. The share price of his Berkshire Hathaway (BRBK.B) investment company inched forward by just 2.5%, lagging major US benchmarks like the S&P 500.
Top holding Apple (AAPL) had a stellar year and an investment in data IPO Snowflake (SNOW) proved an immediate hit. But there were a number of misses too, with investments in US banks and financial services proving costly. Let’s take a closer look at his portfolio:
What Worked for Warren Buffett in 2020
We covered the Sage of Omaha from a range of angles last year: Morningstar columnist John Rekenthaler analysed Buffett’s predictive powers, and in June Susan Dziubinski picked out three potential buys from the portfolio following the spring 2020 crash.
Looking in-depth at the portfolio, there were some strong performances from the likes of Apple and Amazon (AMZN), whose shares were 70% higher at the end of the year. But the standout performer in 2020 was new holding Snowflake, which floated in September at $120 and closed the year 134% higher at $281. The investment was particularly notable as value investor Buffett typically rejects the “hooplah” associated with IPOs. Indeed, the last time he bought a newly listed company was Ford motor company in 1956.
So what were the biggest changes to the Buffett investment portfolio in 2020? Healthcare was one of the boom areas of 2020 so it was no surprise to see an increased weighting to these stocks last year. In the third quarter of 2020, the portfolio added to positions in Abbvie (ABBV), Merck (MRK) and Bristol Myers Squibb (BMY) – the trio now account for 2.4% of the portfolio’s assets between them.
Of these, only Abbvie posted a positive return for the year, up 20%. Merck, meanwhile, is one of four companies in the portfolio rated as undervalued by Morningstar analysts with a 4-star rating (the others are food giant Kraft Heinz (KHC), bank Wells Fargo (WFC), which fell nearly 45% last year, and US car firm General Motors (GM)). The position in Wells Fargo was reduced in 2020, as were stakes in Bank of New York Mellon, Visa, Mastercard and US Bancorp.
Merck is also one of two companies in the portfolio’s top 20 positions to have a wide economic moat, an important concept gauging competitive advantage for Warren Buffett and Morningstar. General Motors and Kraft Heinz are the only stocks in the list with no economic moat, while Snowflake does not yet have a Morningstar rating.
The Trouble With Berkshire
How do you measure Warren Buffett’s performance? A conventional investment portfolio with 50% exposure to Apple would have done very well in 2020. The average share price gain for the biggest holdings in the portfolio is just below 20% (see table), which beats the S&P 500’s gain of 15% for last year.
But as Morningstar analyst Greggory Warren explains, things aren’t that simple: Berkshire Hathaway has many facets and while the investment portfolio gains investor attention because of Buffett’s status, it’s also part of a much wider empire. Berkshire Hathaway Energy and its railway subsidiary BNSF, for example, were hit hard in 2020. The manufacturing, services and retail (MSR) arm, with holdings in metalworking companies and aircraft parts suppliers, has also been damaged by the pandemic. And exposure to insurance has weighed on performance, with much higher payouts last year in the industry as a whole.
But Berkshire Hathaway B shares are now undervalued, according to Morningstar analysts, and retains its wide economic moat. The company could come under pressure to return more of its cash mountain to shareholders this year after a lacklustre 2020 in share price terms.
Berkshire is not easily compared with an index or a conventional investment fund. While the Berkshire Hathaway share price barely moved the needle last year, Morningstar analyst Amy Arnott says the Buffett magic keeps retail shareholders loyal: “The legions of investors who still count on it as a quasi-fund for their life savings likely aren’t complaining.”
Now 90, Buffett has handed the running of his equity portfolio to former hedge fund managers Todd Combs and Ted Weschler, who run $30 billion between them. After the portfolio’s surprise (and highly lucrative) punt on Snowflake towards the end of last year, Berkshire investors could see further unexpected developments this year. And with value investing making a tentative comeback and the real economy recovering, these conditions could be more favourable to Buffett’s approach of buying unloved stocks.
Introduction
The performance of equities markets in 2019 was one of the best for decades. 2020 was the year when several records were broken. New peaks were achieved early in the new year; the fastest bear market (-20%) in history in March; the fastest run to bull territory (+20%) between April and May; and the best November performances for many global markets, with new all-time highs being registered in US markets.
It was a year of trials and tribulations, where patience was tested but those in for the long haul were ultimately relieved and rewarded. Late March provided some rare opportunities for those with cash. Investing is a test of endurance and 2020 proved to be one of the most challenging in many decades. Despair and then euphoria.
2021 is unlikely to be a repeat. Markets could begin the year with an extension of the current upswing, but as it unfolds several questions will undoubtedly be asked about the progress of the economic recovery and the relationship to risk asset valuations.
In early 2020, the first signs of a truce emerged in the trade war between the US and China with the signing of the Phase One deal. Tariffs were rolled back, China promised to expand the purchase of US goods and agricultural produce and commitments on technology transfer, intellectual property and currency were at least partially addressed. The level of uncertainty subsided, and global financial markets surged as central banks’ “lower-for-longer” interest rate policy combined with quantitative easing swelled an already brimming ocean of liquidity.
Global liquidity has reached levels not previously entertained as the relatively quick succession of trade wars, slowing economic activity and a pandemic and associated recession saw an “on the run” response from central banks. “Cut interest rates and throw money at it” was the prescription despite the different ailments. Predictably, most of the liquidity created has been misdirected. Global business investment has disappointed, with risk assets the major beneficiary of central bank largesse. This must be frustrating as bubbles begin to appear, particularly in equity markets. This is somewhat akin to demand-pull inflation, where too much money is chasing too few goods, and prices rise.
Employment or unemployment will be one of the great challenges of 2021. Unprecedented job losses across developed economies are unlikely to be fully restored and this will add pressure to household income. The knock-on effect is subdued, rather than buoyant economic activity, given private sector demand is dominated by household consumption. Corporate profitability is also dependent on robust private sector demand.
The new year will launch off an elevated platform for market indices. All US indices are currently at or near record levels. Expectations are sky high as investors ignore any semblance of bad or disappointing news. The US November jobs report was a classic example. Despite non-farm job creation of 245,000 meaningfully missing expectations of 460,000, investors were heartened the disappointment may, not will, ultimately force warring Democrats and Republicans to a stimulus deal which is now in its fifth month of negotiation. Hope springs eternal, but as share prices continue to rise, so valuations become even more stretched and therefore exposed and vulnerable to disappointment.
Other global markets are also elevated, most within 10% of their respective high-water marks and while momentum is still positive, failure of economies to respond to the availability of a vaccine in a sustainable manner could quite easily trigger a correction of 10% plus. Widespread vaccination will be the key to halting the virus. There has already been some discussion around the possibility of a “double dip” recession in the US as the rate of new infections surges to new peaks with the onset of colder weather in the northern hemisphere.
In most markets, a fully-fledged recovery is already priced in. Debt levels are off the chart. Central bank action is encouraging risk taking on a wide scale and equity investors are embracing “there is no alternative” (TINA) mantra while ignoring skinny low risk-adjusted returns. These returns are relative to low risk-free bond yields. I am not convinced bond yields will remain corralled at current levels indefinitely, as many predict. There is movement at the station already.
Frustrated central banks may consider the validity of yield curve management via asset purchases. They may also finally recognise that essentially underwriting zombie risk is unproductive and delivers diminishing returns in terms of economic activity and job creation. The weak corporates dampen productivity and generally abuse resources, especially liquidity at an unbelievable price.
In the wake of the pandemic, technology stocks led by the FAANGs (Facebook, Amazon, Apple, Netflix and Google) + Microsoft, have sent global technology indices into orbit. Huge changes in social and business behaviour triggered a massive increase in demand from stay-at-home/remote working consumers to update home offices and entertain increasingly bored children. Much of this pull-forward demand for office hardware and entertainment services, driven by necessity, is unsustainable as restrictions are lifted and open air and space become accessible. Otherwise start researching optic and eye health companies as retinas and pupils are damaged and macular degeneration spikes from over-exposure to computer, iPad and iPhone screens.
If there was one stock which emulated the saying “out with the old in with the new” it would be Tesla. As it joins the S&P 500, its market capitalisation is over US$600bn which is greater than the combined capitalisations of Ford, General Motors, Volkswagen, BMW, Fiat Chrysler, Toyota, Honda, Nissan and Hyundai. That does appear somewhat excessive and a sign of the times. Perhaps a reality check is in order.
Australia – Seeking normality as recession passes
Australia is desperately seeking a return to normality. Being an island continent, Australia had a much better chance of controlling coronavirus than both the US and Europe. Despite the cold climate, Antarctica was also successful. But getting the economy back on a
sustainable path to full recovery will be much more challenging. While the availability of a vaccine will assist the process and provide more certainty, the behaviour of the corporate sector in terms of job creation and investment will be critical. Households have done the heavy lifting within the private sector over the past decade and now require meaningful support given household income growth will remain well below trend for some time as wages growth basically flat lines as support programs are withdrawn.
The Reserve Bank’s (RBA) monetary policy is locked in, laser-like, on employment and inflation. The trend in both these sensitive economic benchmarks will determine the longevity of a cash rate at 0.10% (10 basis points). Governor Philip Lowe says the board “is not expecting to increase the cash rate for at least three years” and “is prepared to do more if necessary” in terms of the size of the asset purchase program (quantitative easing). These are very definite statements, and it will be interesting to see what events trigger a blink of the eye.
The clear priority of fiscal policy has been to restore the million plus jobs lost earlier in the year. The Seeker/Keeper support programs were very successful in stemming the losses and importantly shoring up household income. In the June quarter the total number of jobs fell 7% or by 1.028 million and hours worked fell 9.8%. In the four months ended October, 375,000 jobs, or 36.5% of those lost, were restored still leaving a void of just over 650,000. The closing down of the Victorian economy will impact November’s reading, its reopening supporting December’s. But the long haul is ahead with company management still proving cautious in adding to the workforce while others are still trimming. Despite the reopening of domestic borders, Qantas is still cutting, so are financial services. It is likely unemployment will stay above 6% throughout 2021 and underemployment above 10%. The October participation rate increased to 65.8% adding upward pressure on the unemployment rate and we may see January’s 66.1% record challenged.
Inflation remains subdued and well below the RBA’s 2%-3% target range. Markets are convinced inflation will continue to hibernate for years. The RBA’s prediction on the cash rate being unchanged at 10 basis points until 2024 also coincides with that conviction.
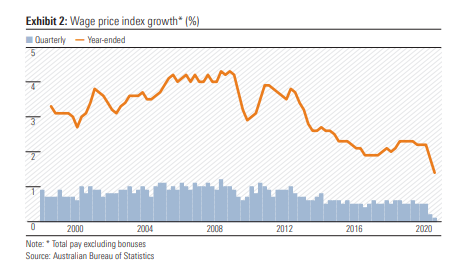
The RBA will be hoping employment growth and tax cuts will support household income and combined with elevated savings and a seven-year high in consumer sentiment, will underpin growth in household consumption. Offsetting this will be the withdrawal of Seeker/Keeper income support programs and below-trend wages growth as unemployment remains above 6%. The conditions for demand-pull inflation are not evident given excess capacity exists across most of the economy. (Exhibit 2)
The stronger than expected GDP growth of 3.3% in 3Q20 was driven by household consumption, particularly of services (+9.8% and goods +5.2%). After a 12.5% contraction in 2Q20, household consumption rebounded by 7.9% in 3Q and with the reopening of the Victorian economy, further growth is expected in 4Q. With the Westpac-Melbourne Institute Index of Consumer Sentiment hitting a 10-year high in December, together with an iron ore-driven positive contribution from net exports and continued strong public demand (infrastructure spending), GDP growth of 2%-2.5% is expected in 4Q. The contraction for 2020 is likely to be just over 2%.
Growth between 3% and 3.5% is expected in 2021, suggesting Australia’s GDP will recover the lost ground in 2020, perhaps by 2Q21 but certainly by 3Q. But the onus will be squarely on the household and therefore employment, which is still tenuous. The iron ore price is likely to pull back from current elevated levels, weighing on the contribution from net exports. We will need to see an upturn in credit demand (financial aggregates) for both housing and business from the well-below trend levels currently being recorded, as these are meaningful drivers of economic activity.
China is an integral part of Australia’s growth forecasts. Should the current spat escalate as Chinese commercial aggression breaks new ground, downward revisions may have to be addressed. Clearly Australia has an over reliance on China and this concentration risk should not be ignored by government or investors. On-shoring is not the answer given the yawning gap in wage rates.
The A$ is likely to continue to strengthen against the US$, as the latter weakens.
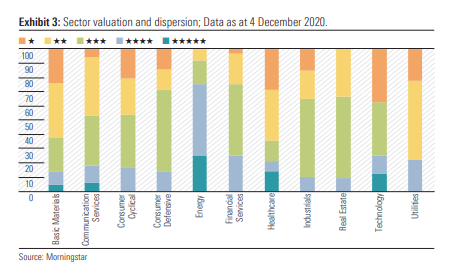
At current levels we view the market as moderately overvalued. The average unweighted price/fair value estimate ratio of our coverage is 1.14, while the cap weighted average is 1.26. The most undervalued sector is Energy with a median P/FVE ratio of 0.70 and a cap weighted ratio of 0.77. The most overvalued sectors are Retail and Metals & Mining with median P/FVE ratios of 1.38 and 1.36, respectively. (Exhibit 3)
United States – somewhat of a misnomer
Hark back to the time Barack Obama returned the Democrats to the White House winning the presidential election in November 2008 and taking control on 20 January 2009. The transition was relatively seamless. Civil unrest was virtually absent.
Back to the present, and hopefully not far into the future. The US is now facing acquisition and transition risk. Acquisition risk as the Democrats have acquired the White House and transition risk given the width and depth of the social divide within the country. Donald Trump becomes the first one-term president since George H. W. Bush (1989-1993) and it does not sit well with him or over 70 million voting Americans.
The global outbreak of coronavirus has brought recessions to most of the developed world economies, predominantly the US and Europe. The combination of an economic shock of record-breaking proportions and widespread social disruption means the fracture is not clean, but compound. It will take much longer to heal, but financial markets continue to ignore longevity risk at their peril.
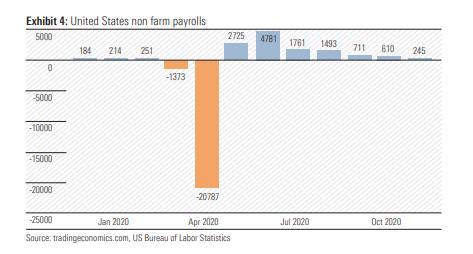
Starting with employment and unemployment, the challenges will be meaningful and testing. In March and April 22 million American jobs were lost. Since May the economy has clawed back 12.3 million and there are at least 10.7 million still unemployed. While coronavirus infections surged to new peaks in November, resulting in renewed shutdowns and restrictions, the loss of traction in the jobs market must be of concern. President-elect Joe Biden used colourful and provocative adjectives, describing the November jobs report as “grim” and warning of a “dark winter” ahead if Congress did not pass the relief bill. Will they be enough to budge the Republicans into a deal before his inauguration on 20 January? (Exhibit 4)
The Federal Reserve (the Fed) will continue to support the economy by ensuring the financial system is well greased with enough liquidity to allow efficient and effective operation. But the liquidity created will also support risk asset markets and risk taking. With the change of residents in the White House, chairman Jerome Powell’s life will be more settled. The appointment of the dovish former Fed chair Janet Yellen to the post of Treasury Secretary is likely to see a more cohesive approach to monetary and fiscal policy, sadly lacking over the past four years.
However, despite being on the same page Powell and Yellen face an unsettled and uncertain environment which is likely to prove quite testing for some time. 2021 will not be a “walk in the park” domestically or internationally for the Biden administration. With 10 million jobs still to be restored, and the pandemic far from under control a vaccine can’t come quick enough. But the anti-vaxx movement is alive and well and a new vaccine gives them the opportunity to fly their flag.
The level of social discord is also of concern especially when the country needs cohesion and solidarity. Growing inequality of income and wealth does not make unification easier. Monetary policy is widening the gap and coronavirus has only revealed its extent. The
healthcare system is also letting the lower socio-economic segment down, adding to the frustration and raising the bitterness. The president-elect had better have plenty of answers over the next four years as many questions will be asked of his West Wing.
While the possibility of a “double dip” recession has been aired, it is unlikely. After the 33.1% GDP growth in 3Q20, US GDP remains well below (15%) 4Q19 pre-pandemic levels. A virus ravaged fourth quarter is expected to restrict growth to below 5%, suggesting it will be at least 2Q21 before GDP returns to pre-pandemic levels.
The US$ is likely to remain under pressure through 2021 swamped by the money printing of the Fed. Its purchasing power is being diluted with not a hint of inflationary help.
China – robust recovery continues into 4Q20; sustainability the key question for 2021
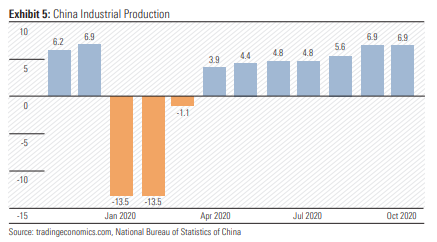
Can the Chinese economy keep expanding at twice the rate of developed economies through 2021? The post-pandemic recovery momentum has continued into 4Q with factory output surging and domestic demand reigniting. GDP growth was restored after one quarter’s contraction. (Exhibit 5)
The 14th Five Year Plan (FYP) (2021-2025) will be revealed at the National People’s Congress in March. These plans are the most important single guiding document outliningthe strategy and policy direction for both economic growth and social development. The central committee of the Communist Party met in October and subsequent plenum documents have indicated little change in the overall policy direction. But there are signals of subtle changes and the dual circulation policy (DCP) will play a decisive role in the 14th FYP.
The DCP, first mentioned in May, lifts the focus of the domestic market or internal circulation. It is a strategic blueprint for the country and its economy to adapt to increasing instability and hostility in the global environment. The first airing was before Biden ousted Trump and it was clear China was determined to become more self-sufficient with president Xi Jinping stating China would “gradually form a new development model in which domestic circulation plays a dominant role.” The DCP is likely to see China reduce its export-driven strategy or external circulation, which has been very successful in elevating its position to the world’s second ranked economy, but without its abandonment.
Replacing high-speed growth with high-quality growth is on the agenda. This perhaps suggests a reduced focus on infrastructure and export growth and a refocus on internal growth. The outsized spending on infrastructure has resulted in diminishing returns in real economic terms in more recent times. We may witness peak demand for iron ore and metallurgical coal from China in 2021.
Security of supply chains in a an increasingly hostile global environment will also have priority. The DCP will address these issues and Made in China 2025 policy launched by president Xi Jinping in 2015 will be reinforced to satisfy dual goals of developing domestic capacity while pursuing global market opportunities. Supply-side structural reform will help in rebalancing the economy.
An increased focus on innovation, technological independence and self-reliance will see a continuation of the transition from cheap-low tech products to high-end and specialised production. This will satisfy the goal to “tech self-sufficiency”.
Despite all stops being pulled out in the final quarter of 2020, China will fall marginally short of its plan to double the nation’s GDP between 2010 and 2020. The miss so close it can be classified as a statistical error. Clearly, China has dominated the global scene over the past decade, with economic growth far surpassing any developed nation. Australia’s iron ore and coal companies have been major beneficiaries of almost continuous stimulus programs since the GFC. That is unlikely to continue.
GDP growth of between 5% and 6% is likely for 2021.
Energy – OPEC and OPEC+
There are currently 23 members within the OPEC+ block of oil producing nations. OPEC+ is a loose amalgam of the core block of 13 genuine OPEC members including Saudi Arabia, UAE, Kuwait, Nigeria and Iraq among others; and the 10 “plus” member states including Russia, Mexico, Kazakhstan, Azerbaijan etc. Over the past five years OPEC+ members have accounted for an average of 50.6 mmbpd or just over 60% of global oil production, excluding natural gas liquids and biofuels. So, it is a useful block with which to manage oil prices, particularly when members adhere to set production quotas.
Or it should be. The fly in the ointment is US shale. While OPEC+ member production essentially held steady over the past five years, US oil production increased by 40% to 12.2mmbpd. And that doesn’t include US natural gas liquids output, which increased by 60% to 4.8mmbpd. OPEC is between a rock and a hard place. It manages oil prices at the expense of giving away real estate to US shale producers. Lifting production cuts could trigger an oil price fall. But keeping cuts in place could prop up prices to the benefit of rivals such as the United States, boosting production as a result.
OPEC (without the +) member adherence to quotas has been uncharacteristically solid during the pandemic. The Saudi-Russia price war in April 2020 saw production surge through the group 25.1mmbpd quota to almost 28mmbpd. But since post-COVID cuts began in May, OPEC production has on average been below the reduced quota. In October, the combined output target for OPEC countries was 21.9 mmbpd, and actual volumes were 21.6 mmbpd (1.1% undersupply), the third consecutive month volumes were below the group target.
Collectively, OPEC+ is on track to shave off approximately 5.5 mmbpd of supply this year, offsetting a substantial chunk of the COVID related demand decline. The OPEC cuts were originally set to be unwound further in January 2021, adding another 2.0 mmbpd to global supply. But sustained depressed global oil demand led to widespread expectations OPEC would decide not to raise production just yet. It surprised the market with a penciled-in 0.5mmbpd production hike from January, albeit much lower than the initial plan. On a year-on-year basis, we currently project an incremental 4 mmbpd from OPEC collectively in 2021, with an additional 1 mmbpd increase from Russia. (Mark Taylor)
It was a rough year for some of Australia’s biggest companies as covid a toll and low rates inflated asset prices.
For the year 2020 only two of Morningstar’s 11 wide moat stocks posted positive returns. At the end of the year Australia’s top stocks were in general back to square one, with the benchmark S&P ASX 200 posting a return of -0.36 per cent.
The top performer among the 11 wide moat stocks was Wesfarmers (ASX: WES), which posted a return of 27 per cent. It was streets ahead of the other stocks on the list. Second place went to Commonwealth Bank (ASX: CBA), which posted a return of almost 9 per cent while the ASX exchange itself (ASX: ASX) recorded about -1 per cent.
Westpac (ASX: WBC) posted the lowest return of -16 per cent. Funeral home operator InvoCare (ASX: IVC) and Auckland International Airport (ASX: AIA) posted similar returns of about -12 per cent as restrictions on gatherings and of course travel bit.
For 2020, the median return for the Morningstar 11 was -6.71 per cent. On an average basis, the 11 trailed the index by 3 per cent.
Morningstar wide moat stocks v ASX 200 benchmark XJO
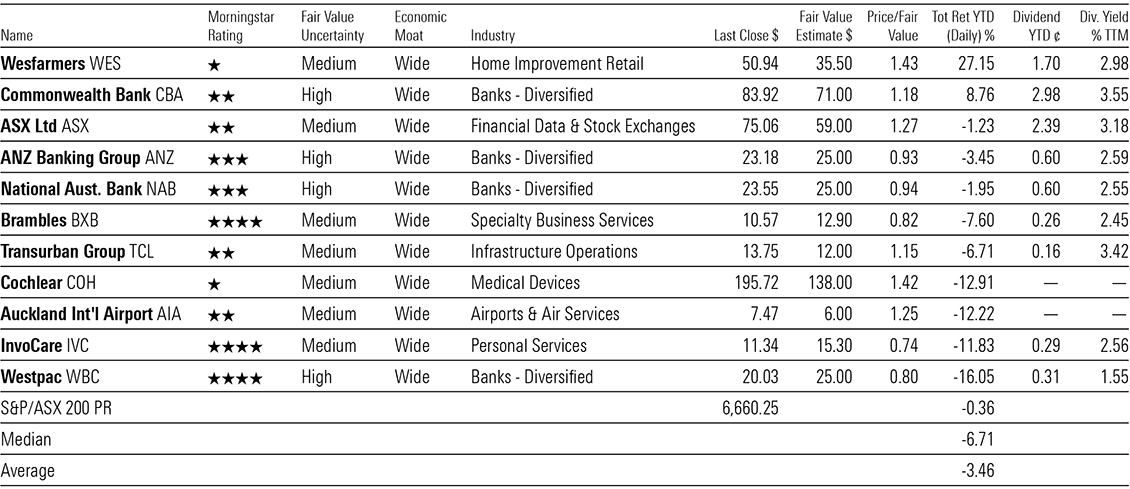
Source: Morningstar Direct
Snapshot of a tough year
The wide moat stocks didn’t escape when the pandemic slammed into markets in late February, causing a historic sell-off. That said, however, it’s crucial to keep in mind that a wide moat stock implies a 20-year advantage, and this is a mere snapshot in what has been a historically bad year for many sectors and companies. And near-zero interest rates have drawn investors to the equity market, which has in turn inflated asset prices.
Morningstar banking analyst Nathan Zaia said the underperformance of some banking stocks was to be expected.
“It’s not too surprising that bank share prices underperformed the market, an economic recession hits bank profits harder than most sectors, with the potential for loan losses to overwhelm provisions, erode profits, and force equity raisings,” Zaia said.
“Fiscal and monetary stimulus, and action by banking regulators and the banks, has prevented the worst-case scenario from playing out though, which is seeing the market begin to reprice the banks. “Banking is a cyclical game; we don’t think the share price underperformance owes to the competitive position weakening, more just the near-term earnings headwinds.”
The competitive advantages of the major banks were not materially affected by the pandemic, said Zaia, adding that investors can expect good returns.
“COVID meant lower profits and dividends in the short-term, and even in the medium-term as cash rates will now be lower (and for longer) than the pre-COVID outlook. But longer-term, the banks sticky retail deposits and operating scale are advantages which will see them generate good returns on shareholder equity again over time.”
Wesfarmers shines
Covid-19 was a boon for Wesfarmers, which owns Kmart, hardware chain Bunnings and Officeworks. Quarantine measures and travel restrictions caused people to spend more on at-home office supplies and on home improvement.
In the September quarter, sales growth in hardware was close to four times the 10-year average rate, according to the Australian Bureau of statistics. Bunnings’ total sales rose by 25 per cent in the four months to October 2020, five times higher than full-year sales growth of 5 per cent in pre-COVID-19 impacted fiscal 2019.
But while covid boosted consumer spending habits, Morningstar director of equity research Johannes Faul argues these changes are mostly transitory and there will be a return to the long-term sustainable sales trend. Wesfarmers is overvalued by 40 per cent, according to Faul’s valuation.
“Our thesis implies a challenging trading period lies ahead for Wesfarmers’ retailing businesses near-term—which we estimate to account for 87 per cent of operating profits in fiscal 2021,” Faul says.
“Although the exact timing of a full reopening of the Australian economy is uncertain, we expect an unwinding of the current favourable sales momentum to occur with the deployment of vaccines in the second half of fiscal 2021.”
Contrast to 2019
It was a stark contrast to last year, in which the median return of the wide moat stocks was 27 per cent versus 21 per cent for the benchmark. Last year, the top performers were the ASX, which posted a return of 35.6 per cent; hearing implant maker Cochlear, which boasted a return of 34.6 per cent and toll road operator Transurban (ASX: TCL), which returned 33.6 per cent. Wesfarmers and InvoCare both returned 30 per cent.
The Morningstar eleven is an exclusive club. To gain entry companies must have a competitive advantage of 20 years. They can do that by establishing one or several of the following characteristics. By either having a strong brand; a cost advantage; a product that is good enough to dissuade customers from changing brands and thereby incur the pain of “switching costs”; a network effect, whereby an increase in the users of a product or service results in a corresponding increase in mutual benefits for both old and new users; and efficient scale, which occurs when a market is effectively served by a small number of producers or sellers.
Undervalued names
As for evaluations only three of the 11 wide moat stocks are undervalued. They are pallet maker Brambles (ASX: BXB), InvoCare, and Westpac.
Brambles is the largest pallet pooling operator globally, operating in 60 countries throughout the Americas, Europe, and Asia-Pacific under its CHEP brand. And it has long-term expansion opportunities in China, India, and Russia, according to Morningstar equity analyst Grant Slade. “Equity markets currently underestimate the value of Brambles’ option to expand into these attractive markets, in our view, providing an opportunity to the astute investor.”
InvoCare remains well positioned to capture tailwinds from Australia’s growing and ageing population, says Morningstar analyst Mark Taylor. It remains the leading funeral service provider with a strong market share of over a third.
“We anticipate the firm’s “Protect and Grow” refurbishment strategy, along with smaller bolt-on acquisitions, will allow the firm to continue growing its share, bolstering its wide economic moat,” Taylor says.
And despite losing share in the home loan market, Westpac is set to boost its capital position, and as the nation’s second largest mortgage lender remains undervalued.
“Losing share in the home loan market, rising operating expenses, and the smallest capital buffer, has been enough to steer investors away from Westpac, but we think the bank is undervalued,” says Zaia.
“Westpac’s capital position looks adequate and will strengthen post asset divestments. We think the bank will be able to once again be competitive with loan application turn-around times.”
Transurban, Auckland International Airport, and the ASX are two stars or overvalued.
Cochlear’s switching costs advantage
Global hearing implant maker Cochlear joins Wesfarmers as the other one-star stock on the list.
Cochlear has maintained a 60 per cent market share among the four players within the cochlear implant market. But the bionic ear needs expertise to install, and Cochlear’s wide moat comes from the relationship it has with developed market ear, nose and throat surgeons, who not only know and trust the brand and its products but also know how to install them.
Hodge says the share price of Cochlear, like many top companies, has been bid up in part because of historically low interest rates.
“Cochlear is high quality and it’s growth and investors are prepared—given interest rates are low—to pay up for those attributes,” Hodge says.
“And we take a longer-term view around the cost of capital and interest rates.
“The installed implant market base is a captive market for its sound processor upgrades and accessories which are not compatible across brands and contribute an increasing share of revenue. We forecast this annuity-like revenue stream to grow from 30 per cent to half of revenues over the next 10 years.
“One of the beauties about Cochlear is that if someone gets implanted with cochlear implants they’re on that platform for life. I can’t think of much bigger switching costs that having something drilled into the side of your head.
“You’ve got a super long-term customer and about 25 per cent of their earnings comes from various updates to the implants.”
Looking ahead
As 2020 draws to a close, positive news on the vaccine front has come earlier than expected. In Australia, markets are up 10 per cent over the past month.
BetaShares chief economist David Bassanese remains bullish on equity markets for the year ahead, noting that it’s likely that equity prices will be higher than they are now in 12 months’ time.
“Valuations in equity markets are currently a bit stretched, with high PE values reflecting the low interest rate environment and anticipated earnings recovery,” Bassanese said on Tuesday.
“But given interest rates should stay low, it implies PE values could also remain relatively high.”
Setting expectations
To answer the headline’s rhetorical question, Mr. Buffett can indeed predict the future of the stock market, just as Glendower can call spirits from the vasty deep. However, Hotspur’s response to Glendower remains salient: “Why, so can I, or so can any man. But will they come when you do call for them?” (In a dissent, Justice Scalia borrowed this same Shakespeare snippet more than 30 years ago.)
The spirits certainly will not materialise if summoned to forecast the stock market’s intermediate-term changes. That mission cannot be accomplished. Traders sometimes can exploit immediate movements in an individual security’s price, especially through high-frequency techniques, but they cannot consistently foresee what will happen to the entire market over the next several months.
That, however, is not Buffett’s aim. His formula establishes an expectation, not a trading recommendation. Said Buffett, in a Bloomberg article that is no longer available (my source is secondary), “The economy, as measured by gross domestic product, can be expected to grow at an annual rate of 3 per cent over the long term, and inflation of 2 per cent would push nominal growth to 5 per cent.” From that figure Buffett adds stocks’ dividend yield. The final equation: Stock total returns = GDP growth (3 per cent) + inflation (2 per cent) + dividend yield.
(This prescription is a rule of thumb, as opposed to a carefully derived solution. Otherwise, Buffett would surely have made corporate profitability the first term of his equation, because profits ultimately drive equity prices more than GDP performance. For example, annual real GDP growth during the 2010s averaged a modest 2.3 per cent, while aggregate profits for S&P 500 companies doubled. Clearly, equity investors responded to the latter news, not the former. )
The longer, the better
A quick glance at the chart below illustrates how poorly Buffett’s formula performs when misapplied. The graph depicts the annual total returns of large US stocks from 1930 through 2018, compared with the projection from Buffett’s method, using his plugs for GDP growth and inflation, plus the dividend yields that were then prevailing.
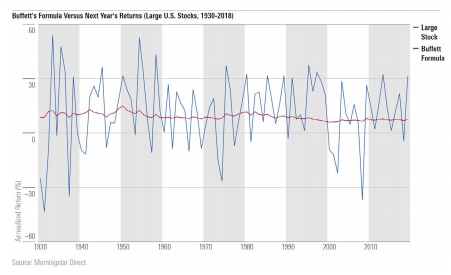
Such was to be expected from an approach that varies only a single slow-changing input. A genuine attempt to predict 12-month returns would incorporate much more volatility. But of course, picking next year’s winners was not Buffett’s goal.
Let’s give his method a fairer test. The dividend yield for large US stocks in 1930 was 3.58 per cent. Adding 5 percentage points for GDP growth and inflation produces a projection of 8.58 per cent. How does that forecast match up against what the stock market delivered from 1930 through 2018? (Never mind why the calculation ends in 2018 rather than 2020; that is a long story, and fortunately also immaterial, as two years’ worth of average returns have no effect on the underlying tale.)
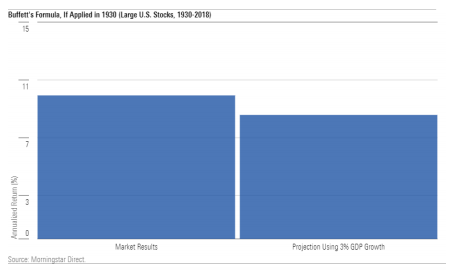
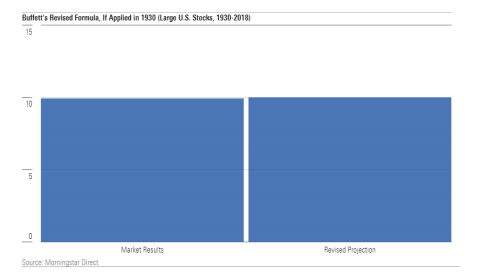
That’s better, but not great. Buffett’s projection understates future stock market total returns by 135 basis points per year. However, most of that difference washes out, because it owes to inflation being higher than Buffett’s approximation. He assumed 2 per cent, but over that 89-year stretch inflation averaged 3.13 per cent, thereby boosting stock prices by 113 basis points. Remove the effect of inflation, thereby making the returns real, and Buffett’s projection almost exactly matches reality.
Using actual GDP growth rather than the 3 per cent plug also improves the forecast, although only modestly, because GDP growth was quite close to Buffett’s assumption, averaging only slightly over 3 per cent. Revising Buffett’s estimate by applying actual inflation and GDP growth leads to a 1930 estimate for future stock returns of 10.00 per cent, only 7 basis points removed from what occurred.
Rolling Time Periods
So far, so good. However, only the very fortunate among us possess a ninedecade time horizon! To be of practical value, Buffett’s heuristic must inform about considerably shorter time periods–say, one decade. My first study therefore evaluates 10-year periods. The blue line represents Buffett’s projection, while the red line depicts future 10-year performance. Thus, for the point labeled 1930, the projection occurred during that year, while the returns date from 1930 through 1939.
For this exercise, I attempted to employ what information would have been available to investors at the time. Thus, I used the prevailing dividend yield and the 3 per cent real GDP assumption. However, as I felt that it was important to account for different inflation regimes, I used future inflation for the projection, as opposed to Buffett’s 2 per cent plug. My approach, obviously, is unrealistic. It would have been better to have entered inflation expectations, as implied by the prices of Treasury Inflation-Protected Securities, but those numbers were not available during most of the period.
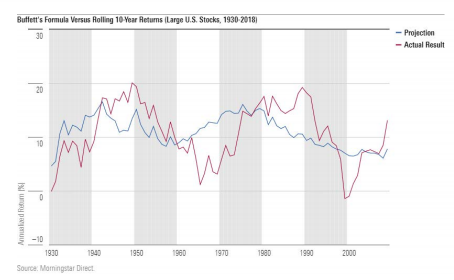
Hmm. I give that result a C, by the grading standards to which Buffett was raised, meaning a B+ today. (The average GPA at my alma mater was 3.44 when last reported.) On the bright side, the Buffett-formula projections were roughly in line with what followed. However, on several occasions they were off by more than 5 percentage points per year. Nor did they reliably reflect the upcoming trend, by being relatively high before stock performed well (or vice versa).
I then assessed rolling 30-year periods. As one would expect, those projections more closely matched reality. That is, they did for the beginning and end of the study period. In the middle section, during the late 1940s and early 1950s, the projections were much too high, because they implicitly assume that the inflation of the 1970s would eventually flow into stock prices. That was false; stocks adjust well to expected inflation, but not when price hikes come as a surprise.
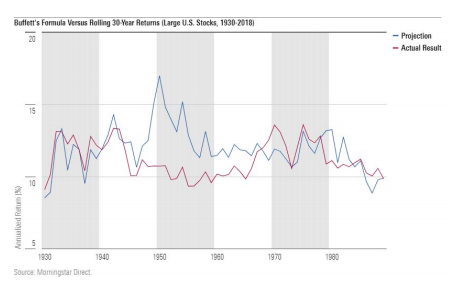
In fairness to Buffett, using future inflation as an input was my idea, not his. But the picture would have been no prettier had I stuck with his original formula, because sometimes a higher inflation rate does increase stock prices. No matter how it is implemented, the Buffett formula struggles when inflation is high and unpredictable. Best under such circumstances to eliminate the inflation component altogether, opting instead to calculate a real expected return.
Looking forward
At any rate, today’s application is straightforward. The 3 per cent real GDP growth estimate remains valid, if slightly optimistic; the break-even inflation rate on 30- year TIPS is 1.86 per cent; and the S&P 500 yields 1.75 per cent. Entering those figures into Buffett’s formula gives a future expected return on large US equities of 6.6 per cent, if expressed in nominal terms, and 4.75 per cent in real terms. By now, it has become a cliche for pundits to proclaim that past stock market returns of 10 per cent should no longer be expected, and therefore standard practice for investors to disregard such counsel.
However, past stock market returns of 10 per cent should no longer be expected. At least not if inflation remains dormant.
John Rekenthaler ([email protected]) has been researching the fund industry since 1988. He is now a columnist for Morningstar.com and a member of Morningstar’s investment research department. John is quick to point out that while Morningstar typically agrees with the views of the Rekenthaler Report, his views are his own.
Holly Black: Welcome to the Morningstar Digital Investment Conference. I’m Holly Black. With me is David O’Leary. He is founder of Kind Wealth. Hello.
David O’Leary: Hi. Thanks for having me.
Black: It’s a pleasure. Do you want to tell us what Kind Wealth does?
O’Leary: Sure. So, Kind Wealth is an advice-only financial planning business. We work with younger generations. Think about it as kind of generations X and Y, so maybe 30 to 50-year-olds is our client sweet spot.
Black: So, we often think about financial advisers being something we come to a little bit later in life when we’ve accumulated more wealth or perhaps, we’re drawing down our pension. What is the challenge in serving that younger client?
O’Leary: Certainly, the average person out there thinks that, oh, a financial advisor is something that someone I go to once I have a lot of money. And that has largely been true because financial advisors charge on a percentage of AUM basis, and so therefore, we all want to work with the wealthiest clients because they make us the most money. And we’ve sort of said to younger people, hey, you know, you don’t have much to worry about, things are fairly straightforward, because you don’t have a lot of assets to worry about. But the truth is, their lives are fairly complicated. I mean, disproportionately, if it’s – maybe I’ll say it this way. If financial planning is tied to changing events in your life that have implications on your money, disproportionately, those events occur when you’re younger – so, you are getting married, you’re having kids, you’re starting a new job, you’re changing careers, you’re starting a business, you’re getting separated or divorced. Those all have massive implications on your money that happen to you in your 30s and 40s. And there are lots of issues as you get older and you acquire more wealth that come into play and you need help with, but it is definitely not true that when you’re younger you don’t need any help.
Black: I mean, I think we do think of financial advice historically as that in-person face-to-face relationship. Technology is changing that anyway. But has the pandemic this year sort of forced clients that weren’t perhaps keen to get on board with tech?
O’Leary: I think so. I mean, we were set up – Kind Wealth was always set up as a virtual delivery. So, we don’t have physical offices and there’s no option for our clients to come in and see us in person. But we’re serving a younger demographic and so that kind of made sense. I think what the pandemic has done is taken all of the sort of laggards to adopt virtual – not all of them, but a big percentage of them who hadn’t been okay with virtual chats to start adopting it.
The other thing I might say, which is really an interesting dynamic, is that you now become indifferent between having a big one-and-a-half-hour meeting with a client or two 45-minute meetings because you’re not losing time in transit. And so, what that means is you can have more focused meetings with a narrower scope to only talk about one or two issues, and then have another meeting down the road not too long after where you talk about other issues that you don’t try to cram too many issues into one meeting where the client gets overwhelmed.
Black: And something I really want to know is, have you met any friction in having that flat fee model? Historically people have paid a commission and sort of thought of the advice as free, even though it wasn’t, and that’s been quite a hard transition for the industry. What have you found?
O’Leary: Definitely with the younger demographic, it’s not hard because they are a lot more aware and alert to the fact – they are a lot more skeptical. So, there’s often a saying, if you’re not being charged for the product, you are the product, something’s free. So, they’re aware of this idea that if you’re getting something for free, you may want to be questioning, wait a minute, how is it that I’m getting this for free and how are they monetising me, right? And so, that is a far more prevalent thing for younger demographic. So, it’s very easy for us. When we talk about it and we explain the model that, hey, we don’t sell any products so that what you pay us for advice, the amount that comes in your bank account, what that buys you is trust that we don’t – there’s no conflict of interest where what we tell you is because we think it’s the best thing for you and not because we’re going to get rewarded or compensated in the back end for selling you a product, and they really value that. So, I think depending on your client demographic, that may be an easier or harder sale.
Black: David, thank you so much for your time. For Morningstar, I’m Holly Black.
I know you want an answer. We all do. It’s been a long slog to get this far in 2020, and to sit in ambiguity even a moment longer feels like an impossible task to many of us. We all want some sort of resolution in this year of unrelenting upheaval and unease, but now is not the time to rush to a conclusion or bet the farm on a particular outcome. It is precisely when emotions are running hot that we need to keep our cool.
Rushing into action, you fail.
Trying to grasp things, you lose them.
Forcing a project to completion,
you ruin what was almost ripe.
Therefore the Master takes action
by letting things take their course.
He remains as calm at the end
as at the beginning.
—Lao Tzu
Uncertainty is stressful. In fact, humans have been shown to prefer even physical pain to the stress of uncertainty, but we have to be careful right now to avoid making rash investment decisions that we might soon regret. Here, I’ll do my best to give you some healthy food for thought to help you keep your head while others are losing theirs (and possibly blaming it on you).
Doomsday narratives don’t help
Regardless of your political persuasion, you’ve likely been inundated with end-of-the world messaging as of late. It is a common and effective political tactic to claim that “the other guy” represents an existential threat to everything you hold dear. This narrative isn’t new on the campaign trail, but this year it’s coming amid a slew of other threats to life, liberty, and property such as an uncontrolled virus, record-breaking wildfires, typhoons, earthquakes, and hurricanes, massive civil unrest, widespread unemployment, and even murder hornets! In a typical election cycle, the Armageddon trope is less convincing, but this year … it resonates.
With doomsday headlines everywhere, whichever way the race comes out, roughly half of the voting population will worry that life as they know it is over. I’m personally concerned about this because, though fear is a powerful political motivator, it doesn’t help us manage money well.
Beware of short-term thinking
The real existential threat to your finances is short-term thinking. Decades of research show us that short-term thinking is linked to increased impatience and discounting of future rewards[1], impulsive decisions[2], higher debt[3], lower savings [4], excessive risk-taking [5], and poor health decisions [6].
Fear and uncertainty can make short-term thinkers of the best of us. End-of-the-world narratives and our current state of pandemic confusion only serve to exacerbate the problem. It’s hard to plan for a 20-year time horizon when you can’t see past next week.
To maintain your cool as a long-term investor, you simply must find ways to see past the immediate crises. We can do this by turning our attention away from the uncertainty of things we can’t control and toward things that are certain and things we can control.
Confronting uncertainty with diversification
“I’ve had many worries in my life, most of which never happened.”
—Mark Twain
If the market does have an extreme reaction to the election, you can turn either outcome into an opportunity. In the case of a market crash, you’ll have the chance to buy some great companies when they are at a discount. If there is a large upswing, you can sell some winners that have become overpriced. However, our analysts are doubtful that the market will have an extreme reaction to the election but think it more likely to track the progress of a coronavirus vaccine.
If you are anxious because you are holding a portfolio that is heavily overweighted in one sector or asset class, you may want to ask yourself some questions about how that came to be the case. I’d wager emotion is involved somewhere. What does this overweighting tell you about your true appetite for risk and reward, and how can you use this information to help you make decisions going forward?
Holding a large percentage of your assets in just a few stocks is an extremely risky business regardless of who sits in the White House. Sitting on too much cash means missed opportunities for growth. If your portfolio is undiversified, you’re at risk for losses, but not because of politics. Consider talking with a financial advisor who can help you create a portfolio that suits both your temperament and your financial goals.
There is always something worth investing in
Regardless of who ultimately occupies the White House in 2021, businesses will still need to adapt to an economy that is undergoing structural changes, a natural resource landscape that is experiencing shifts in weather patterns, and a labour force made up of people who need to stay healthy and who increasingly demand equity and representation for all.
This means that there will continue to be opportunities for innovation in areas like energy production, agriculture, biomedical research and engineering, insurance, property management, and on and on. The opportunities are endless for investors who are thinking about the long term. The specific securities that you choose to buy or sell might change with the election outcome, but your investing principles shouldn’t. Buy value. Sell hype. Learn to recognise both.
Patience is hard work
You’ve likely heard about the famous “marshmallow experiment.” In this study, researchers showed that kids who had the self-control and patience to wait alone in a room with a marshmallow without eating it (not an easy task for a kid!) were the same kids who showed signs of greater success later in life. My favourite detail about this study is that the kids who waited usually had some sort of coping method to help them. They would sing little songs, turn their toes into pianos, and find other ways to distract themselves.
We have more at stake than a marshmallow. In a very real way, some people’s lives and livelihoods are uncertain in this time of ambiguity. However, the skills necessary to wait for a marshmallow are the same skills we need to employ with all our might while we wait for the outcome of this election. That’s the true lesson of the marshmallow experiment—that those who have healthy ways to cope with uncertainty are more likely to have positive long-term outcomes in many areas of their lives. So, let’s learn from those 4-year-olds and get busy with positive actions while we wait for the outcome of this election.
To that end, reading the news and “doomscrolling” right now is like sniffing the marshmallow. It doesn’t help you cope because it increases the pain of waiting in uncertainty. Instead, invest that precious time and energy in something you know will give you a positive return. Be present with your loved ones. Speak kindly to your neighbours. Take your anxiety out for a walk or a run in nature. Sing. Meditate. Dance. Sleep. Do what it takes to stay balanced in your thinking so that you will be mentally ready to take advantage of the coming opportunities when they make themselves clear.
This time of uncertainty and delay will pass. Others will follow. I’ll leave you with another of my favourites from Lao Tzu:
“Do you have the patience to wait until your mud settles, and the water is clear? Can you remain unmoving until the right action arises by itself?”
——————
Footnotes
[1] Weber, E., Johnson, E., Milch, K., et al. 2007. “Asymmetric Discounting in Intertemporal Choice.” Psychological Science, Vol. 18, No. 6, P. 516. [2] Moreira, D., & Barbosa, F. 2019. “Delay Discounting in Impulsive Behavior.” European Psychologist, Vol. 24, No. 4, P. 312. [3] Ikeda, S., & Kang, M. 2015. “Hyperbolic Discounting, Borrowing Aversion and Debt Holding.” The Japanese Economic Review, Vol. 66, No. 4, P. 421. [4] Xiao, J., & Porto, N. 2019. “Present Bias and Financial Behavior.” Financial Planning Review, Vol. 2, No. 2. [5] Deliema, M., Shadel, D., & Pak, K. 2020. “Profiling Victims of Investment Fraud: Mindsets and Risky Behaviors.” Journal of Consumer Research, Vol. 46, No. 5. [6] Wang, Y., & Sloan, F. 2018. “Present Bias and Health.” Journal of Risk and Uncertainty, Vol. 57, No. 2, P. 177Netwealth, Afterpay and Fortescue Metals Group are among the most overvalued no-moat names under Morningstar coverage.
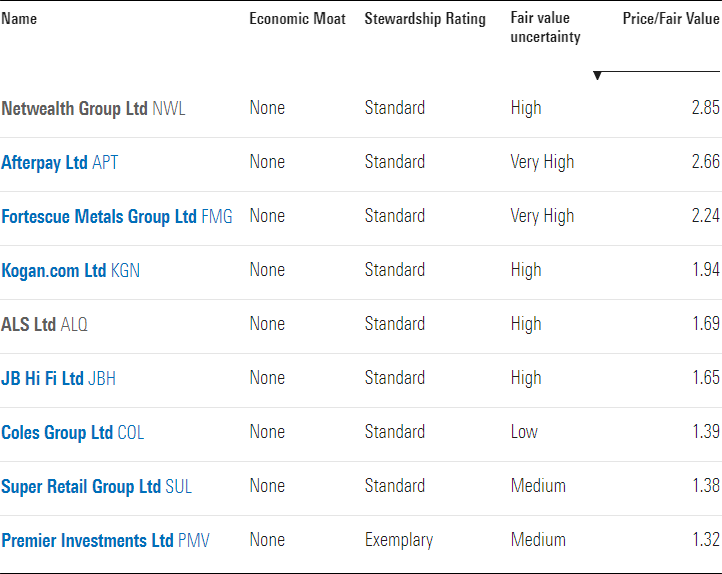
A Morningstar stock screener that filtered for no-moat stocks that are significantly overvalued according to their price/fair value ratios revealed nine names.
More than half the list comprises names from the Consumer Cyclical sector. The most overvalued name in this sector is online electronics retailer Kogan.com (ASX:KGN).
Netwealth (ASX:NWL), a cloud-based wealth administration business, is the only Financial Services name on the list. It has risen more than 220 per cent since its mid-March lows. It is now overvalued by 188 per cent, according to Morningstar analyst Gareth James.
Buy now, pay later provider Afterpay (ASX:APT) has had an even more spectacular rise. It has risen by 1000 per cent since the sell-off of 23 March. It is 161 per cent overvalued, according to Morningstar analyst Shaun Ler.
Iron ore miner Fortescue Metals Group (ASX:FMG) has posted a year-to-date return of 60 per cent. It is overvalued by 126 per cent, according to Morningstar director Mathew Hodge.
The stock screener contains several other observations on price/earnings, dividend yield and return on equity.
Price/earnings is a widely used metric for valuing a company that compares the stock price to the current earnings. The three highest PE ratios on the list of nine belong to Netwealth Group (94), Kogan.com (73) and materials testing company ALS Ltd (ASX:ALQ) (59).
The highest dividend yield—the percentage of the current stock price that was paid in dividends in the previous year—goes to Fortescue (10.13 per cent). The rest of the names on the list offer dividend yields ranging from 0 (Afterpay) to 3.98 (electronics retailer JB Hi Fi (ASX:JBH)).
Another observation to make concerns Return on Equity—a measure of profitability whereby a higher value shows a higher proficiency in using company assets to generate profits. The top three names in terms of ROE are: Netwealth (62.43 per cent), Fortescue (40.14 per cent) and supermarket giant Coles Group (ASX:COL) (32.75 per cent).
At the other end of the ROE scale is Afterpay at -2.49 per cent. It is the only name on the list with a negative ROE.
Afterpay, on the other hand, dominates the list in terms of YTD return at 230 per cent. It is followed by Kogan.com (174 per cent) and Netwealth (123.14 per cent).
The lowest YTD return belongs to ALS at 2.52 per cent.
In terms of 10-year annualised return, the top names are: Premier Investments (ASX:PMV) (14 per cent); Fortescue (13.20 per cent); and JB Hi Fi (11.45 per cent).
The Morningstar Fair Value Estimate tells investors what the long-term intrinsic value of a stock is, helping them see beyond the present market price.
Morningstar calculates the fair value estimate of a company based on how much cash analysts think the company will generate in the future. When determining the fair value estimate, Morningstar also factors in the predictability of a company’s future cash flows—the uncertainty rating. A stock with a higher uncertainty rating requires a larger margin of safety before earning a 4- or 5-star rating.
Source: Morningstar Premium; data as at 3 November 2020
Following is a Morningstar analyst snapshot of the three most overvalued names on the list.
Netwealth
“Netwealth’s share price has increased by 240 per cent since its low in March 2020 and is up by over 100 per cent over the past year. However, we believe this strong performance is more reflective of the significant decline in interest rates and associated increase in asset prices than a material improvement in Netwealth’s earnings outlook. Lower interest rates encourage investors to pay higher prices for assets, and technology-related stocks have been key beneficiaries in recent months. This likely reflects their ability to avoid, or even benefit from, the coronavirus pandemic, in addition to their often-high rates of recurring revenue.” —Gareth James
Dig deeper: Netwealth still racing higher and looking increasingly overvalued
Afterpay
“While we revise our valuation to reflect slightly more transactions per customer (due to recent moves to add new features to its product and the expansion of product categories), we maintain our view that competitive pressures and gradual easing of fiscal stimulus—amid a global recession—will limit strong financed sales growth it achieved historically. Our forecasts assume underlying sales growth in its key markets of ANZ, the US and UK to more than halve from fiscal 2021 levels in fiscal 2022.” —Shaun Ler
Dig deeper: Highly engaged customers key to Afterpay’s success; FVE marginally increased
Fortescue Metals Group
“Fortescue Metals Group is the world’s fourth-largest iron ore exporter. Margins are well below industry leaders BHP and Rio Tinto, and some way behind Vale, meaning Fortescue sits in the highest half of the cost curve. This is a primary driver of our no-moat rating. Lower margins primarily result from discounts from mining a lower-grade (57-58 per cent-grade) product compared with the benchmark, which is for 62 per cent-grade iron ore. The lower grade is effectively a cost for customers, which results in a lower realised price versus the benchmark.” —Mathew Hodge
Dig deeper: Miners share prices generally tread water in September quarter and remain modestly overvalued
Netwealth, Afterpay, Fortescue – 3YR
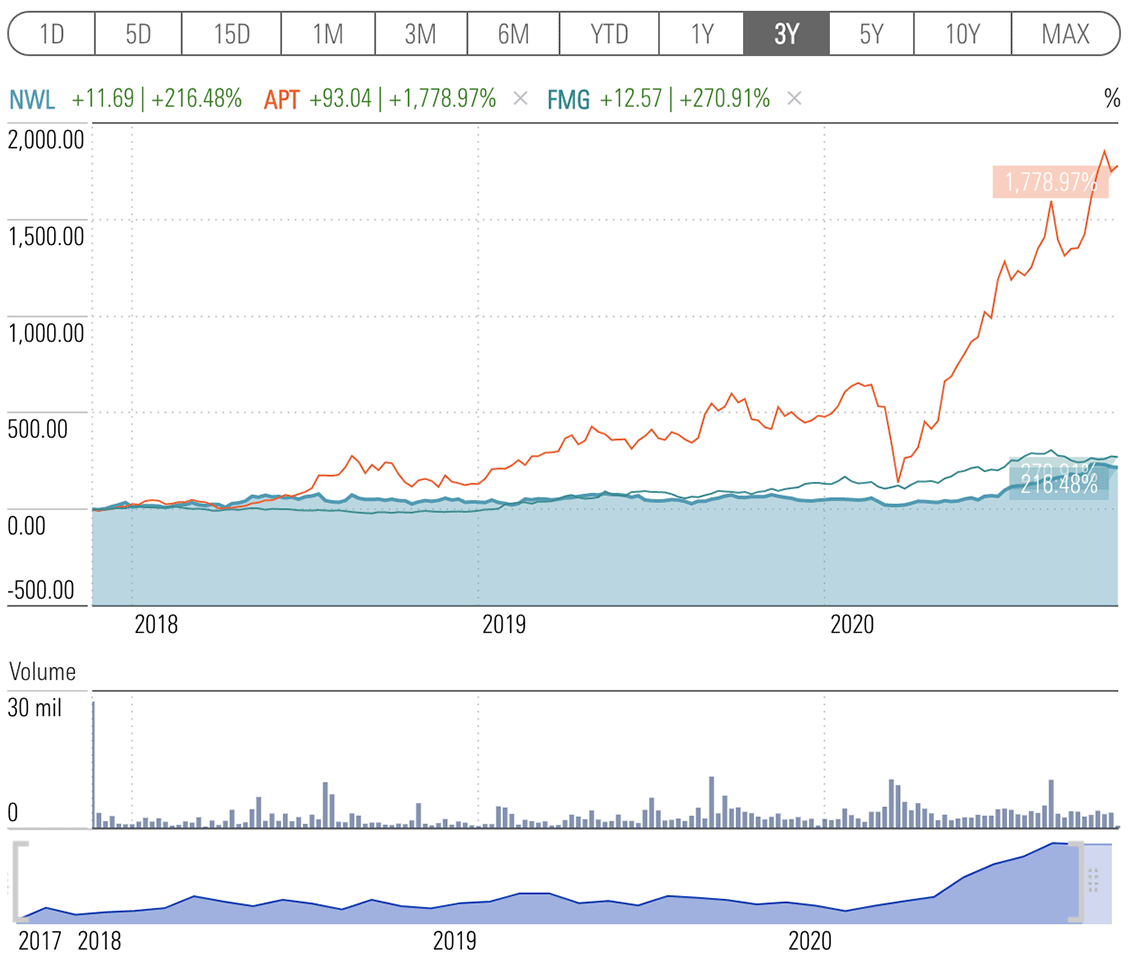
Source: Morningstar Premium; data as at 3 November 2020
(This is an edited version of an interview by Michael Kitces, who is widely recognised as the publisher of the #1 financial planning blog in the United States. His website, kitces.com, is also home to the popular ‘Nerd’s Eye View’. See end credits for more details).
Bill Bengen is the former owner of Bengen Financial Services, an independent advice firm based in Southern California. He’s known as the father of the 4% ‘safe withdrawal rate’ that he put into practice.
Bill discusses how he first developed the safe withdrawal rate research, the retirement problem in the early 1990s that he was trying to solve, how Bill integrated his 4% rule into his financial planning business, and why he didn’t actually use the 4% safe withdrawal rate with his clients.
Michael: The research that you did around retirement withdrawals – what I think now we collectively call the 4% rule – has been around for more than 25 years since you originally published the article on it.
So talk to us now about the evolution of the 4% rule research that you did. What was going on at the time that made you say, “Okay. I want to do some research and write a paper about this and take a swing at what I think is going on with this retirement thing?”
Bill: Yes, I can tell you, the last thing I wanted to do with a fast-growing practice was to get involved in a research project that would take several thousand hours of my time, evenings, and weekends. But clients were coming to me and they were asking, “I want to save for retirement. How should I save? How much should I save? And then, when I go into retirement, how am I going to spend this money? How do I set my investments up?”
I just completed a CFP course within the last year, 18 months. That’s about 1993. And I couldn’t recall anything in any of those textbooks that addressed these issues. I spoke to people and I got a lot of different answers. There seemed to be rules of thumb based on vague experience. No one had any definitive analysis that I could find. So I said, “I guess I’m going to have to do it.” So I just got out my computer and my spreadsheet, got a copy of the Ibbotson data and started cranking numbers. That’s what it came down to.
Michael: And so, can you set the context for us at that time? What were the rules of thumb and things going around at the time that you were looking and saying, “Yeah, this isn’t cutting it, we got to go a little deeper on this?”
Bill: Well, some people said the average portfolio return is what, 7.5%? A 60/40 over time, so you should be able to take out 6%, 7%, no problem. A lot of people said, “Oh, my goodness, you’re in retirement now. You have to be in bonds, 100%. You can’t afford the risk of the stock market. What are you thinking?”
And of course, when I get into the data, neither one of those positions turned out to be viable. They were both wrong.
Michael: How did you ultimately come to this number of 4%? What made 4% the magic number that says this is the one that Bill has dubbed safe for all of us?
Bill: Well, I experimented with portfolios of different allocations and took the withdrawal rate down until I got a portfolio that lasted 30 years. And at that time, I was only working with two asset classes, basically, large company stocks and treasury notes. And I got a number of 4.15%. I created this chart and I looked at it and I said this is amazing because the withdrawal rate is the same over a very wide range of stock allocations, I think between 45% and 75%, it was about the same.
So at that point, it didn’t appear to make too much difference what you choose. But I knew that a very heavy stock allocation was bad and a very low stock allocation was bad. So I came out with a number and, of course, that number has haunted me for years since then because you know that one number cannot represent the experience of so many different retirees. There’s just too many dimensions to the problem to have a one-number solution.
Michael: And to think you went out with the thing that became so popular, people started calling it a rule of thumb and saying that’s ridiculous because it’s too generalised.
Bill: Yes, I don’t think I ever used the term ‘4% rule’. That was kind of a creation of the media. When I got introduced to the media, they wanted something simple to present to their readers. And they focused on that and said, “This is the answer,” like a tic-tac-toe game, put the X here.
Michael: A lot of people will point out like, “But Bill, we only get half a percent on some of our bond returns right now. When you were doing that research, you could get 6%, 7% to 8%.” It’s like, “Yes, but when you were doing the research, we were coming off double-digit inflation environments not that many years before.
So when you start looking at things like real rates of return after inflation, we may be in a somewhat lower return environment, but they’re not nearly as low a return as sometimes we make it out to be because we look at the nominal and forget the real.
Bill: Yes, I absolutely agree with that. I think it’s an overreaction. I haven’t been able to develop scenarios myself in our low inflation environment where it goes below 4.5%. So I’m not sure where those concerns are coming from. I haven’t seen the background work behind those claims, those concerns.
Michael: So I guess the big asterisk to the whole thing about 4% rule and that original research is just, today, we do have more investment opportunities. We own more than it – lower than two-asset class portfolio, large cap U.S. stocks, intermediate U.S. government bonds, and nothing else. And I guess it’s no great surprise, or as we know from modern portfolio theory, in theory, if we have more diversified portfolios, we can get better risk-adjusted returns. And I guess, when you put the safe withdrawal rate lens on it, you get a similar effect, more diversification and less volatility for a unit of risk. And then, you end up with more retirement income sustainability, and your 4% rule becomes a 4.5% rule.
Bill: One thing I noticed when I introduced the small cap stocks, because they’re much more volatile asset class than large caps, where before I had a very wide plateau between 45% and 75% stocks. It narrowed it down to 50 or 60 as being the optimum equity allocation.
Michael: Interesting. So as you got more diversification in there, it kind of narrowed in like here’s really the optimal balancing point of enough but not too much on the risk spectrum.
Bill: Exactly.
Michael: So I am curious then, what did this look like in practice with clients? Was this something you used in practice with clients? Was this like cool research but we still have to do it other ways when you get down to individual client’s circumstances? What did the 4% rule or 4.5% rule look like for you as a practitioner with clients?
Bill: Well, when I started my practice, I didn’t actually have too many clients in retirement, okay, they tended to be closer to my age and only in the later years of my practice. But clients liked the idea. They understood the basis. They read the material. They thought it was sound.
You have to be very upfront with clients and explain to them that this is not a science we’re doing. Okay? It’s not like Isaac Newton sitting down and developing his three laws of motion in physics, which will probably stand for billions of years into the future. What we’re doing is almost a social science. We’re examining the past and we have data, but we don’t have an underlying theory that relates data and facts. So we can’t use it to predict anything. We can only use it as a guide.
Michael: So as you went through this with clients, was the 4% rule largely your number, or did you start using 4.5% after you did your book and kind of found, “Hey, once we get more diversification here, this number goes up.”? Did you have a different number you used for some clients?
Bill: I used about a 4.2% number to start. But you know every client’s situation is different. I had clients that were 5.5% because they are expecting a large inheritance, let’s say five years down the road, that they’re fairly certain of. And I have clients who were down at 3% because they had a pension plan that had no inflation adjustment. So over time, they were going to have appreciating demands put on their portfolio to support their income stream. So, yeah, we start with four, but there’s a wide spectrum around it.
Michael: As you built your business, how many clients did you find was your comfort point? When was it no more for you?
Bill: I got up to about 80 clients. I found that was about all I could handle, the real books that I had. That was a comfortable number, so I tried to keep it right around there.
Michael: Okay. So you got up to about 80 clients and kept it there. My guess is that if you leave or move or, unfortunately, pass on, you free up a few spaces. You add a few clients back in and just for you and your wife helping you in the practice that was the comfortable level of, “I can serve these clients, the income is good. We’re going to hang out here.”
Bill: That’s right. No, even with that limited number of clients, I spent a lot of hours working nights, weekends, and I’m sure a lot of solo practitioners do that. I was younger; I’ve always enjoyed working hard. But if I had to do it over again, maybe I’d hold up to 60 clients.
Michael: It’s the amazing thing about the advisory business, though, is just clients tend to stick around as long as we’re servicing them well. They pay a pretty good dollar amount per client at the end of the day. You don’t need an immense number of client relationships to have the math add up pretty well.
Bill: No, it’s really, to me, it’s beautiful profession. At least, it was back when I was in it. You have a very close … you feel like you’re really making a difference in people’s lives on a day-to-day basis, you have a direct personal contact with them, they can get you anytime they want to. And you know you have the technical skills and the support systems to do whatever they need to get done. So it’s very, very, very satisfying.
Michael: And so, how long did you continue to run the practice? When did you ultimately decide you were ready to be done done?
Bill: Twenty-five years, just about, and that was 2013 when I retired. Quite frankly, I had concerns about the market, investing. I always told my clients that I would invest my money exactly as I invested theirs. As we moved into the middle of the 20 teens, I didn’t think that was possible anymore. I felt I needed to get much more conservative, but I didn’t want to impose that on them. Because the market could continue to go up. And so it did. So I figured I had a good run, time to cash in, go on to something else.
I did a great job when I got my clients completely out of the market in late 2008. So they never suffered the losses that other folks did. On the other side, I did a lousy job getting them back into the market after the crisis ended. If I knew then what I know now, it would have been a completely different process. But the whole financial planning profession is built around buy-and-hold philosophy, I understand that.
I think that’s a mistake. I think our profession needs to be open-minded and look at alternative means of managing money and not just assume that buy and hold is the correct way to do it. Buy and hold is what I used in my analysis, my 4% rule. One thing is because it’s a lot easier to analyze things than multiplicity ways you can manage money by other means. But just because I did that analysis, I told people, it doesn’t mean you have to manage your money that way.
And I remember going to an FPA meeting late in November of 2008. And advisors, you know, they look like they’ve just been beaten to death. They didn’t know what to tell their clients. They lost so much money for them. They were literally in tears. And I wasn’t in that situation, which I thought was cool.
Eventually, of course, the money came back, or a lot of it. Thanks to QE. But I didn’t have the process in place at that time to get back into the market. There were clear indications now, if you look at that March and April we should be heading back in there heavily.
Michael: And so, as you look at it today, you’ve now done literally decades of this research, you’ve lived it, you’ve lived with multiple market cycles, so I guess I’m wondering two things. One, how do you look at the 4% rule today? Is that still the number, or is it 4.5% or is it 5% or is it something else?
Bill: I think somewhere in 4.75%, 5% is probably going to be okay. We won’t know for 30 years, so I can safely say that in an interview.
Michael: And you think of that paired with, it sounds like, with a more conservative allocation, at least for the time being given where valuation is?
Bill: Yeah, I think in the course of my career, to avoid large losses, yes, with the thought that if the market were to return to historically reasonable valuations, let’s say, high-teens, mid-teens in the Shiller CAPE. Then I would look in to get very, very aggressive in stocks. Maybe higher than 50% to 60% I would recommend because there are very few sources of reliable income. And fixed-income investments are giving me nothing. So, I thought I’d go to 80%, 70%, 80%, 90% dividend-paying stocks if I could get them at cheap enough prices. I’m not concerned about safety. Because if you buy something at the right price, you’re good for many years. So that’s kind of a radical change in my view, but I think that is necessitated by the times.
Michael: And all driven by this combination of low yields, which will drive you towards more stocks but low inflation, which actually gives you comfort that we don’t need to be hanging out down like 2% or 3% withdrawal rates, high 4% is enough, 5% is still reasonable because at the end of the day, when inflation is this low and you’re only spending a few percent, you actually don’t need a huge amount of growth in your portfolio.
Bill: No, but once you get into preserving the capital, when you retire, you’ve got that chunk of money, you want to preserve it; you don’t want it to get diminished by any substantial amount because it may not come back. It may not.
Michael: So out of curiosity, anything you’ve learned as a retiree, compared to what you advised retirees – does the view look different from the other side of the retirement transition as you think about the advice you gave and now the advice you’d want to receive as a retiree?
Bill: I always told my clients, they should be thinking of retirement as moving towards something, not away from something. You’re not moving away from your work life. You’re working to a whole new scheme of life. And that therefore you should have things, whether it be hobbies, activities that you want to be actively involved in and know what they are. And perhaps setting the groundwork for that before you retire. I’ve got my writing, my research, which is part of the reason I retired. I want to have more time to do all that.
And that’s worked out very well. So I feel pretty comfortable how retirement … I can’t even call it retirement. I’m putting in five days a week of writing. Weekends are still meaningful to me, believe it or not. It’s not all one anomalous, amorphous time span. There are weekends that are workdays. And I expect that gives meaning and structure to my life.
Michael Kitces is Head of Planning Strategy at Buckingham Wealth Partners, a wealth management services provider supporting thousands of independent financial advisors.
In addition, he is a co-founder of the XY Planning Network, AdvicePay, fpPathfinder, and New Planner Recruiting, the former Practitioner Editor of the Journal of Financial Planning, the host of the Financial Advisor Success podcast, and the publisher of Nerd’s Eye View through his website Kitces.com, dedicated to advancing knowledge in financial planning. In 2010, Michael was recognised with one of the FPA’s “Heart of Financial Planning” awards for his dedication and work in advancing the profession. This extract is reproduced with permission.
Local oil & gas producers are some of the best placed to weather the COVID-19 meltdown and emerge comparatively stronger.
Australian E&Ps Ideally Placed to Emerge From Coronavirus Meltdown
Australian energy stocks look cheap. The COVID-19 outbreak has created a large dent in near-term oil demand and triggered spiralling energy prices. The market appears to be extrapolating the current bearish oil environment to infinity, a position we don’t share. U.S. shale still accounts for over 10% of global oil supply, and unless prices rebound to encourage drilling, a current global supply glut will ultimately become a shortage. Our midcycle Brent crude price forecast is unchanged at USD 60 per barrel, well ahead of current circa USD 40 per barrel levels. But the benefit of higher prices in the future will only benefit companies that can survive the current period—strong balance sheets and low operating costs are vital ingredients. Thankfully, Australian companies by-and-large fit this bill, and none are on the hook for major capital expenditure in the near term. We have 5-star recommendations on the four major Australian E&P companies Woodside, Santos, Beach, and Oil Search. Within a close-ranked group, we think Woodside offers the most attractive combination of price/fair value estimate discount, balance sheet strength, and sustainably low-cost operations.
Key Takeaways
– COVID-19 has sparked an unprecedented collapse in global crude consumption. We expect a year-on-year demand decline of around 8% or 8 million barrels per day. That’s marginally better than prior expectations as a result of earlier than expected recoveries in parts of the world.
– But demand won’t recover more meaningfully until economic activity, including air travel, resumes. We expect demand recovery in the 2021-2022 timeframe; and if producers don’t resume normal activity levels by then, expect the current glut to quickly become a shortage.
– Significantly higher crude prices are necessary to incentivise the required activity, but the market is still extrapolating bottom-of-the-cycle crude prices indefinitely, making energy stocks cheap. Australian E&P companies remain generally well placed with healthy balance sheets and low free cash flow breakeven Brent crude price points in the vicinity of USD 20–USD 25 per barrel. All our coverage is in the 5-star zone but we think Woodside currently offers the best value at price/fair value estimate of 0.4.
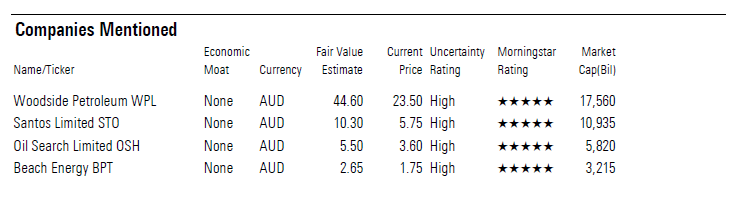
We See Crude Markets Normalising by 2022
The outbreak of COVID-19 sparked an unprecedented collapse in global crude consumption. We expect a year-on-year demand decline of around 8% or 8 million barrels per day, or mmbpd, eclipsing prior downturns. That’s better than the decrease of 10 mmbpd we were originally expecting, with the demand outlook brightening in recent months, as a result of the early recoveries underway in many parts of the world. And we think production cuts from OPEC+, and declining U.S. rig counts should ensure inventory-builds are manageable and relatively short-lived.
Demand should recover when economic activity recovers and air travel resumes, and we expect demand recovery in the 2021-2022 timeframe. If producers, especially OPEC and Russia, or OPEC+, and U.S. shale firms, have not resumed normal activity levels by then, we expect the current glut will quickly become a shortage. Significantly higher crude prices are necessary to incentivise the required activity, but the market is still extrapolating bottom-of-the-cycle crude prices indefinitely, making energy stocks cheap.
On the supply side, we think worldwide production will decline by about 5.7 mmbpd this year, from 100 mmbpd in 2019. As a counter to the consumption reduction, that still equates to a material average plus 2 mmbpd surplus going to inventory in 2020. OPEC+ kicked off production cuts in May, withholding 9.7 mmbpd initially (decreasing to 7.7 mmbpd in August, which is still a substantial curtailment by historical standards). Large integrated oil firms followed suit, reducing investment levels and postponing production growth where possible. We don’t expect extensions to OPEC+’s maximum cuts, and our base case assumes an incremental 4.0 mmbpd from OPEC starting next year, and another 1.0 mmbpd from Russia. But even under these circumstances, we still see a meaningful supply gap that the U.S. would most likely fill.
In the U.S., which is still the global swing producer, independent shale firms have dialled back capital spending to the bare minimum. The U.S. horizontal rig count has fallen 70% from its February 2020 peak, choking off U.S. oil growth. With crude prices languishing, U.S. companies are in no rush to get back into spending mode. This narrows what would otherwise have been an unmanageable surplus, though inventories are still expected to spike significantly above normal levels by year-end.
This drop in drilling activity could leave the market short next year and beyond, when we anticipate the demand outlook to brighten. We estimate the appropriate activity level for horizontal U.S. oil plays at around 600 rigs, or four times the current number. But without higher prices, shale producers have no incentive to reactivate rigs and shift back into growth mode. That’s the basis for our USD 60 per barrel Brent midcycle forecast, which we think is the goldilocks level that incentivises U.S. producers to deliver the necessary growth, without allowing overheating to kickstart another cycle of oversupply.
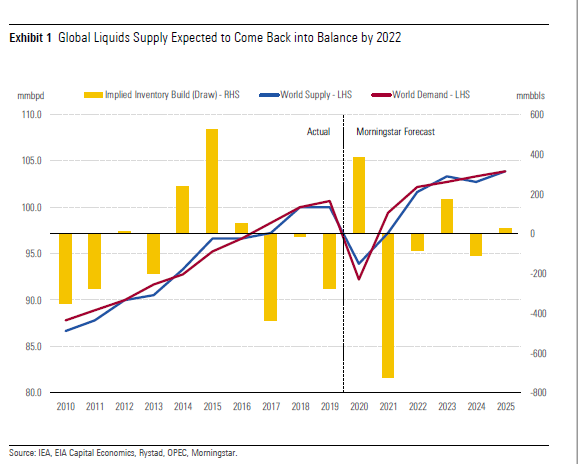
Our midcycle Brent crude price forecast is unchanged at USD 60 per barrel from mid-2022, well ahead of current circa USD 40 per barrel levels. We employ the futures curve for price guidance until that mid-2022 point. Our midcycle LNG price forecast remains USD 8.40/mmBtu, at the 14% contract slope to Brent crude price forecast, but importantly also the level we see as fundamentally necessary to incentivise the LNG investment needed in order for supply to meet growing demand. The tighter market and the need to cover long-run marginal costs and generate acceptable 10% full- cycle returns on new investment should push prices toward $8.50/mmBtu globally to earn adequate returns.
A dramatic divergence between spot LNG and the oil-referenced contract, which opened approximately 18 months ago, closed in August though at very low sub-USD 3.0/mmBtu price levels courtesy of oil’s collapse. The implied contract price has since recovered to near USD 6.0/mmBtu and it will be interesting to see if spot prices now follow or continue to wallow. This is of particular nearer-term importance for Woodside, which has a lesser proportion of its LNG sold under contract, around 75% versus 90% plus for peers Santos and Oil Search. But it is important for all players longer-term, as higher spot pricing will be necessary for expansion projects to achieve final investment decisions which we largely expect by 2022.
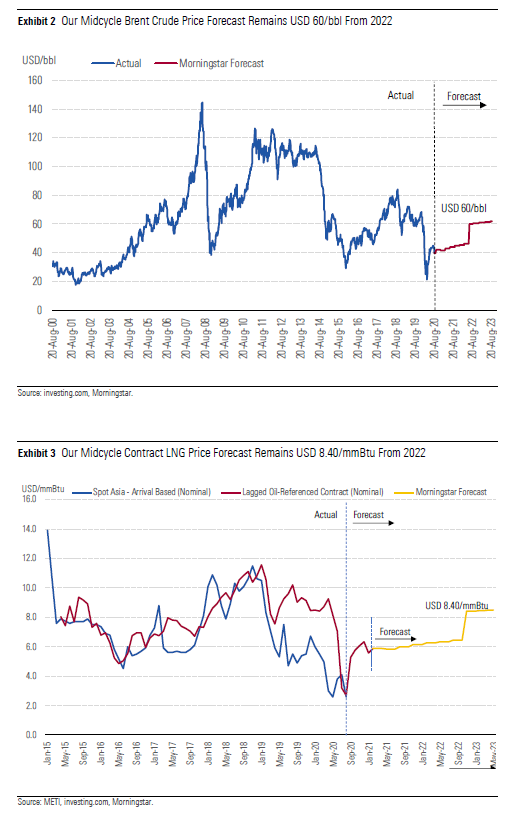
Woodside our Preferred Pick in Australian Upstream Energy Space, Though all Are Currently Attractively Priced
Woodside is our preferred pick with the steepest share price discount to fair value at 60%, and a 5-star rating. But it’s a marginal lead with Santos, Oil Search and Beach also all attractively priced with share price discounts approaching 50%, and with 5-star ratings. At the current share price, shareholders in Woodside get everything outside of Pluto for free, if Brent is to recover to our midcycle target.
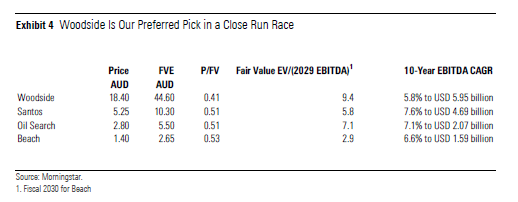
Woodside has the highest EV/EBITDA as we credit it the greatest number of years in our fair value perpetuity stage at 28, all long-life LNG with not much in the way of shorter life oil fields. We credit Santos a lower number of perpetuity years at 18, dragged down by shorter Dorado and Cooper Basin field lives despite long LNG life. Santos’ exit EBITDA is also high, boosted by Dorado’s strong but shorter-lived production and earnings. Oil Search has a higher assumed perpetuity life than Santos at 22 years, increasing its EV/EBITDA versus Santos, despite our application a PNG sovereign risk premium to the cost of equity which reduces the EV. We allow Beach only a low perpetuity stage life of three years crimping its EV.
In addition to being cheapest, Woodside offers the second-best balance sheet with 12% (net debt/net debt + equity), behind only Beach (in modest net cash), equal highest EBITDA margins with Santos near 80%, the lowest estimated free cash flow breakeven Brent crude price near USD 15 per barrel, and the highest forecast reserve/resource life at 35 years. Woodside also comes at the lowest enterprise value/proven and probable and contingent resources, or EV/(2P+2C) at AUD 4.40 per boe.
Santos is our next preference behind Woodside. Despite sharing an equal P/FV of 0.51 with Oil Search, Santos’ less leveraged balance sheet pushes it up our preference list. Santos sits on 32% (ND/DN+E) to Oil Search’s 39%. Santos also has higher forecast EBITDA margins, a lower forecast free cash flow breakeven, or FCFBE, at a Brent crude price near USD 20.50 per barrel versus Oil Search’s USD 23.50, and a lower enterprise EV/(2P+2C) of AUD 4.50 per boe to Oil Search’s AUD 5.30 per boe. Oil Search does have longer forecast reserve/resource life of 32 years, but Santos’ 28 years is not to be sneezed at. Oil Search also has higher-valued liquids versus Santos’ greater exposure to lower-priced domestic gas.
Beach is the lowest ranked in our opinion, but only by a whisker, at P/FV of 0.53. Beach has the best balance sheet with modest net cash, and a lower forecast FCFBE than Santos and Oil Search at USD 19.50 per barrel. But Beach has a far lower forecast reserve/resource life of just 13 years, and the highest EV/(2P+2C) at 5.80 per boe. Beach also has lower forecast EBITDA margins near 75%, close to Oil Search.
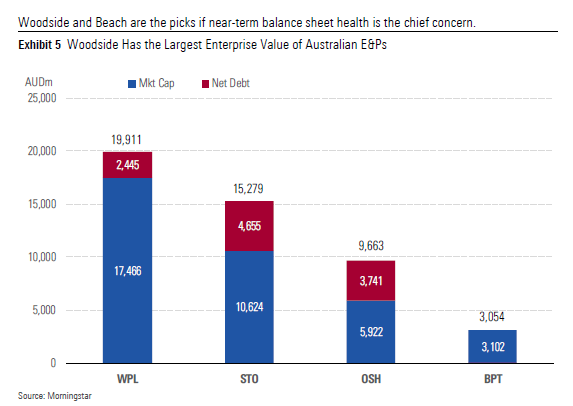
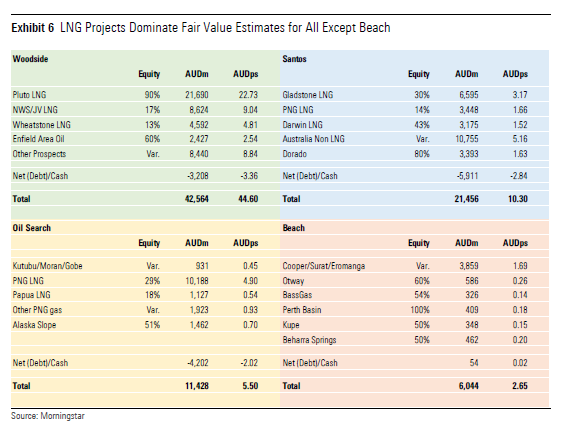
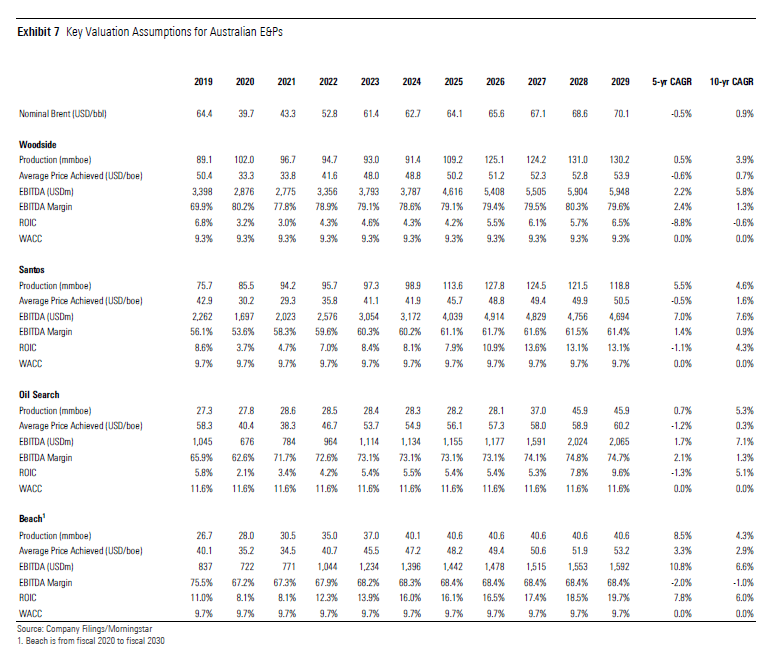
Our Woodside fair value estimate equates to a 2029 EV/EBITDA multiple of 9.4, a P/E of 24, and dividend yield of 3.4%. We exclude a USD 5.5 billion lump sum for other prospects including Kitimat (Canada), Greater Sunrise (Timor), Senegal, and Myanmar. The multiples are relatively high because a larger share of fair value resides in the perpetuity stage of the earnings stream than for the other companies. We assume a 46% increase in production to 130mmboe by 2028, chiefly including construction of a second Pluto LNG train. That would entail net debt/EBITDA rising to a peak of 2.2 by 2024, from current 0.6 levels.
Our Santos fair value estimate equates to a 2029 EV/EBITDA multiple of 5.8, a P/E of 15, and dividend yield of 2.0%. We assume a 65% increase in production to 125mmboe plus by 2026, including production creep at Gladstone LNG, growth in Darwin LNG on increased Barossa feed, and commissioning of Dorado oil offshore WA. Net debt/EBITDA is regardless not expected to rise, rather fall from current 1.65 levels, as capital intensity associated with production growth is expected to be low, particularly for Dorado oil.
Our Oil Search fair value estimate equates to a 2029 EV/EBITDA multiple of 7.1, a P/E of 17, and dividend yield of 3.0%. We exclude a USD 2.2 billion lump sum for other prospects including Alaska Slope and other non-project-dedicated PNG gas. We assume a 65% increase in production to 45mmboe-plus by 2028, comprising construction of a third PNG LNG train and two new Papua LNG trains. We expect net debt/EBITDA to decline from circa 3.3 levels to around 1.2 by 2024 before growth to a lesser peak of 2.0 in 2026 on the back of LNG expansions yet to reach FID.
Our Beach fair value estimate equates to a 2029 EV/EBITDA multiple of 2.9, a P/E of 12 and dividend yield of 1.0%. We exclude USD 300 million lump sum for other prospects including Beharra Springs Deep. The multiples are relatively low because a smaller share of fair value resides in the perpetuity stage of the earnings stream than for the other companies. This may prove conservative if Beach can materially extend effective life beyond existing reserves and resources. We assume a 50% increase in production to just over 40mmboe by fiscal 2025, including expansion of Waitsia gas field and improvement in facilities utilisation rates more generally. Later expansion of Otway and Cooper Basin output is also on the cards. We don’t anticipate the growth to reverse Beach’s current favourable net cash position.
We See No Justification for Moats in the Australian Energy Space
Capital intensity is crucial in determining all important returns on invested capital, or ROIC. Taking this side of the equation into consideration, we think Beach and Santos top the class with midcycle ROICs forecast to exceed the weighted average cost of capital, or WACC, if only by low-single digits in the case of Santos. But we don’t ascribe an economic moat to any of the four companies covered. Beach and Santos dramatically improved their returns by well-timed transformative acquisitions. Beach bought Lattice Energy for USD 1.25 billion in 2017 and Santos bought Quadrant Energy for USD 2.15 billion in 2018. But the inspired buys had a lot of ground to make up for including Santos building Gladstone LNG expensively at the height of China resources boom capital intensity. Beach hadn’t necessarily invested at the top of the cycle, but the maintenance capital intensity of its model had been high.
Beach has the highest ROICs, considerably in excess of WACC, but we don’t view resource life of around 13 years as sufficient to underpin award of a moat. And while Santos’ ROICs are expected to creditably exceed WACC from 2026, we think the quantum insufficient to account for potential downside risk in a reasonable bear case to award a moat.
For Woodside and Oil Search we expect returns to rise, but to still fall short of WACC by low-single digits–indicative of a lack of a moat. Woodside’s initial Pluto footprint was built at the height of the China boom. And despite lower capital intensity for future expansion, it will be hard to recover the boom-time costs of Pluto’s initial construction. Similarly for Oil Search, PNG LNG was built during the boom and went materially over budget. There is a lot of ground to recover. If one was to unwisely remove the 3% country risk premium we apply to Oil Search for PNG sovereign risk, we expect returns would get close to meeting WACC in the long-run. But we’ve no intention of removing the risk premium.
Australian E&P Companies Remain Generally Well Placed From a Balance Sheet Perspective, Barring Oil Search
Australian E&P companies remain generally well placed from a balance sheet perspective. The outlier remains Oil Search with leverage ND/(ND+E) of 39% at June 30, 2020, and a high forecast net debt/EBITDA of 3.3 for 2020. That position could have been worse if not for a USD 700 million equity raising in April 2020. We continue to view Oil Search as the higher risk play of the group due to its debt levels, compounded by PNG sovereign risk. The best placed company remains Beach, in a favourable modest net cash position of USD 35 million. This lack of leverage and the fact that near-term group operating costs overall are covered by contracted domestic gas sales alone places Beach in an extremely strong position to sail through current crude price weakness.
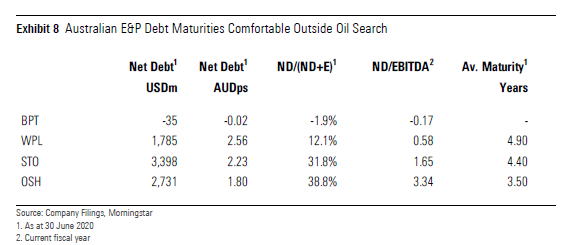
The next best positioned company is Woodside, with modest leverage of just 12%, followed by Santos with moderate leverage of 32%. Santos’ leverage may not appear that much lower than for Oil Search, but there is a key difference. Oil Search took on debt in part to fund as-yet non-productive resources. This means it is in a less robust cash flow position to support that debt, all else equal. This ignores that Oil Search could potentially sell-down interests in some assets if push came to shove. But the last time push came to that, it chose to raise equity, diluting fair value for shareholders in preference to a fire-sale of world class assets—probably the right decision in our view. Oil Search also has a less favourable average debt maturity profile of just 3.5 years.
Santos’ maintenance of strong net operating cash flow is reassuring given it is carrying comparatively more debt than Woodside. Also, Santos’ debt covenants have adequate headroom and are not under threat at current oil prices. The weighted average term to maturity is around 4.4 years and will improve when the interim ConocoPhillips acquisition facility of USD 750 million due in 2022 is refinanced with greater than five-year debt. Domestic gas contracts and oil hedges mean Santos’ operating cash flows will stay positive for the near term regardless of the spot crude price. Woodside has the most favourable average debt maturity profile approaching five years.
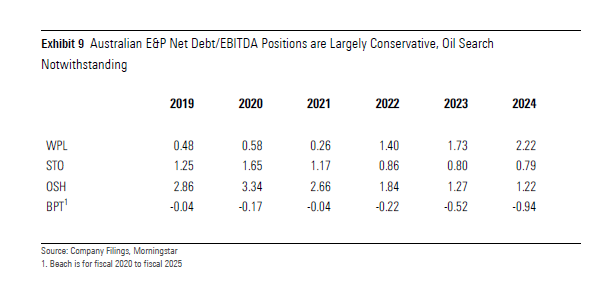
While Woodside has low net debt/EBITDA now, we project the metric deteriorating to a 2.2 peak in 2024 before improvement to near 1.0 by 2030. But the driver is expansionary expenditure on the Scarborough/Pluto T2 project, and later on the Browse project. We model the most substantial Scarborough/Pluto T2 expenditure beginning in 2022 for first production in 2025. We model Woodside’s share of the combined capital cost at circa USD 14.0 billion, relatively the most capital-onerous of all four E&P companies, but driving a 46% increase in equity production to 130 mmboe, by 2028, and these are long-life additions.
The company with the next highest forecast capital expenditure is Santos at USD 4.0 billion, beginning 2022 on the Dorado oil project and the Barossa to Darwin LNG upgrade. But this is excellent near-term bang-for-buck expenditure, increasing group production by 65% to 125mmboe by 2026. Capital efficient development and fast up-front cash flows from Dorado’s oil combine to ensure Santos’ leverage ratios continue to decline from current levels despite outgoings. We project sub-1.0 net debt/EBITDA by as soon as 2022, and continuing to fall thereafter.
For Oil Search, we project USD 2.2 billion in combined equity expenditure from 2024 for the PNG LNG and Papua LNG expansion projects. We time this expenditure later than for Woodside and Santos in consideration of Oil Search’s already high debt levels, and uncertainty around timing of project agreements with the PNG Government. We assume group production increases 65% to 45mmboe plus, but not till 2028. Capital intensity is comparatively light, we assume less than USD 1,500 per capacity tonne, piggy-backing off the existing LNG infrastructure footprint. Despite this, we don’t project already high net debt/EBITDA falling below 1.0 until 2028.
We project Beach net debt/EBITDA to remain below zero, with limited and non-intensive expenditure required to drive an assumed 50% increase in production to just over 40mmboe by fiscal 2025. This includes expansion in the Cooper Basin and Waitsia Stage 2 expansion in Western Australia. Beach has planned capital expenditure of USD 485 million to USD 560 million over the next five years, driving a company production target of 37-43mmboe by fiscal 2025. The trade-off is comparatively low assumed field life and ongoing expenditure requirement, in contrast to Woodside’s up-front capital-intensive but long-life-affording expansions for example. Each circumstance has its own merits.
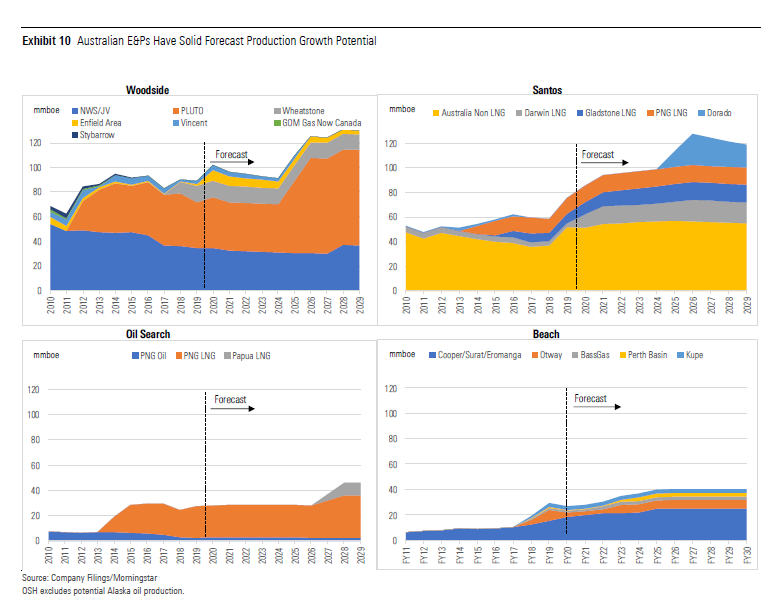
Australian E&Ps Have Robust EBITDA Margins
Excluding third-party hydrocarbon through-sales, we determine Woodside and Santos have the highest sustainable EBITDA margins, approaching 80% on a COVID-19 normalised basis (and excluding third-party sales for Santos). This means their cash flows are supported in more robust fashion in a weaker oil price environment. The flip side is that earnings and share price leverage to improving commodity prices are not as material as for lower margin producers. The share prices of Beach and Oil Search stand to gain most in an improving price environment. This is particularly so for Oil Search given its higher debt levels.
Santos’ margins improved with ramp-up of Gladstone LNG from late 2014, the synergy-rich acquisition of Quadrant Energy in 2018, and relentless cost improvement under CEO Kevin Gallagher’s watch. Near-term, Santos’ margins have been more COVID-19-impacted than Woodside’s given Santos’ greater footprint of onshore operations and therefore logistical complexity.
Oil Search EBITDA margins have fallen short of 70% for a number of years with added difficulty in operating in PNG adding to costs. Earthquakes and most recently COVID-19 have seen margins drop below 65%. We anticipate recovery to plus 70% EBITDA margins from 2021, but not to the 80% levels of Woodside and Santos.
Beach has undergone dramatic margin improvement, including via acquisition of Lattice Energy from Origin in late 2017. The average EBITDA margin in fiscal 2020 was in excess of 75% versus sub-60% levels prior to fiscal 2017. However, we anticipate some pull-back to nearer 70% levels. We think fiscal 2020’s margins were flattered by a circumstance of still high domestic gas prices in conjunction with cost retreat in sympathy with lower crude prices.
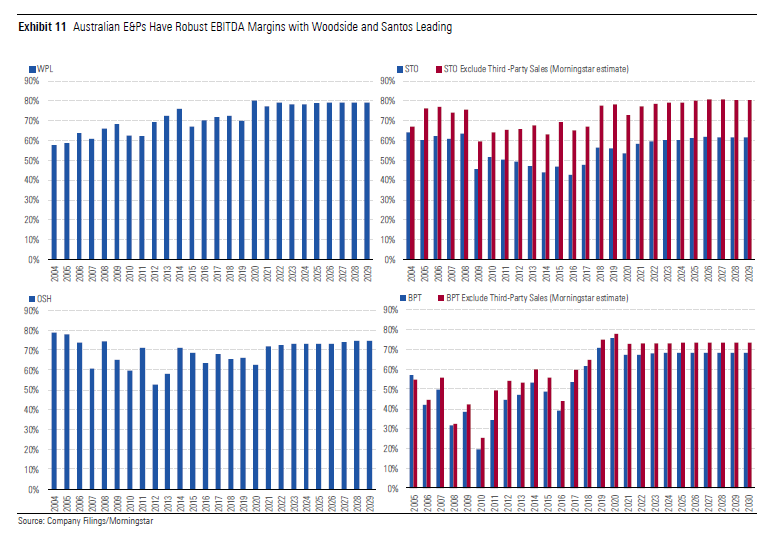
Australian E&Ps Have Low Free Cash Flow Breakeven Brent Crude Price
We think Woodside has the lowest representative free cash flow breakeven Brent crude price at around USD 15/bbl. At its full year results in February 2020, the company reported 2019 breakeven at USD 22/bbl, down from USD 30 in 2018. However, this included investing activities other than acquisitions. Our forecast of USD 15/bbl free cash flow breakeven in 2021 for Woodside in Exhibit 12, includes our estimate of sustaining capital expenditure only.
At its August 2020 half-year result, Santos stated it was targeting a free cash flow breakeven oil price of less than USD 25/bbl in 2020. But unlike Woodside, the measure excludes major growth capital expenditure. We forecast just over USD 20/bbl free cash flow breakeven in 2021 for Santos with consistent application of the disciplined operating model to continue to deliver cost reductions and efficiencies.
Oil Search says its 2020 free cash flow breakeven oil price target is USD 15.60/boe, excluding all expansion and discretionary expenditure. But this is an average price of all hydrocarbons sold and shouldn’t be confused with the breakeven Brent price, which we estimate is higher at around USD 23.50/bbl.
In 2020 free cash flow breakevens for all companies benefit from higher oil prices prevailing in 2019 feeding into high first-quarter 2020 LNG prices, lowering the Brent price required for the rest of the year.
Beach hasn’t stated a free cash flow breakeven target but says nearly all its gas is sold under contract and gas revenues cover all operating costs and stay in business costs. This effectively means the Brent crude free cash flow breakeven is less than zero in the near-term. But breakeven levels will rise over time if Brent prices remain low. New contracts will reflect lower oil prices, and we estimate representative group free cash flow breakeven Brent price at USD 19.50 per barrel.
Oil Search generates the highest average prices across its commodity portfolio, chiefly a function of it having the lowest proportion of domestic gas sales at just 3% of total. It also achieves a high average LNG price. This has more than offset by slightly lower average liquids price achievement than counterparts. Despite the highest average prices received, the cost of operating in PNG, and in the PNG Highlands in particular, is high and Oil Search’s gross margin in fourth-quarter 2019 was the lowest at 66%.
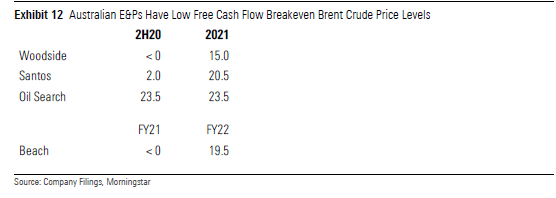
Australian E&Ps Have Long Reserve and Resource Lives
We determine Woodside has the lowest enterprise value to combined proven and probable and contingent resources, or EV/(2P+2C), at AUD 4.40 per boe. We exclude Kitimat’s 2,635 mmboe in shale gas resources, which if included would enhance the metric to AUD 2.75 per boe—we non-controversially view Kitimat’s chances of development in the medium term as remote. Woodside’s 4,455mmboe in reserves and resources, excluding Kitimat, afford it healthy 45 year life based on 2020 production levels, or 35 years based on forecast expanded 2028 production levels. Forecast production life is higher than for any of the other companies, though reliant on the ability to develop the Scarborough and Browse gas field resources to feed the Pluto and NWS/JV LNG plants.
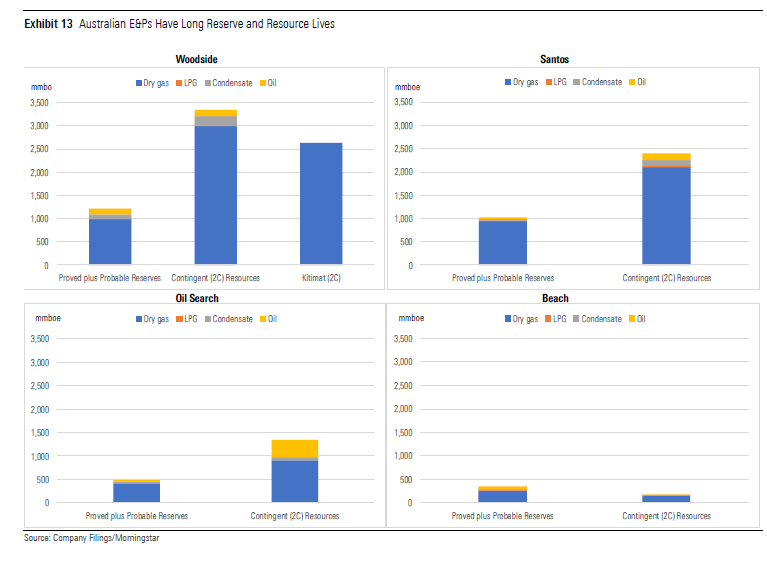
Santos has the next lowest EV/(2P+2C), at AUD 4.50 per boe. The company’s 3,425mmboe in reserves and resources, furnish it with healthy 40-year life based on 2020 production levels, or 28 years based on forecast expanded 2028 production levels. Forecast production life is the third-highest of the companies, though requiring development of the Barossa resource to feed the Darwin LNG plant.
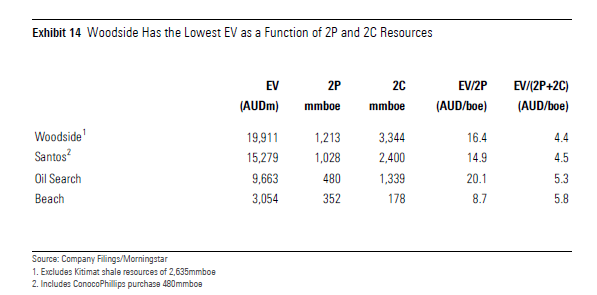
Oil Search has the third-highest EV/(2P+2C), at AUD 5.30 per boe, considerably above Woodside and Santos. But its 1,820mmboe in reserves and resources equates to the highest life of any of the companies based on current production levels at 52 years, and second-highest life based on forecast production levels at 32 years, behind Woodside. This assumes development of the P’nyang resources and other to feed PNG and Papua LNG projects. Oil Search’s enterprise value is high for the privilege of that long life.
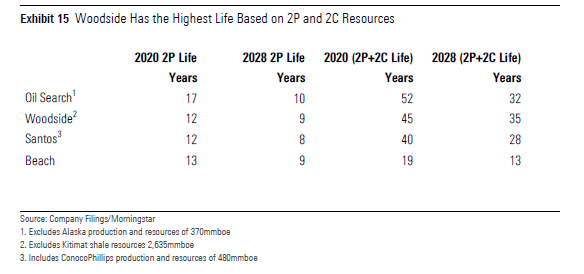
Beach has the highest EV/(2P+2C) at AUD 5.80 per boe, but the lowest EV/2P at just AUD 8.70 perb boe. This feeds into our prior comments around short field life for Beach versus peers. Beach’s 530mmboe in reserves and resources equates to the lowest life of any of the companies at 19 years based on current production levels and 13 years on forecast production levels.
Growing Choice for Australians who Want to Invest Sustainably
The coronavirus has dominated both news headlines and investors’ minds in 2020. But hidden amidst the news headlines is that investment options and assets in sustainable funds in the Australian retail marketplace continue to grow, with promising signs of performance during the volatility caused by the pandemic. This paper highlights recent trends within sustainable retail investments in Australia, inclusive of a summary of Morningstar’s updated framework for identifying sustainable funds.
Key Takeaways
– In July 2020, Morningstar updated our intentionality framework for identifying sustainable investments in Australia. In total, Morningstar has identified 108 Australasia-domiciled (Australia and New Zealand) sustainable investments through our intentionality framework.
– Seventy percent of sustainable funds placed in the top half of their respective Morningstar Category peer groups during the volatile first half of 2020, providing an observation that investing sustainably does not necessarily come at the expense of returns.
– Although still a fraction of the total market, sustainable fund launches have increased materially over the past three years. Ten additional sustainable investments have been launched year to date (end of August) in 2020.
– At the end of the second quarter of 2020, Morningstar estimates that retail assets invested in sustainable investments were AUD 19.9 billion, a 21% increase compared with 30 June 2019. Following the volatility in the first quarter, estimated net flows to sustainable funds were muted in the second quarter but still positive at AUD 335 million.
– Australians have a growing number of choices for funds that use environmental, social, and governance incorporation approaches, but there are limited options when it comes to environmental sector funds. In a similar way, Australians have a vast choice among funds that explicitly exclude exposure to controversial weapons and tobacco but have limited choice in funds that exclude animal testing, fur/leather, palm oil, or pesticides.
– Morningstar has identified 87 Australasia-domiciled sustainable funds that employ some form of exclusion from investment in controversial areas, with a high number of funds excluding tobacco (85) and controversial weapons ((81) companies that derive a significant portion of revenue from nuclear weapons, land mines, cluster munitions, and so on).
– Gambling, adult entertainment, and thermal coal are the next largest group of exclusions. Interestingly, in this time of climate awareness, more funds exclude thermal coal than exposure to the nuclear power sector.
– There are a small but increasing number of choices for funds that invest in an environmental sector theme. Renewable energy and water-focused funds are the most prevalent.
– If Australian investors want to avoid exposure to fossil fuels, for example, they need better regulated portfolio holdings data (what stocks a fund holds) to provide the transparency they deserve.
Product Launches
Compared with Europe and the U.S., the sustainable fund market is still relatively small in Australia. Through Morningstar’s sustainable attribute framework we have identified 10 additional funds that have been launched in the year to 31 August, bringing the total number of individual sustainable strategies available to Australasian retail investors to 108.
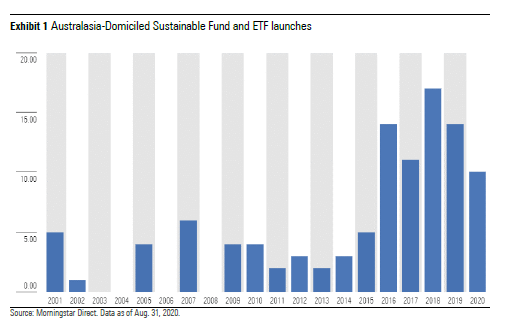
This said, the momentum of sustainable fund launches has lifted significantly since 2015. Given that there were 14 sustainable funds launched in 2019, it would not be surprising to see the number of fund launches surpass that total over the remaining three months of 2020.
Asset Flows
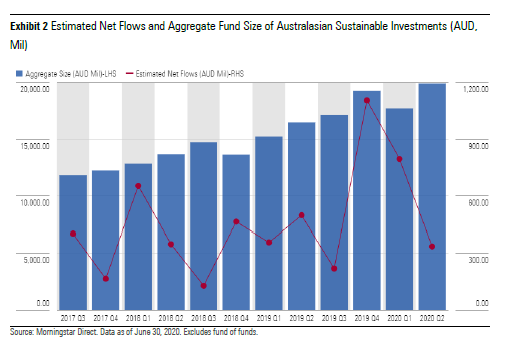
At the end of the first half of 2020, assets invested in Australasia-domiciled sustainable investments was AUD 19.9 billion (excluding investments in fund of funds), an increase of 21% compared with 30 June 2019. Second-quarter estimated net flows were lower than the first quarter but still positive at AUD 335 million. Given the volatility of global markets during the COVID-19 pandemic and observed net outflows in the broader market, it seems that investors are committed to sustainable approaches.
Product Availability
Earlier in 2020, Morningstar unveiled a framework for identifying sustainable investments to help investors understand the various approaches employed by fund managers. As a reminder, the framework is outlined in the following exhibit.
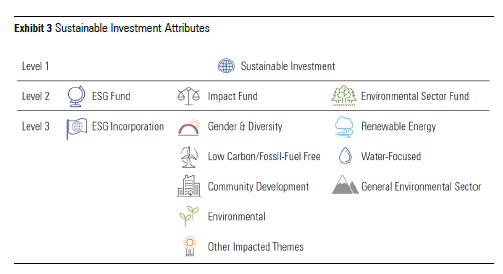
The framework is not meant to measure magnitude or effectiveness but rather to identify scope. Morningstar defines a strategy as a “Sustainable Investment” if it is described as focusing on sustainability; impact; or environmental, social, and governance, or ESG; factors in its prospectus or other regulatory filings. It is a requirement that the theme is a central part of the investment process and not merely “considered.” The framework is not mutually exclusive. It’s important to note that there are several investments that incorporate multiple attributes while some attributes are independent from their overall label.
At the next level of granularity, “Sustainable Investment” funds are categorized into three distinct groupings. The above exhibit provides a breakdown of the three groupings, or Level 2, attributes. ESG funds are sustainable strategies that incorporate ESG criteria throughout the investment process. Impact funds are strategies that seek to make a measurable impact alongside financial return on specific issue areas through their investments. Impact funds are often focused on specific themes or use the 17 U.N. Sustainable Development Goals as a framework for evaluating the overall impact of the portfolio. They will seek to have a measurable impact along with financial returns around such topics as gender and diversity, low carbon/fossil fuel, community development, and other themes. Environmental sector funds are those that invest specifically in the green economy by investing in companies that will contribute to this cause, such as renewable energy, green transportation, environmental services, and climate resilience.
The following exhibit outlines the number and types of products available to Australasian retail investors, classified through the lens of our intentionality identification framework.
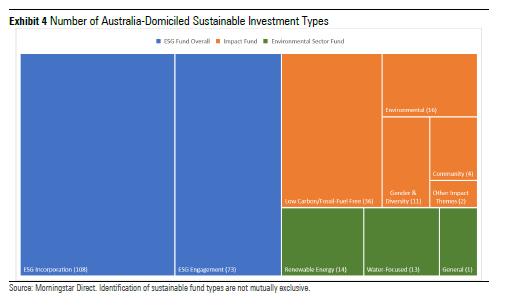
By and large, Australians have the most choice when investing in funds that utilize ESG incorporation techniques, but there are fewer choices in terms of funds that invest in an impact manner or when it comes to environmental sector funds.
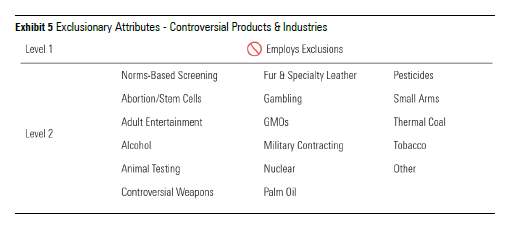
Exclusionary Screening by Controversial Area
Simultaneous to the release of the intentionality framework for identifying sustainable investments, Morningstar also began to identify funds that explicitly state exclusions from controversial investment areas, a process that is similar but distinct from our identification of sustainable investments. A fund does not need to mention explicit exclusions to be deemed sustainable, and vice versa. Morningstar looks to regulatory filings to identify funds that use exclusions.
Note that “norms-based screening” refers to the citation of international agreements typically involving human rights, child labor, or exposure to conflict zones (for example, the U.N. Global Compact and Universal Declaration of Human Rights).
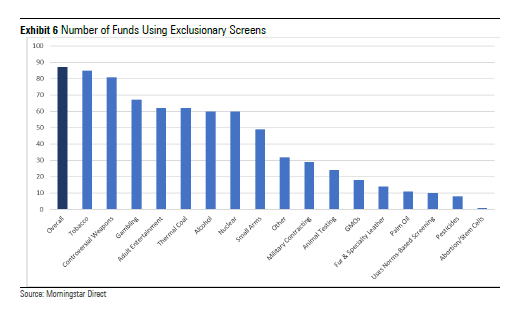
On this basis, Morningstar has identified 87 Australasia-domiciled funds that employ some form of exclusion from investment in controversial areas, with a high number of funds excluding tobacco (85) and controversial weapons ((81) companies that derive a significant portion of revenue from nuclear weapons, land mines, cluster munitions, and so on).
Gambling, adult entertainment, and thermal coal are the next largest group of exclusions. Interestingly, in this time of climate awareness, more funds exclude thermal coal than exposure to the nuclear power sector. Australians have limited choice in funds that exclude animal testing, fur/leather, palm oil, or pesticides.
Morningstar Sustainability Rating™
Independent from the above taxonomy is the Morningstar Sustainability Rating™ (also known as the Globe Rating), which is intended as a measure of portfolio ESG risk relative to global category peers. Using individual company data from global ESG research leader (and Morningstar subsidiary) Sustainalytics, Morningstar rates the degree of ESG risk found within a fund by looking to the fund’s holdings over the trailing 12 months and rolling up individual holdings’ ESG risk ratings with emphasis placed on more recent holdings information. The Sustainalytics ESG Risk Rating measures the degree to which a company’s economic value may be at risk driven by ESG issues. In order for a fund to receive a Morningstar Sustainability Rating, there must be ESG risk scores on at least two thirds (66.7%) of holdings. An investment does not have to be deemed sustainable under the identification framework for Morningstar to provide a Sustainability Rating.
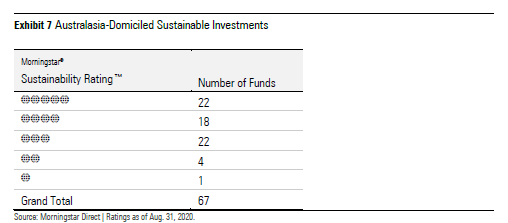
Though Morningstar’s identification of sustainable investments is separate from the assessment of ESG risk, the above exhibit shows that the majority (60%) of funds identified as sustainable investments in Australasia also tend to have lower levels of ESG risk, and hence higher globe ratings.
Performance of Sustainable Investments
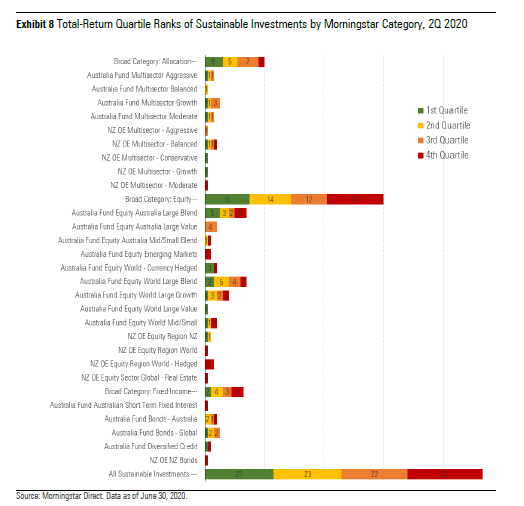
While markets recovered from the initial shock of the COVID-19 pandemic in the second quarter of 2020, one less than half (46 of 93) of sustainable investments outperformed their peers within their respective categories.
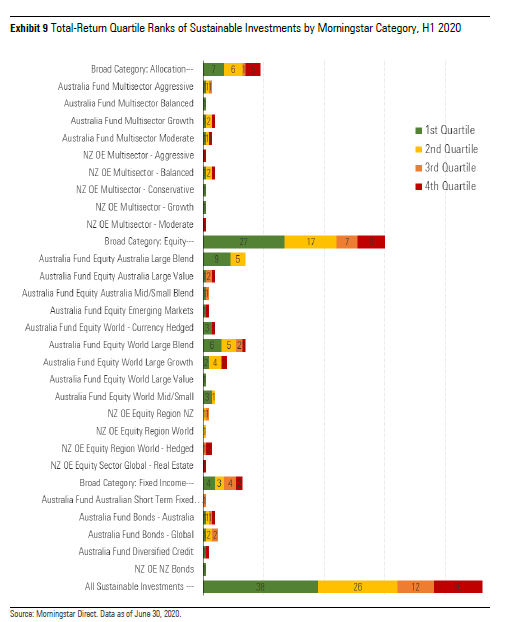
But looking back at the full first half of the year (and including only sustainable investments that had as much history), 70% of funds placed in the top half of their respective peer groups. This ratio was particularly clear within equity funds, which represent the majority of sustainable investments. This outperformance can intuitively be explained to the general underweight to the fossil-fuel sector that was hard-hit in the first half of 2020 given a plunging oil price.
The outperformance of Australian sustainable funds mirrored that of Canadian and U.S.-domiciled funds over the same period.
Performance by Scope
Framing performance in a different way, the exhibits below show the performance of funds through the lens of our intentionality framework (quartile ranks are based on Australasian Morningstar Categories).
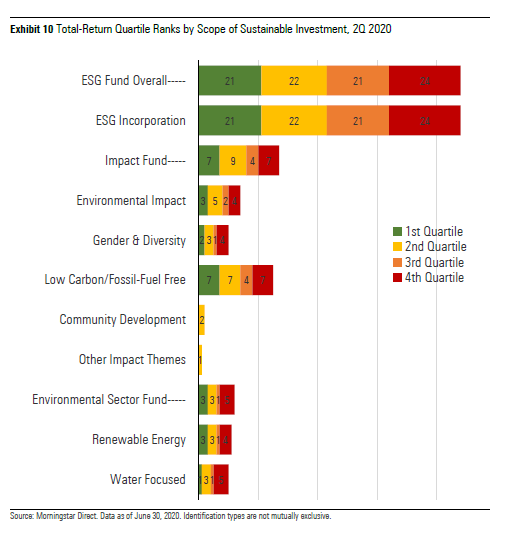
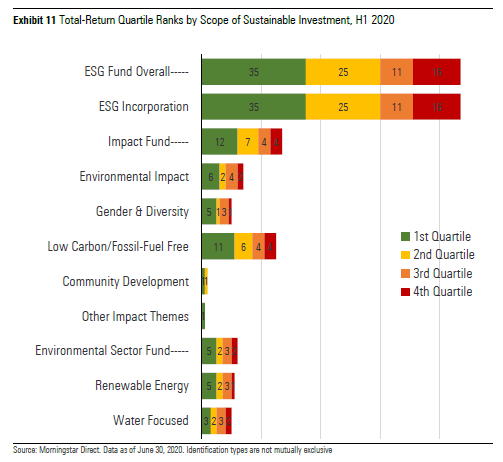
Notably, most low-carbon/fossil-fuel-free and impact funds placed in the top half of comparable peers (by Morningstar Category) on a year-to-date basis as of 30 June.
The Problem of Poor Portfolio Holdings Disclosure
Australian investors are entitled to know how their money is being invested. If investors want to avoid exposure to fossil fuels, for example, Australian investors need portfolio holdings data (what stocks a fund holds) to provide the transparency that investors deserve. Every two years Morningstar runs a Global Investor Experience study that benchmarks the performance of 26 global markets. On Portfolio Holdings Disclosure specifically, Australia is the last country in our 26-market study without any form of regulated disclosure. It’s disconcerting, for a country that aspires to be considered a financial center, to have the world’s worst practice in regard to portfolio holdings disclosure (for investment products).
While the Morningstar Sustainable Investment Attributes and Exclusions methodology provides a guiding framework for Australian investors, having easy access to the full portfolio holdings of the funds in which they invest is not an unreasonable expectation. There is an old saying that “sunlight is the best disinfectant” and Morningstar believes that applies to appropriate portfolio holdings disclosure as well as to fee and other disclosures.
Conclusion
The momentum of sustainable fund launches has lifted significantly since 2015. There is a new wave of investors around the world who have intertwined their personal views and beliefs with their investment decisions. Investors are becoming more conscious about ESG matters and are increasingly seeking investments that align with their personal values. COVID-19, severe weather conditions resulting from climate change, large corporations with inadequate operational controls that lead to controversial social activities, such as the destruction of the Juukan Caves, are some of the most recent events driving this phenomenon. Australian fund managers have been responding to this backdrop with the launch of a number of new sustainable strategies, aiming to appeal to sustainably focused investors.
Morningstar believes that more investors will embrace this mindset in the long term and will need to be equipped with robust ESG data and research. We will be updating this report on a regular basis to track developments in the Australian sustainable investment landscape.
A Morningstar stock screener reveals a cross-section of companies with competitive advantages that are trading at material discounts.
Takeover target Link Administration, funeral home operator InvoCare and Australian Pharmaceutical Industries head a list of stocks trading at discounts of up to 30 per cent and in most cases a competitive edge of a decade.
Eighteen companies under Morningstar coverage are trading at discounts of between 10 and 30 per cent, with mostly “medium” uncertainty ratings, a Morningstar Premium stock screener reveals.
More than half the names on the list have narrow moats, which implies a ten-year competitive advantage. Two names have wide moats—or 20-year competitive advantage: InvoCare and pallet maker Brambles.
Following is a snapshot of some of the companies mentioned. As always, we invite you to click on the links to get a fuller picture of Morningstar analysts’ take on the pros and cons of each.
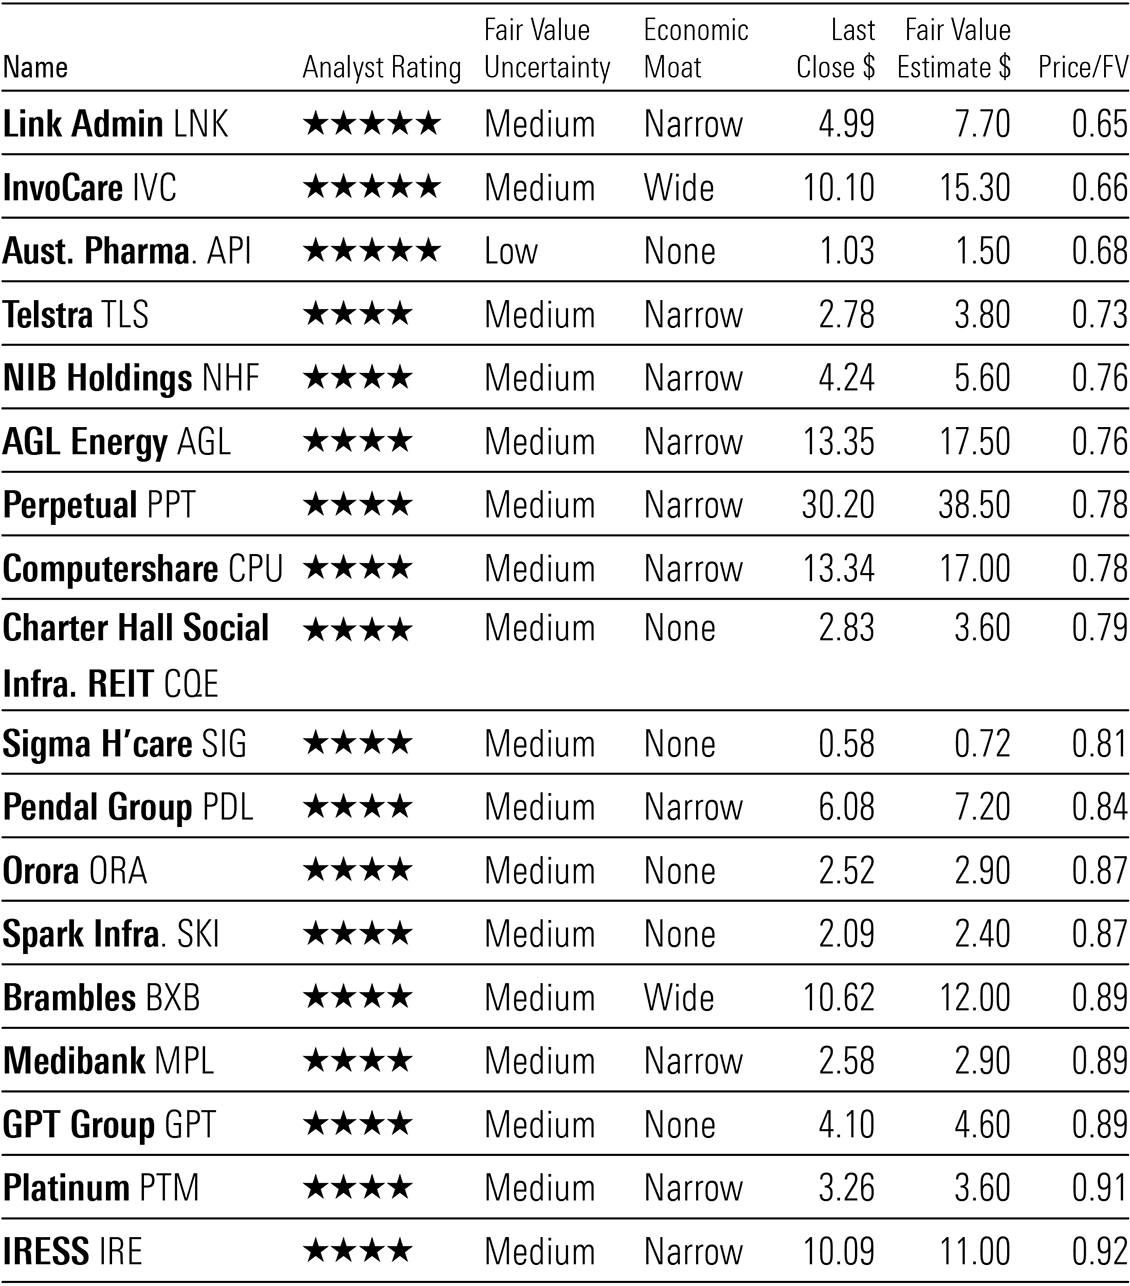
Source: Morningstar Premium. Data as at 3pm, 14 October 2020.
Most discounted
Link Administration is one of the three Technology names on the list. It has created a narrow economic moat in the Australian and UK financial services administration sectors via its leading positions in fund administration and share registry services. Client retention rates exceed 90 per cent in both markets.
Link surged 25 per cent last week on news that it had received a conditional, non-binding indicative proposal from a consortium comprising Pacific Equity Partners, Carlyle Group and their affiliates to acquire all of Link. Morningstar equity analyst Gareth James, who foresaw the takeover, says the $5.20 offer undervalues the company. “The offer is well below our $7.70 fair value estimate, meaning we’re unlikely to recommend shareholders accept,” James says. “Although the offer is at a 30 per cent premium to the last closing price before the offer was announced, the shares are still 13 per cent below where they were at the start of 2020.”
Wide moat InvoCare is the largest funeral, cemetery, and crematorium operator in Australia, New Zealand, and Singapore. InvoCare owns a portfolio of 60 brands, including three national Australian brands: White Lady, Simplicity Funerals, and Value Cremations. 2020 has been a challenging year for InvoCare. Social distancing and an increased focus on sanitation amid the covid-19 pandemic has led to a benign flu season and a lower death rate. However, Morningstar analyst Mark Taylor expects InvoCare to gradually increase its market share and sales to grow at a mid-single-digit pace for the next five years. “Over the longer term, we expect the ageing and growing population to boost case volumes,” says Taylor. ABS data suggests this is likely to accelerate after fiscal 2024, peaking at between 2 and 3 per cent by 2032. “In our opinion, InvoCare is well positioned to capitalise on this growth, given its dominant position in the domestic market and its wide economic moat,” Taylor says.
Australian Pharmaceutical Industries is the franchisor of the Priceline Pharmacy network and directly owns and operates stand-alone Priceline stores which sell personal care and beauty products. In an effort to diversify away from the highly regulated low growth and low margin pharma distribution business which contributes 75 per cent of revenue, API is growing a consumer brands portfolio and also recently acquired Clear Skincare, a skin treatment chain. API carries a low uncertainty as Morningstar expects no anticipate any regulatory changes in the Pharmaceutical Benefits Scheme or pharmacy ownership legislation.
Cross-section of sectors
Telstra, Australia’s leading telco provider,rose almost 4 per cent during the compilation of this survey, butitremains materially discounted, according to the valuation of Morningstar equity analyst Brian Han.The nbn’s $3.5 billion upgrade last month will affect Telstra and its rivals but it’s too early to quantify, Han says. Telstra gained 3.96 per cent to $2.89 on Monday after chair John Mullen told its annual general meeting the board wants to ensure investors’ payout is not cut. The board is prepared to waiver some rules to maintain the full-year 16 cents per share payout.
Telstra generates around 40 per cent of group operating earnings from the mobile telephony division. Its mobile subscriber base has ballooned from 12.2 million in fiscal 2011 (40 per cent market share) to 18.8 million in fiscal 2020 (44 per cent share). “The growth has been driven by the superior quality, speed and coverage of its mobile network,” Han says, “one that is capable of offering triple plays (mobile, data, audio-visual media), further enhancing its competitive positioning compared with peers.”
FINANCIAL SERVICES
Financial Services companies account for almost a third of the names on the list. And within that sector, three asset managers appear. In order of biggest discount to Morningstar fair value estimate, they are: Perpetual, Pendal Group and Platinum Asset Management.
Perpetual recorded a sluggish fiscal 2020, but Morningstar director of equity research Adam Fleck says investors should look past that as the future holds the prospect of stronger earnings growth. Key to this will be a couple of acquisitions it made this year: the 75 per cent acquisition of US asset manager Barrow Hanley will help ward off index funds, while the acquisition of Trillium boosts its ESG credentials. It’s also worth noting that Perpetual is the biggest shareholder in Link Administration.
Insurers NIB Holdings and Medibank Private round out the names within Financial Services.
TECHNOLOGY
Alongside Link Administration, two other narrow-moat-rated Technology sector names appear: Computershare and IRESS. Computershare has grown via global acquisition to become the world’s leading provider of share registry services, which constitutes about 60 per cent of earnings.
Morningstar’s James says cost-cutting measures will help Computershare increase its pre-tax earnings from 22 per cent in fiscal 2020 to 33 per cent by fiscal 2030.
“The capital-light business model should enable regular dividends, the elimination of net debt within the decade, and a return on invested capital that exceeds the weighted average cost of capital for the foreseeable future,” James says. “The recurring and defensive nature of earnings influences our medium fair value uncertainty rating.”
HEALTHCARE
In Healthcare, the other name alongside API is pharmaceutical distributor, wholesaler and pharmacy franchisor Sigma Healthcare. It is also the only name on the list that carries a Poor stewardship rating. The company has been slower than peers to diversify itself away from the low margin, low growth pharmaceutical distribution business, says Morningstar’s Han. On a brighter note, however, covid-19 has had little impact, highlighting the inelasticity of demand for health products. “The firm expects a recovering EBITDA to better fiscal 2019 levels by fiscal 2023 and we share similar optimism,” Han says. He retains his long-term estimates and forecasts a five-year EBITDA compound annual growth rate of 15 per cent.
REAL ESTATE
Two real estate investment trusts make the cut. One is Charter Hall Social Infrastructure REIT, which is trading at a 21 per cent discount to fair value. The other is GPT Group, which is Australia’s oldest listed property trust (1971). GPT remains dominated by retail malls that generate about a third of its revenue, and another quarter from office.
However, the group’s office portfolio is not as exposed to the immediate threat from the coronavirus, says Morningstar analyst Alex Prineas. “There has been very little new office supply in the Sydney or Melbourne central business district in the past five years so 2020 began with very tight supply, which we anticipate will loosen.”
UTILITIES
Among the Utilities sector, two names feature: AGL Energy and Spark Infrastructure Group.
Morningstar equity analyst Adrian Atkins recently trimmed his valuation for AGL on lower expected wholesale electricity prices. However, he still considers the low-cost energy producer and retailer to be attractively priced with a solid balance sheet and dividend potential.
“Based on the current share price, we forecast an average dividend yield of 5.5 per cent over the next five years,” Atkins says, “with solid longer-term dividend growth as earnings recover. Dividends should be mostly franked except for during the next two years as historical tax losses reduce tax payments.”
Spark Infrastructure owns 49 per cent interests in three electricity distribution companies: Powercor, servicing western suburbs of Melbourne; CitiPower, servicing Melbourne’s inner suburbs and central business district; and SA Power Networks, servicing South Australia. Powercor and CitiPower are collectively known as Victoria Power Networks. It also owns 15 per cent of TransGrid, the main electricity transmission network in NSW. Atkins says that while Spark pays healthy distributions it is heavily regulated and faces a tough outlook as the Australian Energy Regulator seeks ways to reduce utility bills.
As Election Day nears and the coronavirus vaccine trials continue, headlines may lead to volatility, but we expect economic rebound to keep on.
Immediately following the announcement on Oct. 1 that President Trump tested positive for COVID-19, the equity market futures tanked, falling as much as 1.7% before the stock exchanges opened.
When markets opened, the losses were quickly cut in half and, by the end of the day, the Morningstar US Market Index had registered a loss of only 0.87%.
The headlines may have been shocking, but the announcement doesn’t change our view of the long-term value of stocks. While there is still uncertainty as to how the disease may affect the president, that doesn’t impact our outlook for the continuing economic recovery or forecasts for individual companies we cover. And even in the most extreme scenario, power would shift to the vice president per the 25th Amendment.
Takeaways
- The timing of a vaccine approval is the biggest unknown in the short term that has the most significant consequences on the markets.
- We don’t think that the outcome of the presidential election will significantly alter our valuations or meaningfully change our economic outlook, but we acknowledge that a contested result and drawn-out ballot counting or litigation would intensify short-term volatility.
- While the consensus from market forecasters on Wall Street is that the market will be especially volatile come this November, it could also be relatively mundane.
We think the equity market is currently fairly to very slightly overvalued from a broad market perspective. However, we see pockets of undervaluation. Across our North American coverage, we rate 36% with Morningstar Ratings of 4 or 5 stars. Breaking down the coverage by Morningstar Style Box reveals that the greatest number of undervalued stocks reside in the mid-cap category and that the highest percentage of 4- or 5-star stocks are found in the small-cap space.
While the broad market index has risen 9.24% in the third quarter and 5.84% for the year to date, those gains have largely been driven by large-cap growth stocks.
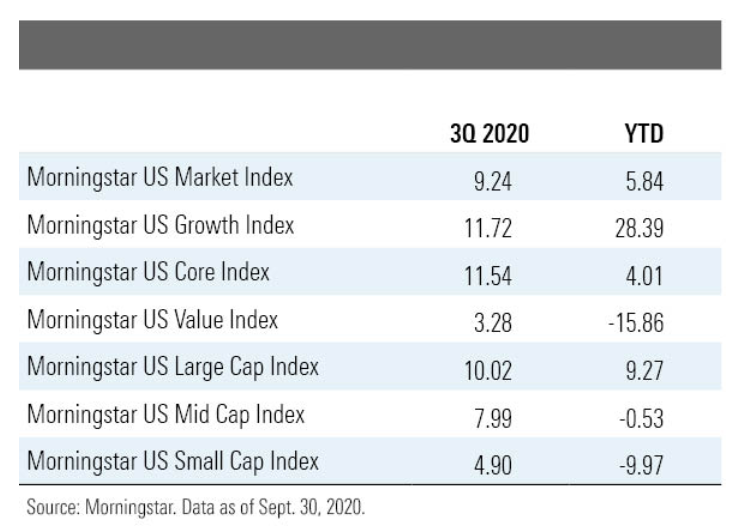
As the economy continues to recover, for long-term investors, we expect that stock prices in the value category will catch up to growth stocks over time. Currently, half of the stocks that we cover that fall into the value category are rated 4 or 5 stars; whereas, only 12% of the growth stocks and 30% of the core category (core has attributes of both value and growth) are rated 4 or 5 stars. In addition, we expect that mid-cap and small-cap stocks, which have lagged the broad market rebound, will outperform.
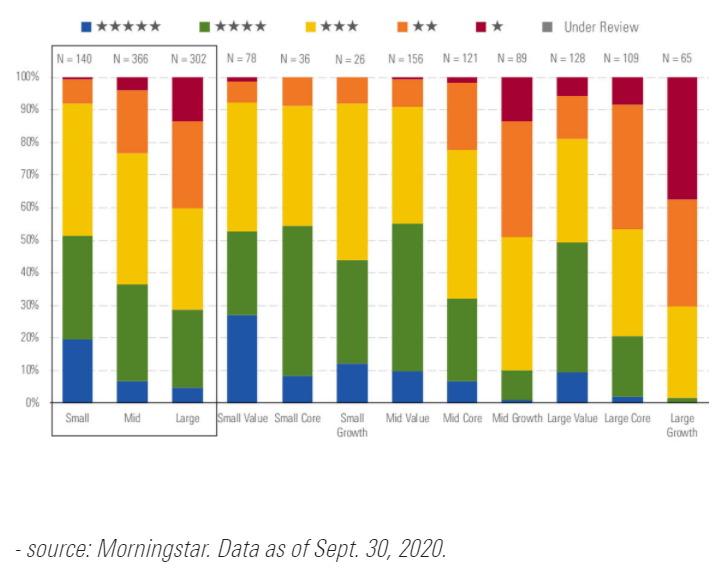
While we continue to see pockets of undervaluation, long-term investors may need to exhibit substantial fortitude in the fourth quarter. Considering the broad market is fairly valued, it doesn’t provide a margin of safety from any of the near-term potential catalysts that could diminish investor sentiment.
In addition, we think the broad market valuation has been propped up by several mega-cap stocks that are trading at levels that are significantly overvalued. As such, any increase in uncertainty could lead investors to reduce risk in their portfolios by selling stocks, which in turn could lead to a sharp risk-off correction.
We expect that the impact of most of the potential drivers in the fourth quarter would be short-term in nature.
In the short term, the timing of a vaccine approval is the biggest unknown that has the most significant consequences on the markets. We expect an effective vaccine will be approved over the next few months and rolled out in the first half of 2021. Any change to this timeline or a lack of efficacy of the vaccine would stifle the near-term prospects for the economic recovery.
We don’t think that the outcome of the presidential election will significantly alter our valuations or meaningfully change our economic outlook, but we do acknowledge that a contested result and drawn-out ballot counting or litigation would intensify short-term volatility. If President Trump were to be re-elected, we don’t foresee any significant policy changes and would expect the status quo. If former Vice President Biden were elected, but the Senate remains in Republican hands, we think he would be able to implement some of the policies he has advocated, but the scope would be limited. Finally, if there is a Democratic sweep across the presidency and Congress, then the Democrats would have wide latitude to implement the key Democratic priorities within their platform.
While the consensus from market forecasters on Wall Street is that the market will be especially volatile come this November, it could also be relatively mundane. The potential election issues are well known; the polls are constantly being taken into consideration; and the prospects for increased volatility have already been priced into the markets. For example, the implied volatility inherent in stock option contracts with November and December strike dates are already significantly higher than realized volatility.
For all the ink that will be spilled reporting on the election, we think that the election’s outcome will not impact the long-term future performance of the stock market for long-term investors as much as where the economy is during the business cycle.
As John Rekenthaler wrote: The effect on stock market returns three years after a presidential election has been due more to broader economic patterns than the party affiliation of the winners.
So, what should investors be doing over the next month?
The same as they always should be doing. Evaluate your risk tolerance level, determine the appropriate asset class mix of your portfolio, and rebalance as necessary. Once that has been accomplished, evaluate opportunities to readjust your asset class balances to position your investments into those that appear undervalued, such as small- and mid-cap value stocks.
Well, that was quick. Despite bleak global economic outlook and the continued uncertainty brought on by the coronavirus pandemic, as of August 6, 2020, the US market recovered to its pre-pandemic high.
Using the concept of the “pain index” coined by my colleague Dr Paul Kaplan, the covid-19 bear market goes down in history as one of the least painful on record, lasting a total of about 120 trading days with a maximum drawdown of about 34 per cent.
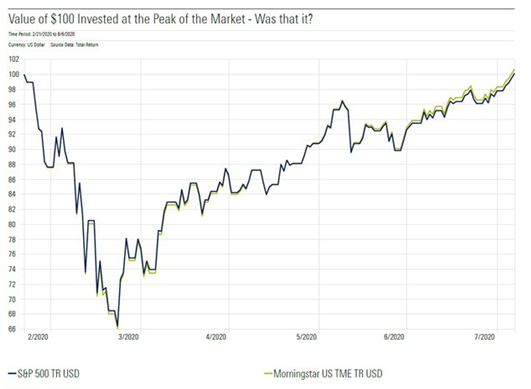
Source: Morningstar Direct | Data as of August 7, 2020
We could endlessly speculate on the reasons behind the recovery; however, it might be more productive to glean some concrete insights on its nature. To begin with, a quick look at the holdings of the SPDR S&P 500 ETF Trust shows us that the S&P 500 is concentrated.
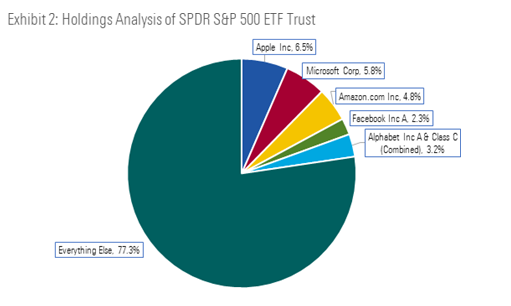
Source: Morningstar Direct | Data as of August 7, 2020
The broad market index long known as a representation of the US economy is somewhat concentrated on the five FAANG-type companies (if we count Google’s Alphabet as one entity), each of which has performed exceedingly well during the pandemic.
To understand to what extent these five names contributed to the index returns in this recovery, I ran a simulation of the S&P 500 index without them. To do this, I leveraged the Morningstar CPMS back testing engine by replicating a market- cap weighted portfolio of 494 companies, specifically excluding the five largest companies (including both share classes of Alphabet Inc) staring January 31, 2020. The parameters of the test included a calendar quarter re-balance at the end of March and June back to target weights with all dividends being re-invested to mimic the index.
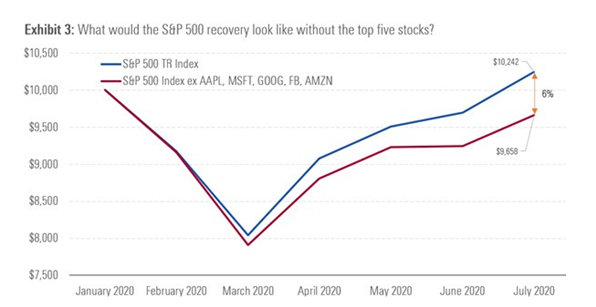
Source: Morningstar CPMS
Let’s look at what that means in dollar terms.
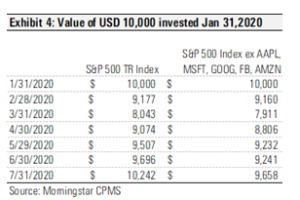
Source: Morningstar CPMS
The outcome of the test shows that without the five largest companies, the S&P 500 index would still have recovered to peak or near-peak levels but would have been a full 6 per cent lower in value at the end of July, assuming a common investment start date of January 31, 2020. Although the market recovery can’t be attributed solely to the success of the FAANG-type stocks, these stocks certainly played a critical role in the recovery so far.
Down under
For Australian stock investors, the recovery hasn’t been quite as boisterous. As of August 31, 2020, the Morningstar Australia GR index is roughly 8.9 per cent shy of its pre-pandemic highs.
Holdings analysis, Morningstar Australia Index
Portfolio date: 31/08/2020
Source: Morningstar Direct
Like in the US, the index also has a strong weighting to the five largest companies – CSL, CBA, BHP, Westpac and NAB. The fact that their performance – bar BHP – has been good but not exceptional since the March-lows, might explain why the Australian market hasn’t quite recovered. Moreover, the Index is heavily weighted to financials – 27.76 per cent – which have been hit hard by the economic fallout. The technology sector, which has done well since the March-falls, only makes up 3.67 per cent of the index.
Investment Growth
Time period: 03/02/2020 to 31/08/2020
Source: Morningstar Direct
Why market concentration is a bad thing
In the case of the US Market, having concentration in the top five names has helped performance during the recovery period of the pandemic. But it can also cause volatility when tech names dip, as we saw last week.
Investors with a mix of passive index ETFs, active funds, and individual stocks may unknowingly be over-exposed to a particular sector, or worse yet, a particular name. Single stock (or unsystematic risk) is caused by this very issue and can easily be taken care of by ensuring that you have a well-diversified portfolio.
The ‘core and satellite’ approach is a solid way to construct your investment portfolio, but it’s important to consider risk and fees.
Building an investment portfolio is not an easy task. Whether you’re a novice or a skilled adviser, picking the right funds takes time and research and, despite that, many times we all get something wrong.
One approach investors can take is to build a core and satellite portfolio. This strategy can help to spread investment risk without overly limiting your returns. The core, or centre or your portfolio, is allocated to investments that should deliver steady returns, while the satellite portion incorporates smaller investments in more specific funds in which you have a strong belief. You might, for example, want a technology fund that taps into the big tech stars of the future, or a commodities fund that will seek out oil and mining companies.
Because these satellite funds are more specific in their focus – and may be riskier in their choice of assets – you may consider putting only a small proportion ofbyour money in them, leaving most of your allocation to core funds. “Building the right portfolio is all about striking a balance between growth and risk,” says Darius McDermott, managing director at Chelsea Financial Services. “You need your pot of money to grow enough to achieve your financial goals, while also being comfortable with the level of risk you’re taking to succeed in that aim.”
1. How to pick a core fund
Core funds, as the name suggests, form the heart of your investment portfolio. It is the main building block around which to construct your satellites. Core funds are solid performers, those that deliver regardless of stock market conditions.
They are often low-volatility or passive options that track major market indices, such as the S&P 500, FTSE All-Share or Global Bonds, or multi-asset ETFs which provide exposure to a range of asset classes. Choosing a tracker fund as the core of your portfolio is a great way to keep costs down.
But investors may also select an actively managed fund for their core. Morningstar analysts’ favourite core funds include Gold-rated Greencap Broadcap, Gold-rated T. Rowe Price Global Equity and Silver-rated PIMCO Global Bond.
Several active managers now also offer access to their strategies via the exchange (exchange quoted managed fund – or active ETF) like Magellan, Platinum, Fidelity, ActiveX, Pinnacle and Schroders. This takes away the mountain of paperwork required by traditional unlisted managed funds and removes restrictive minimum initial investment requirements.
A core fund may have a global mandate to provide diversification, says Mark Preskett, portfolio manager at Morningstar Investment Management (MIM). Or it may have a “home bias”, focusing on the market where you live. “The key is that they outperform the market, while keeping their tracking error low,” Preskett adds.
2. How to choose satellite funds
Satellite funds are the additional positions you can use to build on your core and help to strengthen your returns. These may be more volatile options, perhaps in riskier or niche areas.
“They will generally make up a smaller proportion of your portfolio but can help you take advantage of more exciting or riskier opportunities without putting your entire investment port in too much jeopardy,” says Chelsea’s McDermott.
There are different ways to select satellites funds. Preskett looks for good valuations and reasonable fundamentals and has recently invested in funds focusing on energy, Korean equities and Mexican stocks, for example. He adds: “Small-caps, high-yield investments and emerging markets are all areas which could be satellite investments. It’s a good way to get exposure to out of favour markets.”
Satellite funds can also be a way to express your own interests or macroeconomic views. For instance, you may believe the gold price has further to climb, or perhaps you want to tap into trends such as cybersecurity or the shift to a cashless society.
Examples of supporting players Morningstar analysts rate highly include the Goldrated Pendal Small Companies, Gold-rated Platinum Asia, Silver-rated GQG Partners Global Equity and Gold-rated Vanguard Index Australian Property.
3. Don’t forget fees
While a core fund holding may stay in your portfolio for many years, a satellite fund may have a shorter shelf life. Preskett says that while it is OK for these investments to be tactical, investors should avoid trading too regularly or trying to time the market, not least because it adds to your costs.
“Investors are often attracted to the latest ideas and fads, often because they have had a recent bout of strong performance,” Preskett says. “This may mean you then invest in a volatile market after it has already risen, and that could come back to bite you.”
Bear in mind fees, too. Niche funds may often have a more expensive price tag than a plain vanilla option; and when choosing your satellites, remember: the higher the fee, the greater the returns you need to make an impact.
The key to the core-and-satellite approach is to find the right balance between risky and less risky options for your own investment needs. “Keep your satellites as satellites, a small portion of your portfolio,” says Preskett. “Without the proper research it’s easy to get into trouble, but by being sensible this approach can reap rewards.”
Adviser Research Centre users can access the Fund screener tool HERE.
With this tool Advisers can search on Morningstar Analyst rated funds and determine what type of fund they are looking for eg, Core or Satellite to aid in portfolio construction.
Morningstar Analyst Rating is based on interviews with management and fundamental analyst research on the people, process and philosophy, the Morningstar Analyst Rating reflects our analyst insight and opinion on the capabilities of the strategy moving forward from today .Analyst conviction is summarised on a five-point scale. Gold, Silver, Bronze, Neutral, and Negative. Gold rated funds are funds have our highest-conviction recommendations and stand out as best-of-breed for their investment mandate.
The “Research Flagship Fund” is the primary share class that analysts in Australia and New Zealand rate. The other vehicles are typically called siblings or platform funds.
Role in Portfolio – A guide to assist with portfolio allocation, funds can be designated core, or supporting. Core funds should be the bulk of an investor’s portfolio, while supporting players contribute to a portfolio, but are secondary to the core.
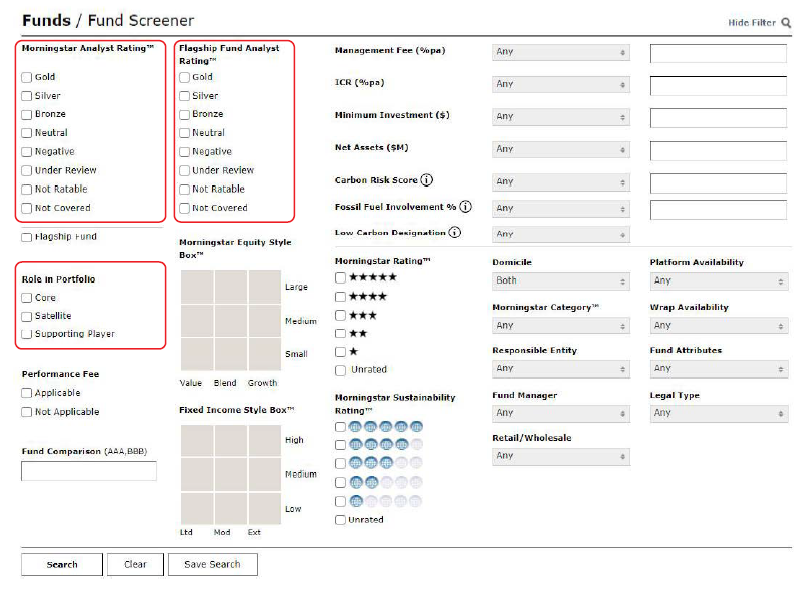
Original article “Investing basics: how to build a core and satellite fund portfolio” can be found here.
History will record that the few years until 2019 were halcyon days for Listed Investment Companies (LICs) and Listed Investment Trusts (LITs). It will never be as good using the traditional ‘closed-end’ structures. A record amount of over $4 billion was invested in new issues during 2019, up from $3.3 billion the previous year. Fixed interest LITs alone raised $2.2 billion in four issues in 2019, with the largest by KKR (ASX:KKC) achieving an incredible $925 million in only a few weeks.
The main listed competitor for the LIC/LIT structure is Exchange Traded Funds (ETFs). While LICs/LITs have failed to launch any primary transactions in 2020, ETFs have gone from strength to strength, reaching a record $70 billion in August, a lead of $25 billion over their rivals. As recently as January 2019, LICs/LITs were larger, as shown below.

What has hit LICs/LITs?
Two factors are undermining demand for LICs/LITs.
1. Ban on stamping fees
A significant amount of demand was driven by stamping fees paid to brokers and advisers. Firstlinks has already covered this subject in detail, including here and here. For example, the KKR offer documents in 2019 stated:
“the Manager will pay to each Broker a selling fee of 1.25% (exclusive of GST) of the amount equal to the total number of Units for which the relevant Broker procured valid Applications.”
Brokers often shared the fees with advisers. On 20 May 2020, the Treasurer announced the results of an investigation which had started on 27 January 2020. It concluded:
“Extending the ban on conflicted remuneration to LICs will address risks associated with the potential mis-selling of these products to retail consumers.”
2. Consistent trading at a discount to Net Tangible Assets
Investors have tired of the inability to exit from most LICs/LITs at the value of Net Tangible Assets, or NTA. At the time when liquidity was most needed during the March 2020 COVID-19 sell-off, with no mechanism to create buying interest in a closed-end fund, prices collapsed, as described here.
Despite the subsequent stock market recovery, discounts remain and much damage is done. Some of the highest-profile managers in the market are overlooked by investors despite their reputations.
LIC/LIT premiums/discounts to NTA based on market capitalisation

Six LICs turn to radical solutions
Such is the severity of the problem that new announcements are now made every week by LICs/LITs attempting to address the discount problem. For the directors of many of these listed vehicles, most board time is spent on addressing and then implementing solutions, including:
1. Ellerston Global (previously ASX:EGI)
The best example of the extraordinary effort, cost and time expended to fix the discount frustration is Ellerston Global and its conversion into unlisted units in the Ellerston Global Mid Cap Fund. The Explanatory Booklet is 402 pages which nobody will read in full except the lawyer who drafted it.
Ellerston deserves praise for addressing the discount problem using a fund which will face redemptions. However, where previously investors held a listed vehicle which could be bought and sold easily on the exchange, they are now converted to an unlisted trust with tiresome paperwork of new application forms and identifications.
The holders of EGI do not simply receive units in the new fund, but a 24-page Information Form must be completed, and:
“You will not receive your Units in the Ellerston Fund under the Scheme unless and until you complete this Form (including all supporting documents).”
Ellerston undertook this process for a good reason, to address the structural weakness of LICs when too few buyers are in the market. The Scheme offers:
“The elimination of the persistent discount to NTA at which EGI Shares have traded on ASX since EGI’s listing on ASX in October 2014. Although the portfolio performance has been strong, EGI Shares have persistently traded at a discount to EGI’s NTA. The price of Units in the Fund is expected to reflect more closely the underlying performance of the Fund Portfolio.”
There is an ironic footnote to the LIC which has taken Ellerston most of 2020 to unwind. Their website continues to espouse the benefits of the structure they have just rejected. It says:
“Listed Investment Companies (LICs) are a viable and well-established alternative to the managed fund and in fact have some considerable advantages when compared to managed funds.”
Perhaps it’s because they continue to offer Ellerston Asian Investments (ASX:EAI) in listed form.
2. Antipodes Global (ASX:APL)
Antipodes should have all the right ingredients for a listed vehicle to trade well. It was established by Jacob Mitchell in 2015 after 14 years at Platinum Asset Management as Deputy Chief Investment Officer to Kerr Nielson. The fund manager had a successful start and manages an impressive $8 billion, yet its LIC has traded at a discount as high as 20%, as shown in the green bars below. In the first two years, it was keenly sought and even traded at a premium, but investors have fallen out of love with APL.
APL premium/discount since listing

After buying back 13% of the company’s shares at an average discount to NTA of over 14% without moving the needle, a more drastic step was needed. The board is offering a ‘discount control mechanism’ under a tender programme with the following features:
- Shareholders will have the opportunity to tender their shares for sale to the company via an off-market buyback.
- The maximum number of shares the company can buy back will be 25% of the shares on issue at that time.
- The tender offer price will be NTA less 2% as calculated on or around the closure of the offer period.
- The offer will take place if the company’s closing share price exceeds a 7.5% discount to pre-tax NTA.
- The board will make the offer regularly in future, aiming for every three years.
This is similar to a structure used by Ironbark Capital (ASX:IBC) to doubtful success, as it is currently trading at 44 cents versus an NTA of 51 cents. The downside is that a smaller company must spread its fixed costs over fewer assets, potentially increasing its management expense ratio.
Nevertheless, APL is attempting to remove the discount which must be an embarrassment to someone like Jacob Mitchell, and these repurchase practices have worked in other countries.
3. Blue Sky Alternatives Access Fund (ASX:BAF)
Geoff Wilson’s Wilson Asset Management (WAM) is a long-time market leader in promoting the merits of LICs. Some of their funds, such as WAM Capital, trade at a premium to NTA, and their shareholder engagement is strong. Wilson has a history of acquiring underperforming LICs and bringing them into his stable. WAM Capital (ASX:WAM) currently has an offer in the market to acquire the Concentrated Leaders Fund (ASX:CLF), and an independent board committee has been established by CLF to consider the offer.
Wilson has recently taken over the management of BAF, creating WAM Alternative Assets to complement his other funds such as Microcap and Global. BAF has struggled at a hefty discount to NTA of around 30% under previous management, and Wilson will now seek to address it.
What is different from the other times Wilson has taken over a LIC is a mechanism, called a Premium Target, which potentially terminates WAM as manager and liquidates the company if Wilson is unsuccessful, as follows:
“ … we have agreed to deliver on the Premium Target, a first of its kind in the Australian market. The principle of the Premium Target is simple: the Company’s share price needs to trade at a premium to its pre-tax NTA for a period of one month for it to be achieved. If this does not occur at least three times during the next five years, shareholders will automatically have the right to vote to terminate the arrangements with Wilson Asset Management, and to liquidate the Company.”
At the time of writing, BAF was trading at 87 cents on an NTA of $1.08, despite a heavy buyback programme, including:
“During the month, the Alternatives Fund acquired an additional 252,706 shares at an average price of $0.76159 representing a 30% discount to August’s pre-tax NTA.”
Boards often embark on these buybacks to show investors they are doing something tangible, but they rarely work in Australia on a sustained basis.
Although there have been no LIC/LIT primary issues in 2020, WAM continues to raise money on existing LICs, such as the $88 million added to WAM Microcap in a recent Share Purchase Plan supported by 55% of shareholders.
Register here to receive the Firstlinks weekly newsletter for free
4. Monash Absolute Investment Company (ASX:MA1)
Monash recently won ‘Best Listed Alternative Investment Product’ at the Australian Alternative Investment Awards 2020. When a fund which regularly trades at a 15% to 20% discount wins an award, there is not much recognition of the LIC discount problem. Despite its solid investment performance under well-known manager Simon Shields, at the time of writing, it trades at $1.07 against a pre-tax NTA of $1.23, and has been at a heavy discount for years.
Monash (MA1) premium/discount to NTA

The board is proposing to restructure MA1 into an Exchange Traded Managed Fund (ETMF) which allows units to be issued or redeemed at close to the NTA. It will become yet another company removed from the traditional closed-end LIC world.
5. Absolute Equity Performance Fund (ASX:AEG)
AEG has delivered excellent recent performance after a poor start as a listed company. It lost some support in 2016 and its shares traded at solid discounts to NTA. In 2019 and 2020, investors have shown more interest in this absolute return ‘pairs’ strategy, and here is the pre-tax NTA since inception:

Shares have traded closer to NTA in recent months, but in July 2020, the board announced to the exchange that:
“The Board … has received a non-binding proposal (Proposal) from its investment manager, Bennelong Long Short Equity Management Pty Ltd (BLESM). In summary, the Proposal details an amalgamation of AEG and an unlisted managed investment scheme, Bennelong Market Neutral Fund (BMN). BLESM is the investment manager of BMN. BLESM indicates the Proposal is designed to eliminate the share price discount due to the difference between AEG’s net tangible asset position and its current share price, and improving liquidity. As part of the Proposal, AEG shareholders would receive units in BMN and ultimately AEG would be would up.”
It’s another LIC facing delisting as discussions continue.
(Disclosure: Until a year ago, I was on the board of this company. All the information in this article comes from public announcements).
6. Contango Income Generator (ASX:CIE)
Perhaps the most unusual of all the solutions to poor trading levels comes from CIE, which intends to change fundamentally how it manages money. The Managing Director of Contango is Marty Switzer, son of Peter. Established in August 2015 as an income-focused, ex-top 20 Australian equity fund paying franked dividends, it lost -19.5% in the 12 months to 31 July 2020. It is now proposing to adopt a global equity strategy by switching the money into the WCM Quality Global Growth Long Short Strategy, subject to shareholder approval.
Again, the discount to NTA is the culprit, and the company announced:
“One of the key reasons for the independent non-executive Directors unanimously recommending the new investment strategy was the potential to address the share price discount to net tangible assets (“NTA”) by increasing liquidity, growing the size of the Company and improving the investment performance. In addition, the Board of the Company assures shareholders that, in order to achieve this objective, it will actively consider appropriate capital management tools to reduce the share price discount to NTA.”
What makes this move even more interesting is that two of Australia’s highest profile investors, Peter Switzer and Geoff Wilson again, are involved in the battle for control. Switzer’s group distributes WCM funds in Australia, while Wilson has requisitioned that WAM take control of the board and become the new investment manager. The argument has turned combative with Switzer questioning why Wilson does not report the performance of his funds after fees, and Wilson saying the WCM terms are unfavourable. Complicating matters is the fact that WCM’s existing LIC (ASX:WQM) itself trades at an average discount to NTA of about 15%.
The problem for investors bemused by the stoush is that if they want to sell out of CIE, they must accept a hefty discount.
Shareholders should demand more changes
Some of the old-fashioned LICs, such as Australian Foundation Investment (ASX:AFI) with $7.6 billion and Argo Investments (ASX:ARG) with $5.4 billion, have a long history of trading around NTA, sometimes at a premium, with low fees. Among the 100+ LICs/LITs on issue, the structure can work in the right circumstances.
However, many of the LICs issued in recent years are small or not well supported and were sold to investors by brokers and advisers with the hope that the market would deliver decent liquidity. There was little follow-through demand as participants moved on to the next hot deal, sometimes even selling the existing issue to make way for the new glamour stock and its fee. Fund managers and their boards hang on, safe in the knowledge that long-term management contracts are in place, offering buybacks as a salve to shareholder concern.
The boards and managers adopting solutions, including Magellan’s dual listed/unlisted structure, deserve recognition for giving investors a better opportunity to realise their asset values.
When LICs and LITs trade at persistent discounts for years, shareholders should become more active in attending annual meetings and writing to boards, prompting actions such as:
1. Convert to an open-ended ETF which allows cancellation or creation of shares at NTA.
2. Adopt a timetable where investors are given an exit facility at NTA, perhaps annually or at least every three years.
3. Delist into an equivalent unlisted fund with a redemption option, although investor paperwork is cumbersome.
4. Adopt the dual structure of unlisted managed fund and listed ETF.
Investors have tolerated complacency on many LICs for years and there are now market mechanisms showing how to address the problems.
Here’s how the post-covid workday will look: at the conclusion of your seventh Zoom meeting for the day, you shut the work email and associated company tabs on your work computer and visit the already open food delivery tab. You punch in an order, scheduling it to arrive in an hour or so. In the interim, you visit another tab, which features your favourite exercise slash yoga app, put in your custom settings and off you go. And at some stage during this process, you’ll wash your hands for the umpteenth time.
If this routine feels familiar, it’s probably because you’ve been observing it for a good part of the past 180 days. In other words, almost three times the amount of time it takes for a habit to form, according to that oft-cited figure of 66 days. Morningstar this week released the first in a series of reports on the world after covid-19, part of which considers the extent to which an extreme but temporary shock can alter our behaviour.
“We ranked a few behavioural changes induced by covid-19 containment measures, finding that working from home, online shopping and exercising from home may be best positioned to persist after the crisis in the form of habits,” writes lead author and Morningstar’s head of economics Preston Caldwell. Thankfully, the report suggests, abstaining from travel and mass gatherings is less likely to form a habit, given the “lower regularity of performed action, little pleasure involved in skipping these experiences, and no support from corporate action (apart from home delivery services such as Deliveroo providing some substitute for restaurant dining).”
The determinant in all this is human psychology—in short, fear. The word itself appears no less than 34 times in the report. “Fear of the next pandemic (including a covid-19 resurgence) is another psychological factor that could affect many of the same industries as changes in habits,” the report says. “Conditional on a successful vaccine being developed, the risk of catching a severe infectious disease post-pandemic won’t be materially higher than it was before the pandemic started. Nevertheless, consumers have been made vividly aware of the risk, and it’s difficult to predict exactly how this psychological factor will play out in shaping consumer behaviour.
“On the one hand, it seems dubious that anyone will avoid eating in a restaurant due to fear of being exposed to an emerging infectious disease. However, perhaps the largest and densest kinds of social gatherings (for example, public transit, air travel, and large events) will inspire lingering fear.” You can read more on the Morningstar report into the effect of past external shocks here.
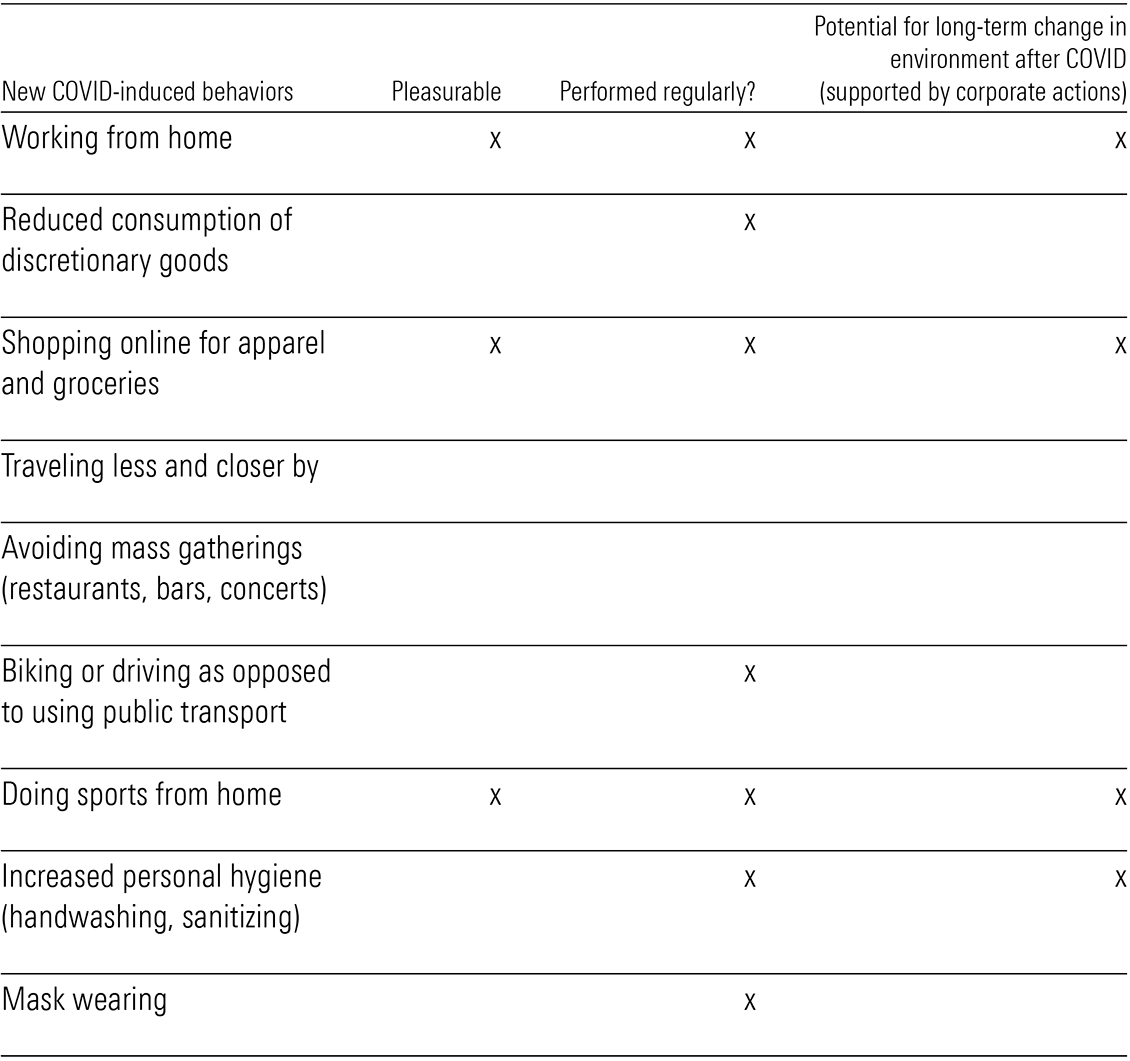
Source: Morningstar Premium
On that note, be sure to complete the covid-19 poll in Firstlinks this week. It’s a follow-up to the survey Graham Hand first ran in April. How have your attitudes changed? What do you think of the government’s policies in relation to JobKeeper and superannuation? How will the US election change things? What will the Australian stock market do? How is your portfolio performing? What are you investing in now? When do you think the crisis will end? The poll should take about five minutes to complete, and responses will always remain anonymous. Hand will publish the full results next week.
Elsewhere this week, Emma Rapaport profiles three small-cap funds, which carry a Morningstar Gold rating. She also digs in to a new report from the Responsible Investment Association Australasia, which reveals Australian and multi-sector responsible funds outperformed mainstream funds over every time horizon—one, three, five and 10 years.
We hear from Morningstar’s David Whiston on why General Motors’ truck-making tie-up with Tesla rival Nikola is a good move.
Morningstar’s Karen Andersen reports on the latest in the hunt for a covid-19 vaccine. Resurgences in outbreaks make it clear that ending the pandemic requires more than testing, contact tracing, and social distancing, Andersen says.
If you don’t play Fortnite, you probably know someone who does. Nicki Bourlioufas explains why some asset managers argue the video games industry, the fastest growing segment of consumer entertainment, risks being overlooked.
Holly Back catches up with Morningstar’s Hong Kong-based analyst Chelsey Tam, who reveals which Chinese stocks and sectors have shone—and which have underwhelmed.
And speaking of China, in Your Money Weekly, Peter Warnes, who this week marks two decades at Morningstar, addresses Donald Trump’s talk of a potential “decoupling” with the world’s fastest growing economy and why it could backfire on the US.
Visit Morningstar’s Reporting Season 2020 coverage. The calendar will be updated daily to connect you with our equity analysts’ take on the financial results.
Morningstar’s Global Best Ideas list is out now. Morningstar Premium subscribers can view the list here.
Investors in shares must expect market shocks as part of the long-term benefits of owning part of a company, and on average over time, stock markets fall one year in every five. History provides a valuable guide to how markets normally recover from shocks, showing the missed opportunities of exiting equities and not re-entering.
However, it must be acknowledged that coronavirus did not start as a financial shock, such as a rapid fall in share prices or a market collapse such as the GFC or tech wreck. This started as a social and health scare and has spread into financial markets, which might limit what history can teach us. As supply chains close and countries shut their borders, the wealth created by globalisation will be compromised, and with it, economic growth and business activity will fall, at least in the short term.
Please let me know if there is more we can do to support you and your business. We’re here to help you through this volatile time to continue to empower investor success.
Regards
Tony Gangemi
Head of Adviser Software Solutions, Morningstar Australasia Pty Ltd. [email protected]
Power of Reinvesting
2000-2019
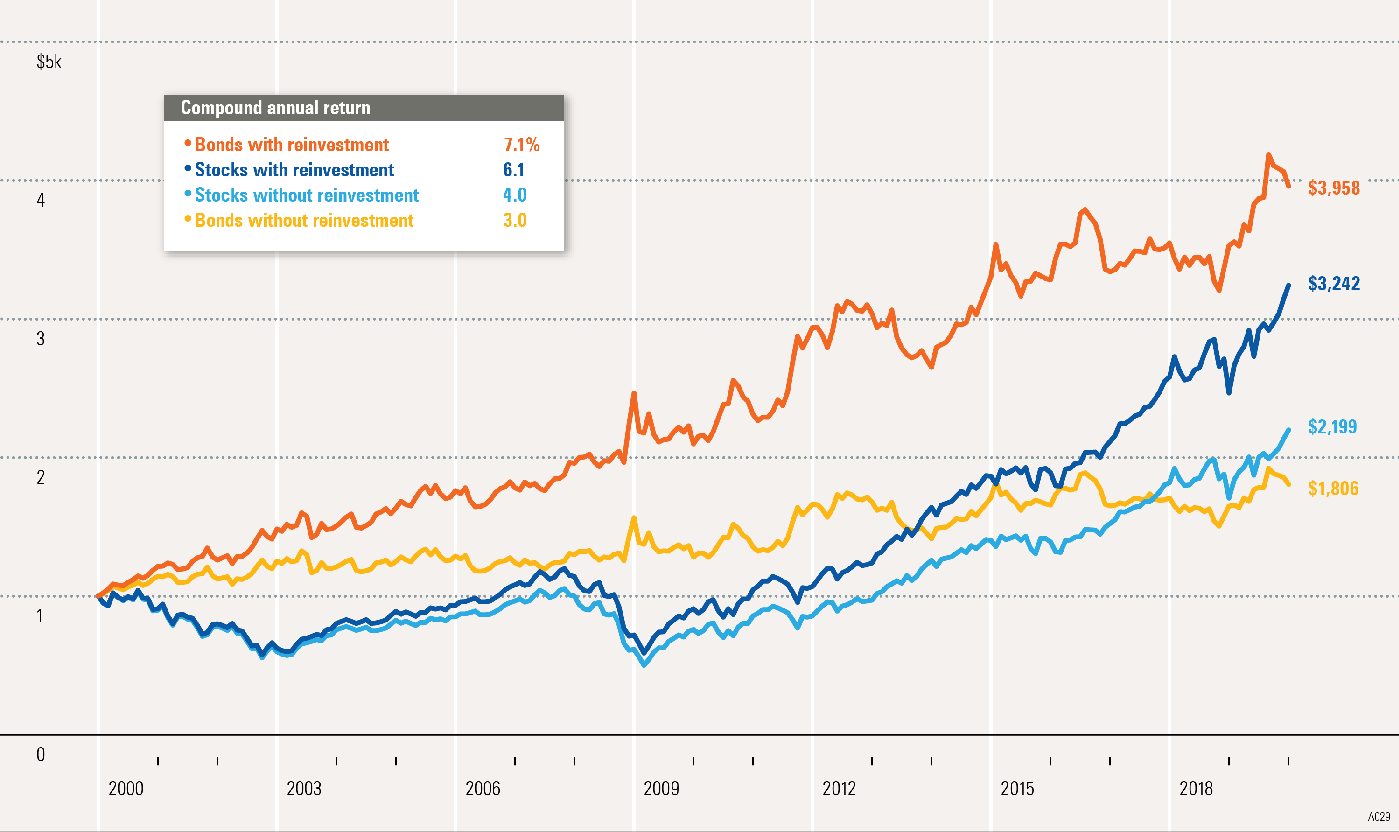
About the data
Stocks are represented by the Ibbotson® Large Company Stock Index. Bonds are represented by the 20-year U.S. government bond. An investment cannot be made directly in an index.
Past performance is no guarantee of future results. Hypothetical value of $1,000 invested for the past 20 years. Data does not account for taxes or transaction costs. This is for illustrative purposes only and not indicative of any investment. An investment cannot be made directly in an index. © Morningstar 2020. All Rights Reserved.
- A key to enhancing returns is the reinvestment of income. Returns decline dramatically if dividends or coupon payments are consumed rather than reinvested.
- The image compares the difference in hypothetical growth of $1,000 invested in stocks and bonds with and without the reinvestment of dividends or coupon payments.
- Reinvesting your income enables you to take advantage of compounding. With compounding, you earn income on the principal in addition to the reinvested dividends and coupon payments.
- If you are an investor who does not need to spend dividends or coupon payments, you should consider reinvesting this income in order to maximise the growth of your portfolio.
- Keep in mind that total return represents capital appreciation, income, and reinvestment of income, and that capital appreciation is the return owing to changes in price. Government bonds are guaranteed by the full faith and credit of the U.S. government as to the timely payment of principal and interest, while stocks are not guaranteed and have been more volatile than bonds.
Power of Compounding
Hypothetical Investment in Stocks
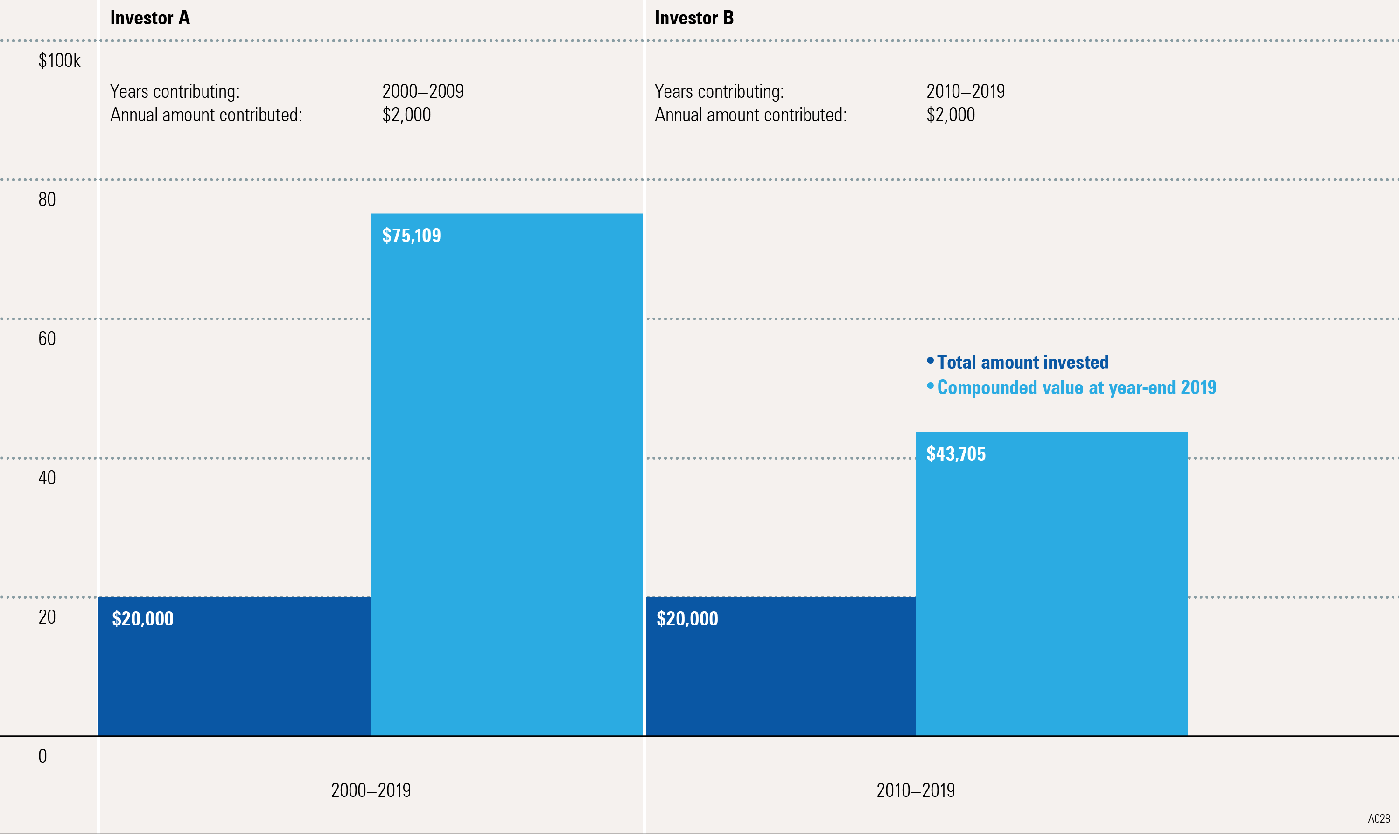
About the data
Stocks are represented by the Ibbotson® Large Company Stock Index. An investment cannot be made directly in an index.
Past performance is no guarantee of future results. This is for illustrative purposes only and not indicative of any investment. An investment cannot be made directly in an index. © Morningstar 2020. All Rights Reserved.
- It’s easy to procrastinate when it comes to initiating a long-term investment plan. However, the sooner you begin, the more likely it is that the plan will succeed.
- This image illustrates the effects of compounding over time. Investor A began investing in stocks at the beginning of 2000, investing $2,000 each year for 10 years. After 10 years, Investor A stopped contributing to the portfolio but allowed it to grow for the next 10 years. The $20,000 outlay grew to $75,109 by year-end 2019.
- Investor B postponed investing for 10 years. At the beginning of 2010, Investor B began investing $2,000 each year in stocks for 10 years. The $20,000 outlay of Investor B (same as the one of Investor A) only grew to $43,705 by year-end 2019.
- By starting early, and thereby taking advantage of compounding, Investor A accumulated $31,404 more than Investor B, while investing exactly the same amount.
- Returns and principal invested in stocks are not guaranteed, and stocks have been more volatile than the other asset classes. The data assumes reinvestment of income and does not account for taxes or transaction costs.
Importance of Rebalancing
1999-2019
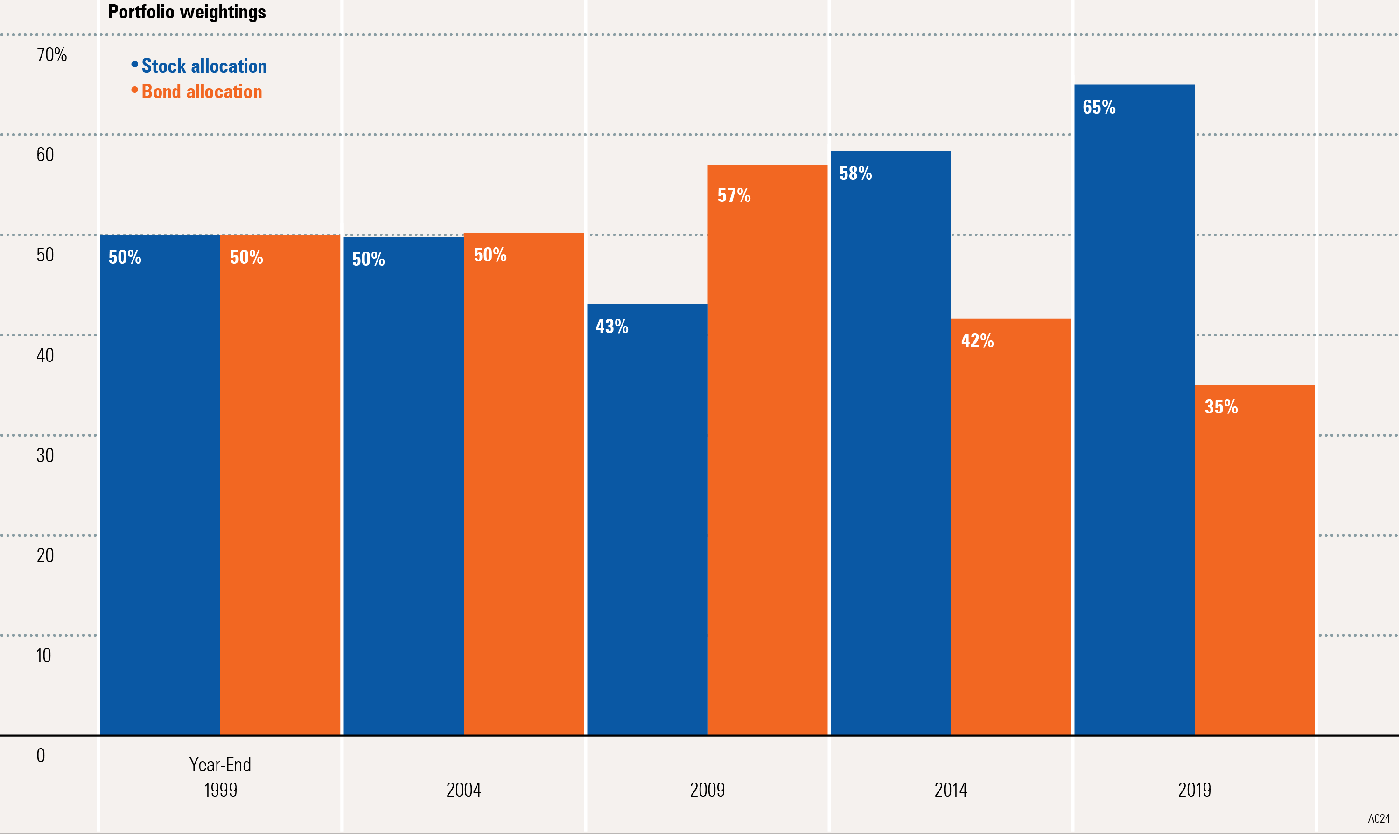
About the data
Small stocks are represented by the Ibbotson® Small Company Stock Index. Large stocks are represented by the Ibbotson® Large Company Stock Index. Intermediate-term government bonds are represented by the five-year U.S. government bond. An investment cannot be made directly in an index. The data assumes reinvestment of income and does not account for taxes or transaction costs.
Past performance is no guarantee of future results. Stocks: 50% large and 50% small stocks. Bonds: intermediate-term government bonds. This is for illustrative purposes only and not indicative of any investment. An investment cannot be made directly in an index. © Morningstar 2020. All Rights Reserved.
- Because asset classes grow at different rates of return, it is necessary to periodically rebalance a portfolio to maintain a target asset mix.
- This image illustrates the effect of different growth rates on a static (unbalanced) portfolio over a 20-year period. At year-end 1998, the target asset mix began with a 50% allocation to stocks and a 50% allocation to bonds.
- Nothing much changed between 1999 and 2004, with bonds gaining a slight edge over stocks with 50.2% versus 49.8%. Subsequent market fluctuations caused the stock allocation to decrease to 43% by 2009 and increase to 58% in 2014 and 65% in 2019. This allocation is drastically different from the 50%/50% portfolio the investor started out with.
- Asset classes associated with high degrees of risk tend to have higher rates of return than less volatile asset classes. For this reason, a portfolio that is not rebalanced periodically may become more volatile (riskier) over time.
- Diversification does not eliminate the risk of investment losses. Government bonds are guaranteed by the full faith and credit of the U.S. government as to the timely payment of principal and interest, while stocks are not guaranteed and have been more volatile than bonds.
Managing Risk With Portfolio Rebalancing
The Risk and Return of Rebalanced versus Nonrebalanced Portfolios
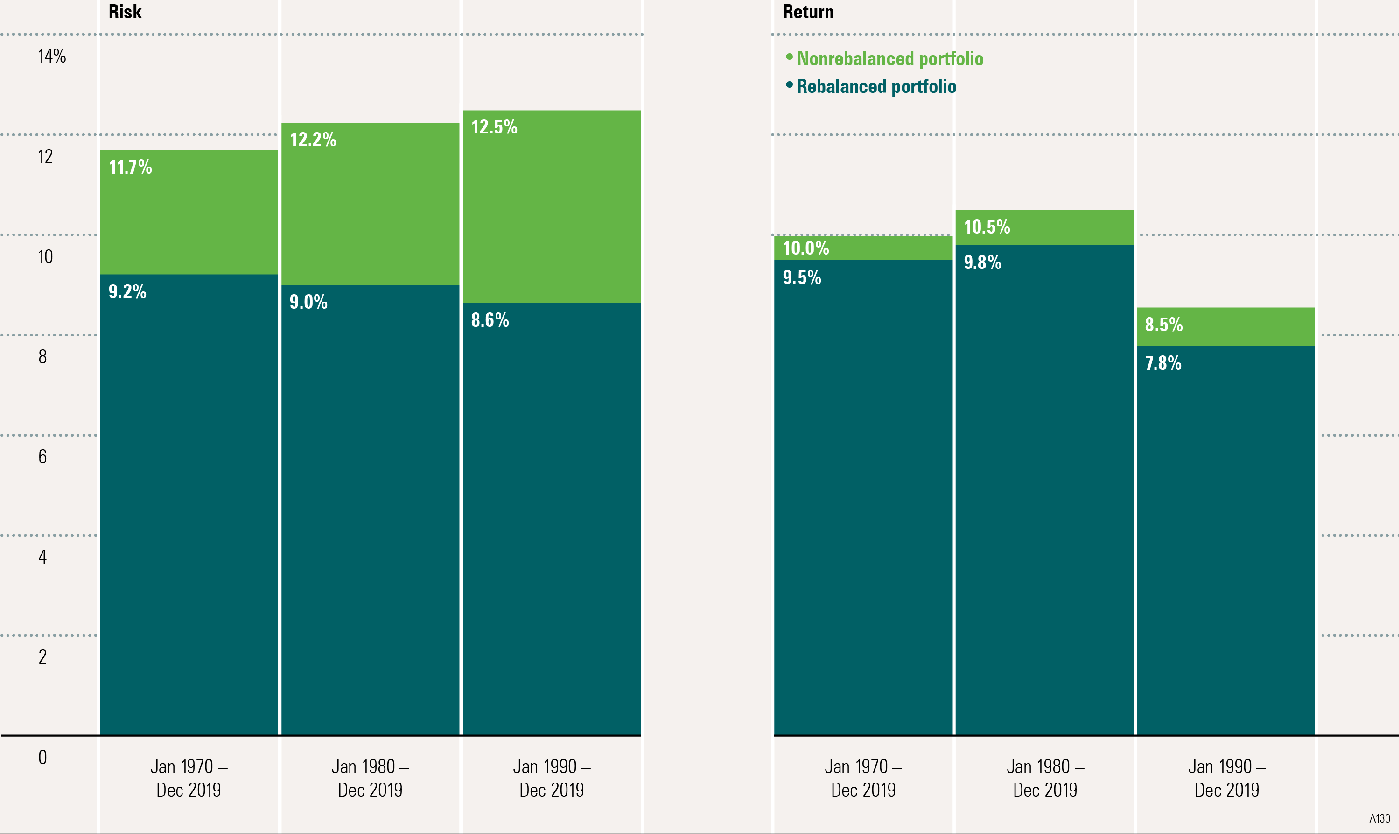
- Over time, an investor’s portfolio asset-allocation policy can get disturbed by market ups and downs. For example, stocks tend to outperform bonds in the long run. Since stocks are riskier than bonds, a greater allocation in stocks can also increase portfolio risk. Rebalancing is an essential account-management tool that helps keep the portfolio within the risk tolerance level that is comfortable for the investor’s asset-allocation strategy.
- The image compares the risk and return of portfolios that were rebalanced to those that were not rebalanced over three different time periods. Risk and return were measured by monthly annualised standard deviation and compound annual return, respectively. Standard deviation measures the fluctuation of returns around the arithmetic average return of the investment. The higher the standard deviation, the greater the variability (and thus risk) of the investment returns.
- The returns for the nonrebalanced portfolio were higher in all three time periods. However, the risk was also considerably higher. In all three time periods, the rebalanced portfolio had a much lower risk than the nonrebalanced portfolio. This illustrates how rebalancing can help manage risk.
- Diversification does not eliminate the risk of investment losses. Government bonds and Treasury bills are guaranteed by the full faith and credit of the U.S. government as to the timely payment of principal and interest, while stocks are not guaranteed and have been more volatile than bonds. International investments involve special risks such as fluctuations in currency, foreign taxation, economic and political risks, and differences in accounting and financial standards.
Dangers of Market-Timing
Hypothetical Value of $1 Invested from 1926-2019
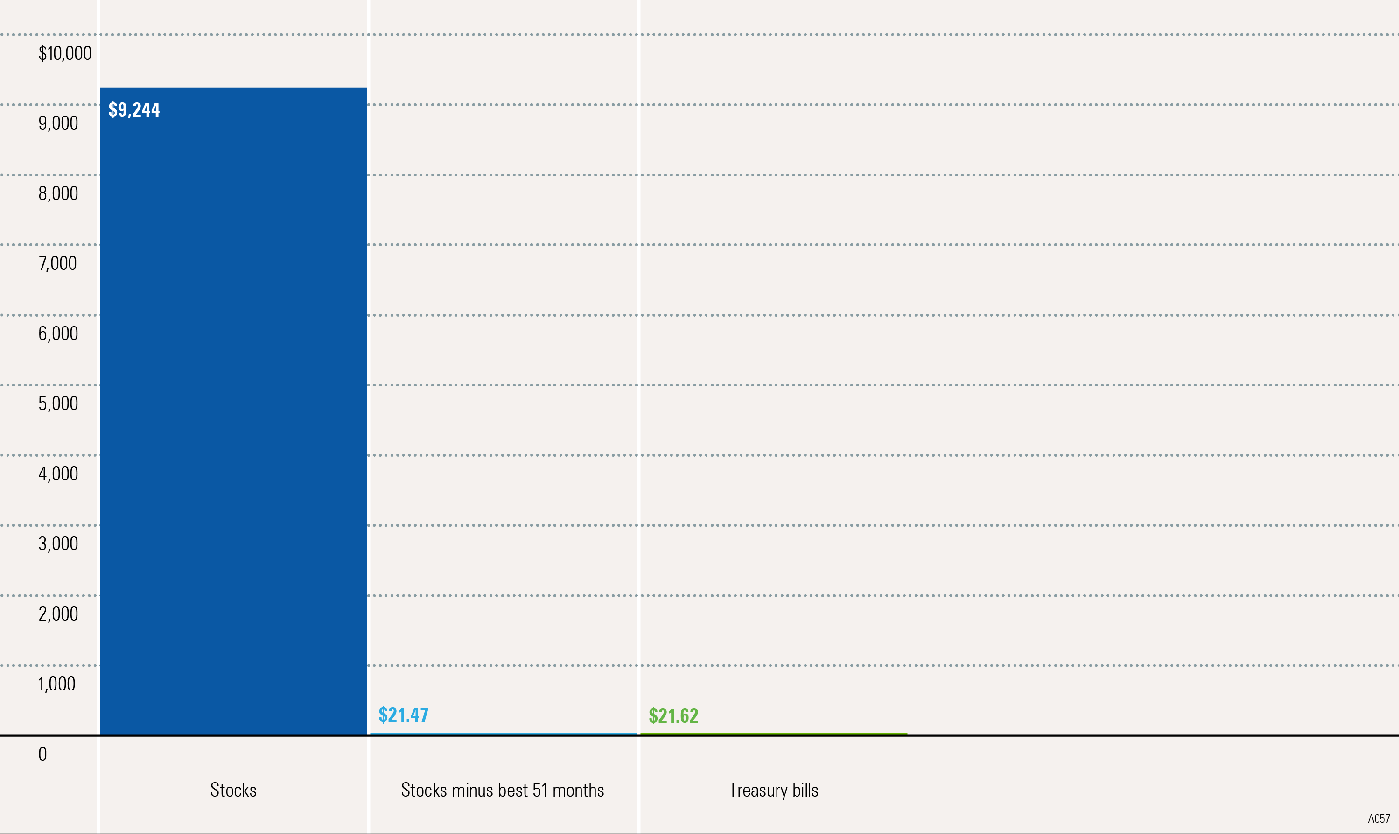
About the data
Stocks are represented by the Ibbotson® Large Company Stock Index. Treasury bills are represented by the 30-day U.S. Treasury bill. The data assumes reinvestment of income and does not account for taxes or transaction costs.
Past performance is no guarantee of future results. This is for illustrative purposes only and not indicative of any investment. An investment cannot be made directly in an index. © Morningstar 2020. All Rights Reserved
- Investors who attempt to time the market run the risk of missing periods of exceptional returns. This practice may have a negative effect on a sound investment strategy.
- This image illustrates the risk of attempting to time the stock market since 1926.
- A hypothetical $1 invested in stocks at the beginning of 1926 grew to $9,244 by year-end 2019. However, that same $1 investment would have only grown to $21.47 had it missed the best 51 months of stock returns. One dollar invested in Treasury bills resulted in an ending wealth value of $21.62. An unsuccessful market-timer, missing the 51 best months of stock returns, would have received a return roughly equivalent to that of Treasury bills.
- Although successful market-timing may improve portfolio performance, it is very difficult to time the market consistently. In addition, unsuccessful market-timing can lead to a significant opportunity loss.
- Returns and principal invested in stocks are not guaranteed, and stocks have been more volatile than other asset classes. Government bonds and Treasury bills are guaranteed by the full faith and credit of the U.S. government as to the timely payment of principal and interest. Holding a portfolio of securities for the long term does not ensure a profitable outcome and investing in securities always involves risk of loss.
Dangers of Market-Timing, Part II
Hypothetical Value of $1 Invested from 2000-2019
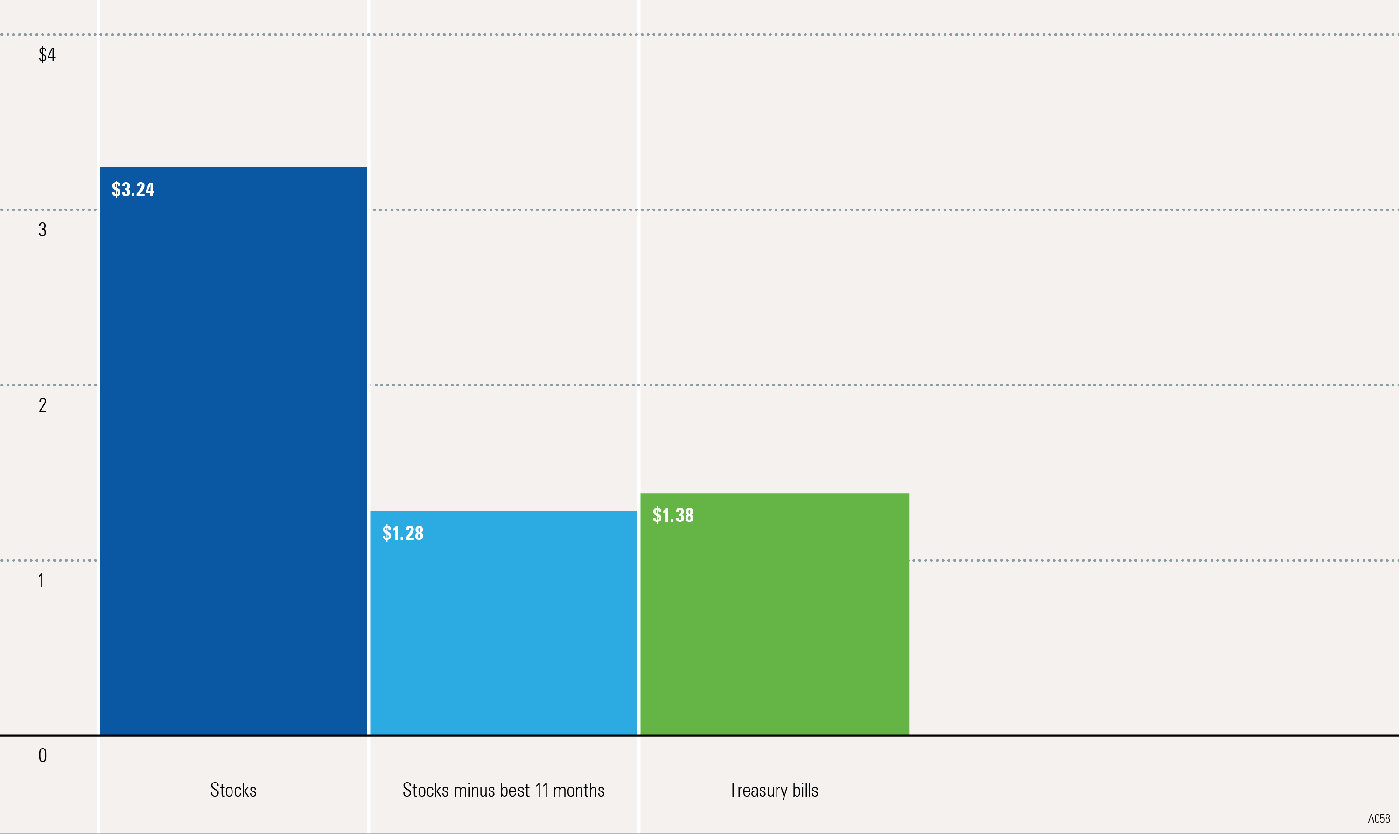
About the data
Stocks are represented by the Ibbotson® Large Company Stock Index. Treasury bills are represented by the 30-day U.S. Treasury bill. An investment cannot be made directly in an index. The data assumes reinvestment of income and does not account for taxes or transaction costs.
Past performance is no guarantee of future results. This is for illustrative purposes only and not indicative of any investment. An investment cannot be made directly in an index. © Morningstar 2020. All Rights Reserved.
- Investors who attempt to time the market run the risk of missing periods of exceptional returns. This practice may have a negative effect on a sound investment strategy.
- This image illustrates the risk of attempting to time the stock market over the past 20 years.
- A hypothetical $1 invested in stocks at the beginning of 2000 grew to $3.24 by year-end 2019. However, that same $1 investment would have only grown to $1.28 had it missed the eleven best months of stock returns. One dollar invested in Treasury bills over the 20-year period resulted in an ending wealth value of $1. 38. An unsuccessful market-timer missing the nine best months of stock returns would have received a return similar to that of Treasury bills.
- Although successful market-timing may improve portfolio performance, it is very difficult to time the market consistently. In addition, unsuccessful market-timing can lead to a significant opportunity loss.
- Returns and principal invested in stocks are not guaranteed, and stocks have been more volatile than other asset classes. Government bonds and Treasury bills are guaranteed by the full faith and credit of the U.S. government as to the timely payment of principal and interest. Holding a portfolio of securities for the long term does not ensure a profitable outcome and investing in securities always involves risk of loss.
Market-Timing Risk
The Effects of Missing the Month of Annual Returns, 1970-2019
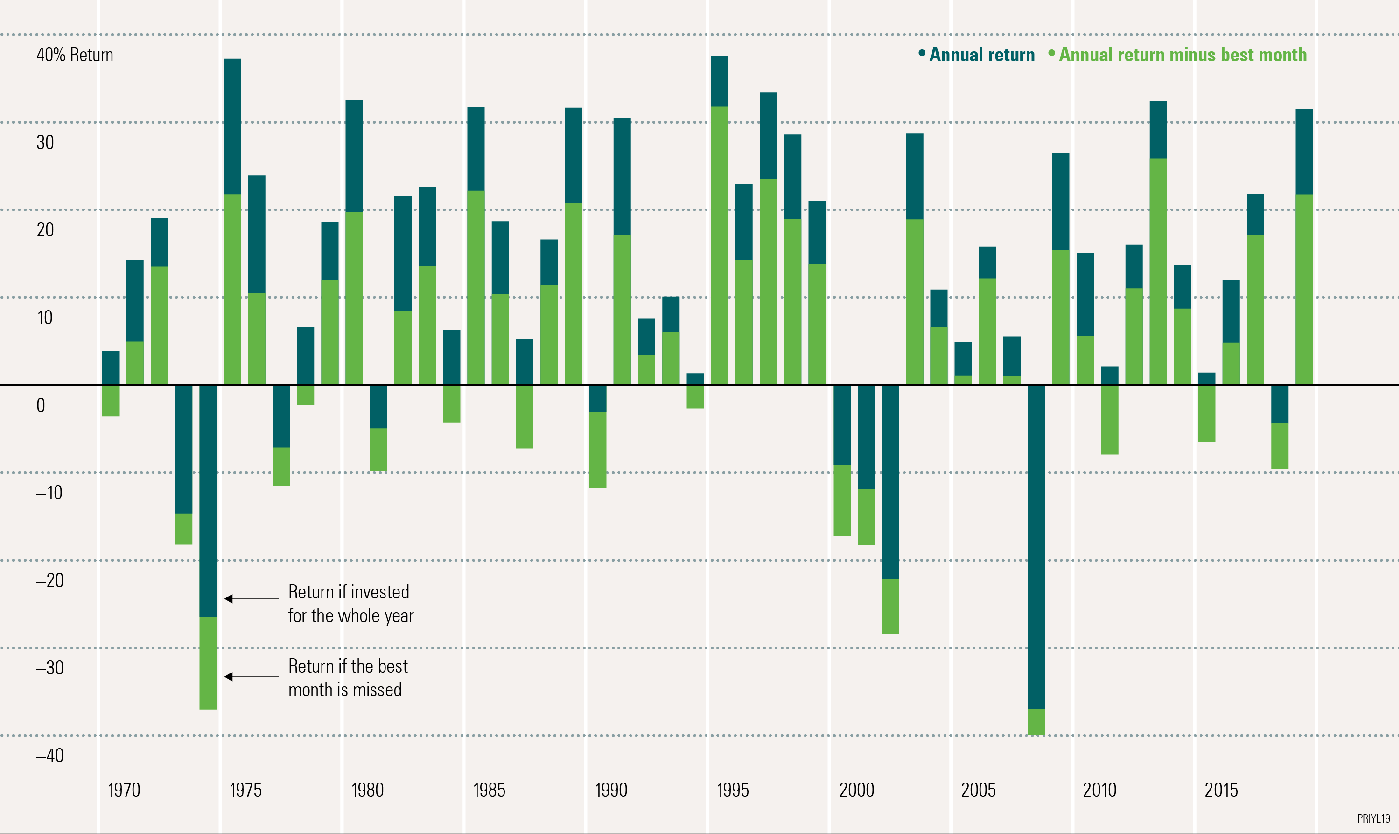
About the data
Stocks are represented by the Ibbotson® Large Company Stock Index. An investment cannot be made directly in an index. The data assumes reinvestment of income and does not account for taxes or transaction costs.
Past performance is no guarantee of future results. This is for illustrative purposes only and not indicative of any investment. An investment cannot be made directly in an index. © Morningstar 2020. All Rights Reserved.
- Investors who attempt to time the market run the risk of missing periods of exceptional returns. This practice may have a negative effect on a sound investment strategy.
- This image illustrates the risk of attempting to time the stock market by showing the effects of missing the one best month on an annual return.
- Missing the one best month during a year drastically reduced returns. During years when returns were already negative, the effect of missing the best month only exaggerated the loss for the year. In seven of the 49 years shown—1970, 1978, 1984, 1987, 1994, 2011, and 2015—otherwise positive returns would have been dragged into negative territory by missing the best month.
- Although successful market-timing may improve portfolio performance, it is very difficult to time the market consistently. In addition, unsuccessful market-timing can lead to a significant opportunity loss.
- Returns and principal invested in stocks are not guaranteed, and stocks have been more volatile than other asset classes. Holding a portfolio of securities for the long term does not ensure a profitable outcome and investing in securities always involves risk of loss.
The Cost of Market-Timing
The Risk of Missing the Best Days in the Market, 2000-2019
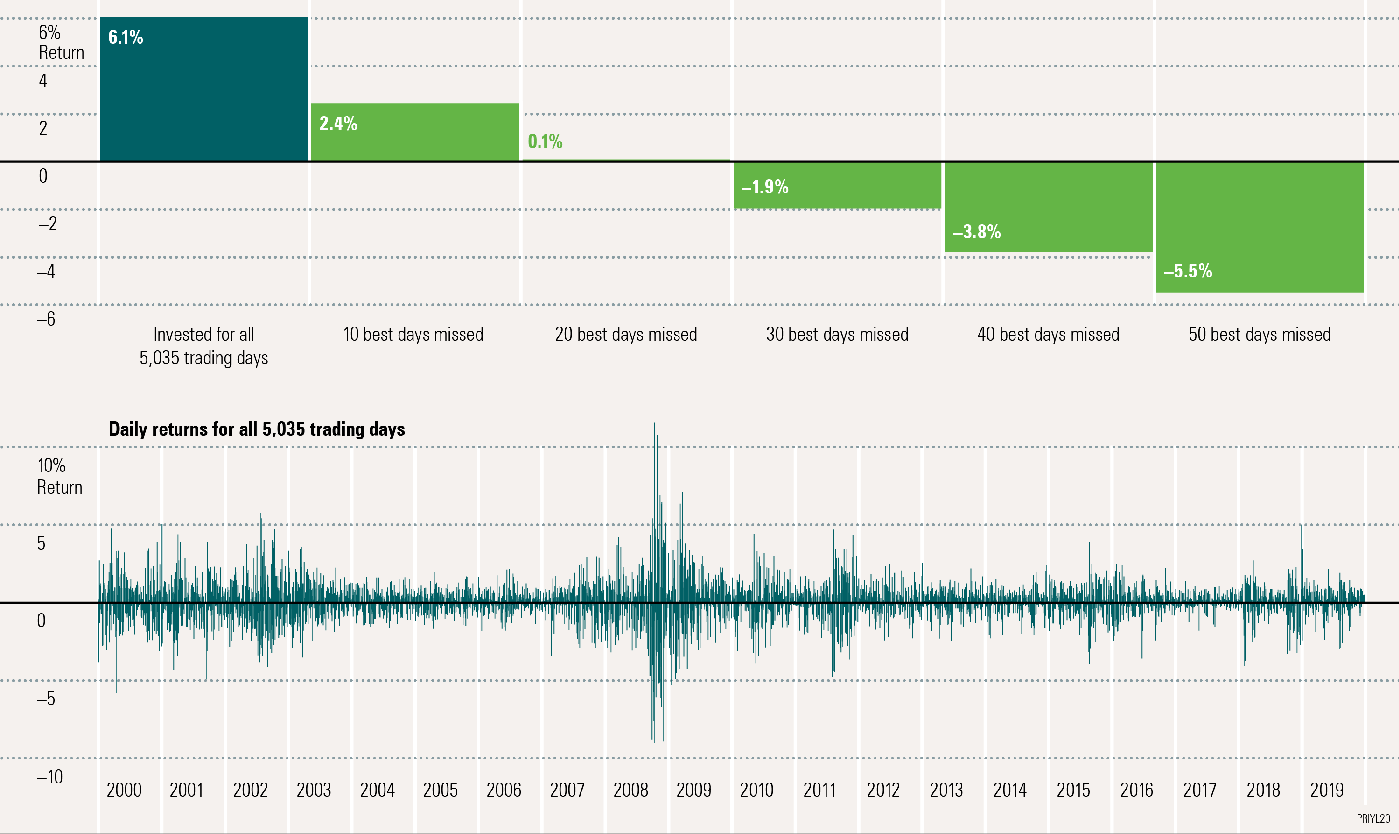
About the data
Stocks in this example are represented by the Ibbotson® Large Company Stock Index. An investment cannot be made directly in an index. The data assumes reinvestment of income and does not account for taxes or transaction costs.
Past performance is no guarantee of future results. This is for illustrative purposes only and not indicative of any investment. An investment cannot be made directly in an index. © Morningstar 2020. All Rights Reserved.
- Investors who attempt to time the market run the risk of missing periods of exceptional returns, leading to significant adverse effects on the ending value of a portfolio. This top graph illustrates the risk of attempting to time the stock market over the past 20 years by showing the returns investors would have achieved if they had missed some of the best days in the market. The bottom graph illustrates the daily returns for all 5,035 trading days.
- Investors who stayed in the market for all 5,035 trading days achieved a compound annual return of 6.1%. However, that same investment would have returned 2.4% had it missed only the 10 best days of stock returns. Further, missing the 50 best days would have produced a loss of 5.5%. Although the market has exhibited tremendous volatility on a daily basis, over the long term, stock investors who stayed the course were rewarded accordingly.
- The appeal of market-timing is obvious—improving portfolio returns by avoiding periods of poor performance. However, timing the market consistently is extremely difficult. And unsuccessful market-timing (the more likely result) can lead to a significant opportunity loss.
- Returns and principal invested in stocks are not guaranteed, and stocks have been more volatile than other asset classes. Holding a portfolio of securities for the long term does not ensure a profitable outcome and investing in securities always involves risk of loss.
Reduction of Risk Over Time
1926-2019
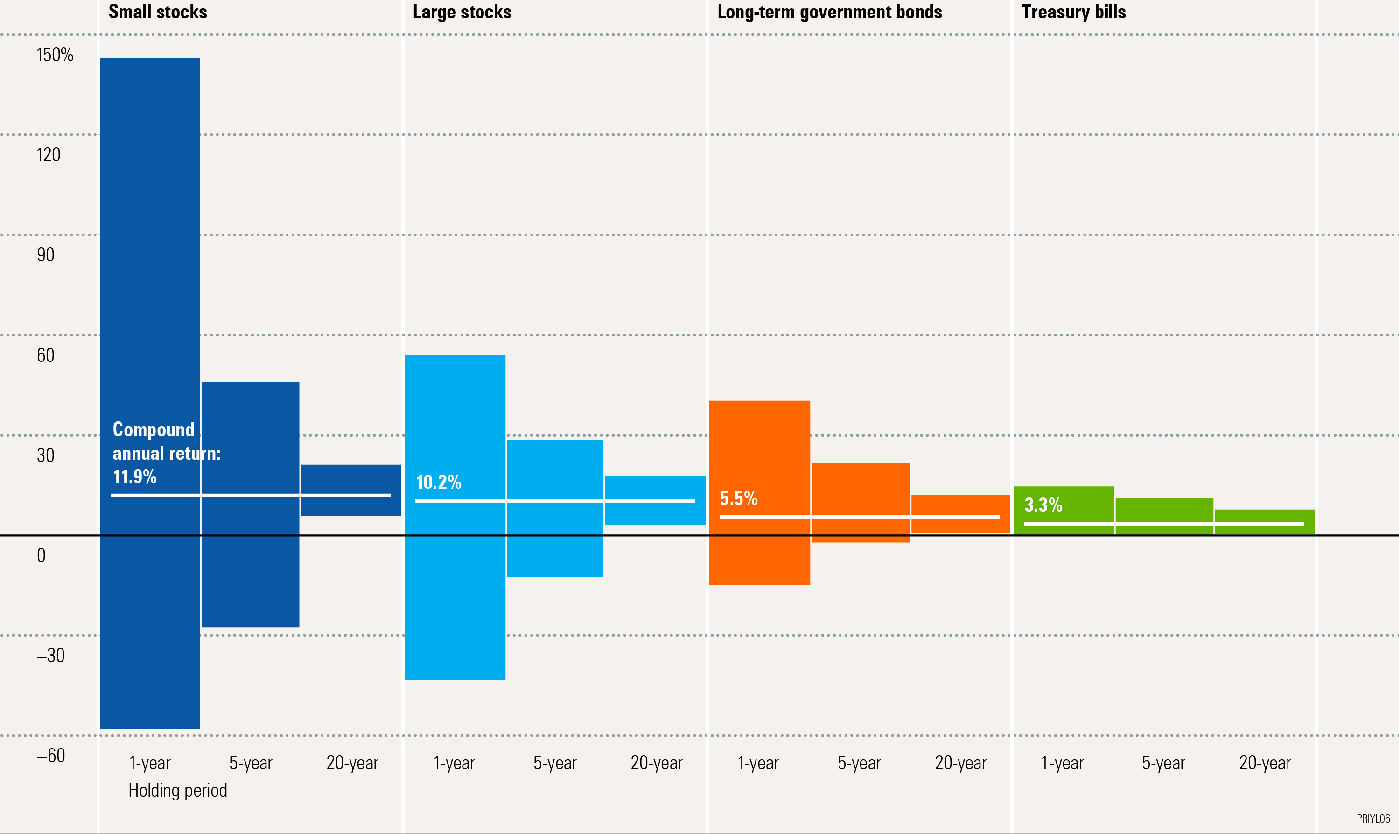
About the data
Small stocks are represented by the Ibbotson® Small Company Stock Index. Large stocks are represented by the Ibbotson® Large Company Stock Index. Government bonds are represented by the 20-year U.S. government bond, and Treasury bills by the 30-day U.S. Treasury bill. An investment cannot be made directly in an index. The data assumes reinvestment of all income and does not account for taxes or transaction costs.
Past performance is no guarantee of future results. Each bar shows the range of compound annual returns for each asset class over the 1926–2019 period. This is for illustrative purposes only and not indicative of any investment. An investment cannot be made directly in an index. © Morningstar 2020. All Rights Reserved.
- One of the main factors you should consider when investing is the amount of risk, or volatility, that you are prepared to assume. However, recognise that the range of returns appears less volatile with longer holding periods.
- Over the long term, periods of high returns tend to offset periods of low returns. With the passage of time, these offsetting periods result in the dispersion of returns gravitating or converging toward the average. In other words, while returns may fluctuate widely from year to year, holding the asset for longer periods of time results in apparent decreased volatility.
- This graph illustrates the range of compound annual returns for stocks, bonds, and cash over one-, five-, and 20- year holding periods. On an annual basis since 1926, the returns of large-company stocks have ranged from a high of 54% to a low of negative 43.3%. For longer holding periods of five or 20 years, however, the picture changes. The average returns range from 28.6% to negative 12.5% over five-year periods and between 17.9% and 3.1% over 20-year periods. During the worst 20-year holding period for stocks since 1926, stocks still posted a positive 20-year compound annual return. However, keep in mind that holding stocks for the long term does not ensure a profitable outcome and that investing in stocks always involves risk, including the possibility of losing the entire investment.
- Although stockholders can expect more short-term volatility, the risk of holding stocks appears to lessen with time.
- Government bonds and Treasury bills are guaranteed by the full faith and credit of the U.S. government as to the timely payment of principal and interest, while stocks are not guaranteed and have been more volatile than the other asset classes. Furthermore, small-company stocks are more volatile than large-company stocks and are subject to significant price fluctuations and business risks and are thinly traded.
Returns Before and After Inflation
1926-2019
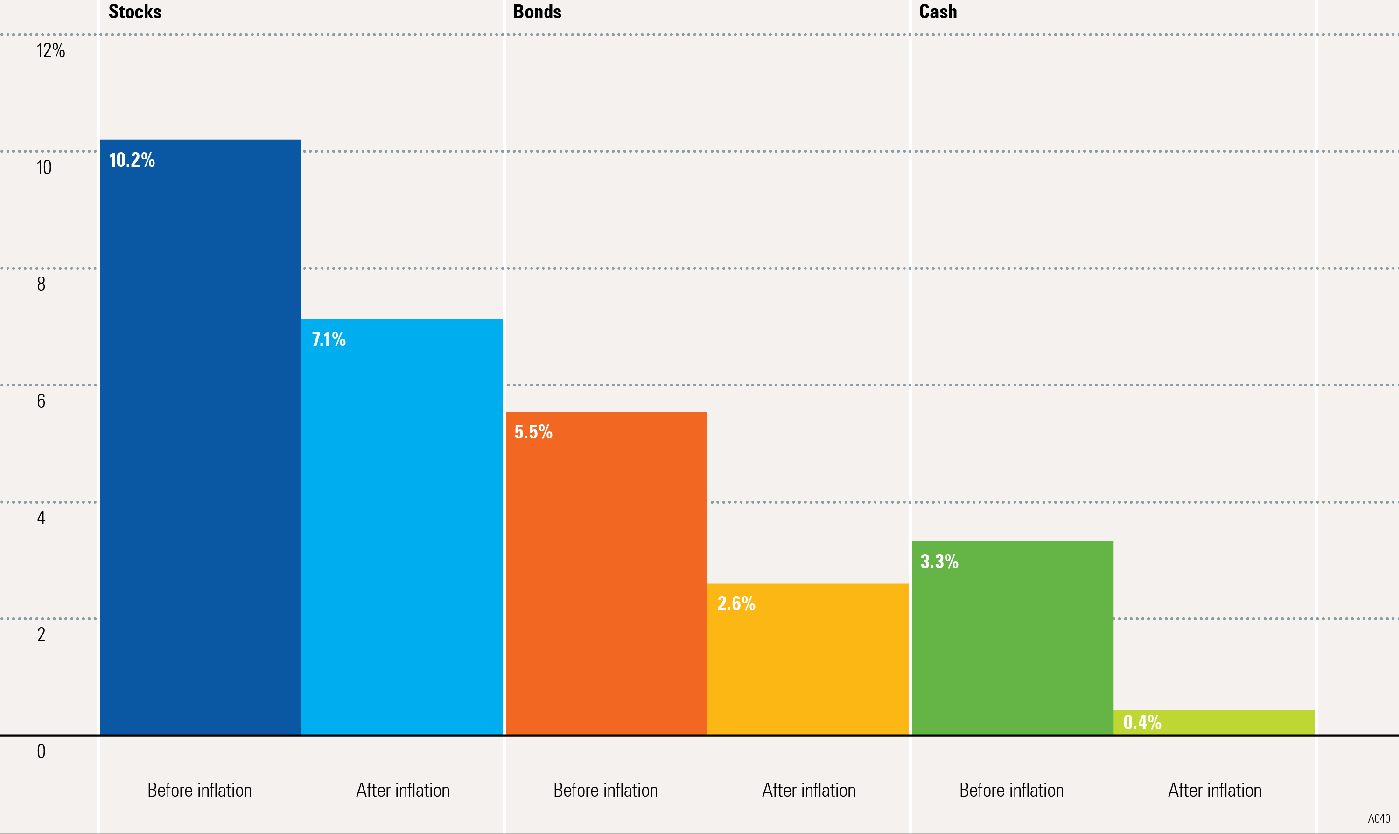
About the data
Stocks are represented by the Ibbotson® Large Company Stock Index. Bonds are represented by the 20-year U.S. government bond, cash by the U.S. 30-day Treasury bill, and inflation by the Consumer Price Index. An investment cannot be made directly in an index.
Past performance is no guarantee of future results. Assumes reinvestment of income and no transaction costs or taxes. This is for illustrative purposes only and not indicative of any investment. An investment cannot be made directly in an index. © Morningstar 2020. All Rights Reserved.
- Comparing the returns of different asset classes both before and after inflation is helpful in understanding why it is so important to consider inflation when making long-term investment decisions.
- This image illustrates the compound annual returns of three asset classes before and after considering the effects of inflation. Since 1926, inflation has dramatically reduced the returns of stocks, bonds, and cash.
- The first bars for each asset class represent the nominal, or unadjusted, returns of each asset class. Nominal returns do not consider inflation. It is often the rate of return that you might think of when discussing the return on investment.
- The second bars illustrate the real, or inflation-adjusted, returns of each asset class. Real returns reflect purchasing power. For example, if you invested in cash equivalents in 1926, the money you earned over the period would provide you with very little purchasing power today.
- Notice that cash and bonds, after adjusting for inflation, barely kept pace with the rise in prices over the time period analysed.
- Government bonds and Treasury bills are guaranteed by the full faith and credit of the U.S. government as to the timely payment of principal and interest, while stocks are not guaranteed and have been more volatile than the other asset classes.
Can You Stay on Track?
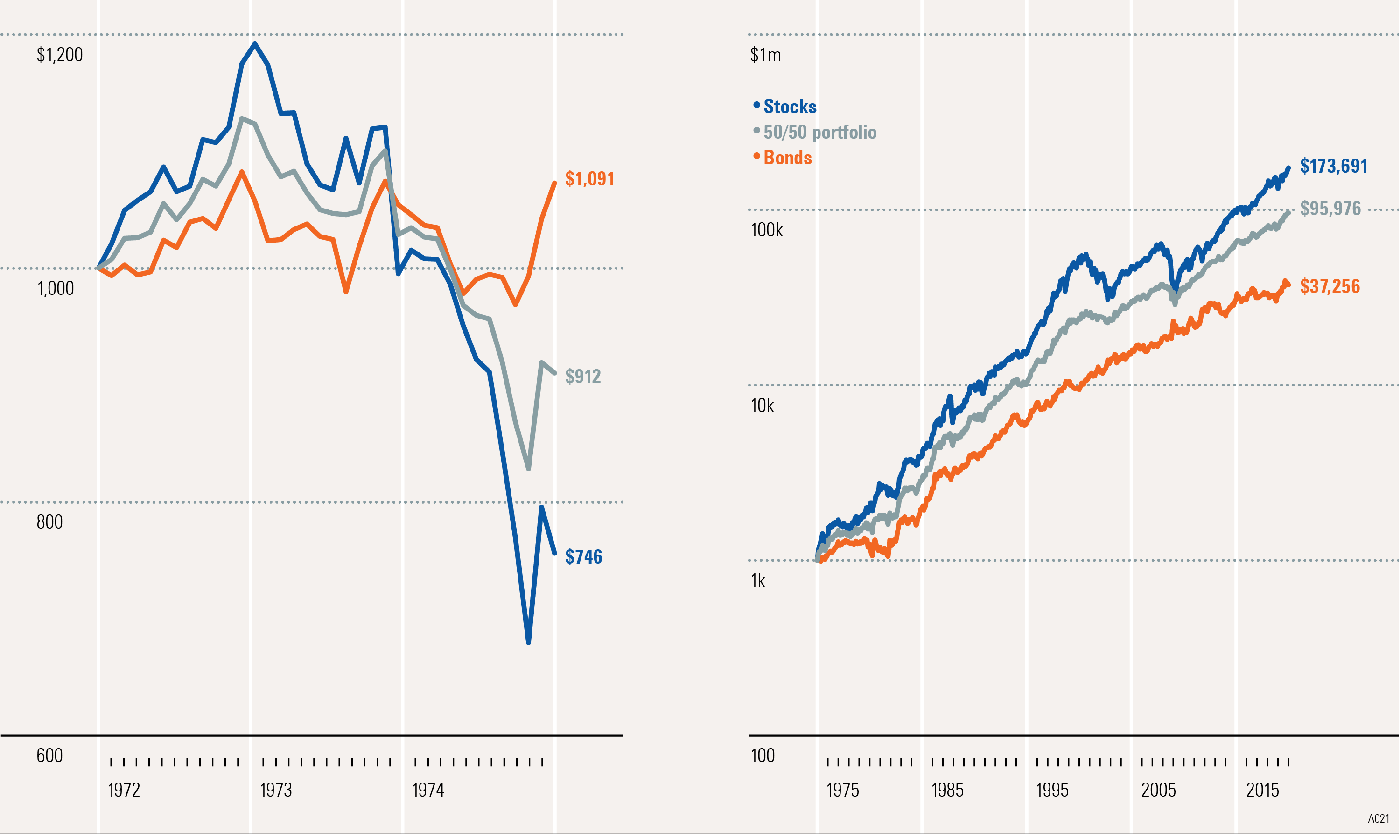
About the data
Stocks are represented by the Ibbotson® Large Company Stock Index. Bonds are represented by the 20-year U.S. government bond. An investment cannot be made directly in an index. The data assumes reinvestment of income and does not account for taxes or transaction costs.
Past performance is no guarantee of future results. This is for illustrative purposes only and not indicative of any investment. An investment cannot be made directly in an index. © Morningstar 2020. All Rights Reserved.
- It’s easy to follow a long-term strategy during good times; the hard part is sticking with it through the bad times.
- What should you do if you are a long-term investor sitting in the midst of a bear market? If you are holding a well-diversified portfolio, the answer is simple—continue to stay the course. This image illustrates the hypothetical growth of stocks, bonds, and an equally diversified portfolio over short- and long-term periods.
- The graph on the left illustrates the performance of the assets during one of the worst three-year time periods in recent history. As illustrated, the significance of holding a diversified portfolio is most apparent in a bear market. Although the diversified portfolio still lost more than bonds in the short run, it did not withstand as great a loss as stocks. Over the long term, however, the picture changes.
- The graph on the right illustrates the performance of the assets over the long run, from the beginning of 1975 to year-end 2019. By continuing to hold the all-stock portfolio past 1975 (over the full time period), one would have experienced the highest ending wealth value of the assets shown. However, it is important to understand that this greater wealth was achieved with considerable volatility, which is indicated in the short-term period (the left chart).
- While the more volatile single asset is likely to outperform the less volatile diversified portfolio over the long run, the main point to understand is that by maintaining a well-diversified portfolio, you are managing risk, not trying to escape it.
- Keep in mind that diversification does not eliminate the risk of investment losses. Government bonds and Treasury bills are guaranteed by the full faith and credit of the U.S. government as to the timely payment of principal and interest, while stocks are not guaranteed and have been more volatile than bonds.
Morningstar’s monthly Best Stock Ideas highlights high-quality Australian and New Zealand companies, which are currently trading at discounts to our assessed fair values. The ideas, chosen from our coverage of nearly 200 companies, are intended to have broad application in a variety of equity strategies, but individuals should consider their personal investment goals and positioning before investing. We provide brief descriptions of each best idea in this report and encourage investors to read our most recent stock reports for a more detailed appraisal.
This month we have 13 companies in our Best Stock Ideas list. Since last month, we have added Bingo Industries and removed Bapcor and Spark Infrastructure.
We have added Bingo Industries to our Best Ideas List. Bingo Industries screens attractively, trading at a material discount to our fair value estimate. The economic shock delivered by the coronavirus pandemic represents a cyclical headwind for Bingo with Australian construction activity set to contract significantly in the near term. Nonetheless, we see a bright future for the narrow-moat name with strong earnings growth anticipated to return from 2022 as construction activity recovers. Importantly, we view Bingo’s balance sheet as well-positioned to withstand the gloomy near-term macroeconomic environment.
We have removed Bapcor from our Best Ideas List with shares rallying 8% since the narrow-moat company’s addition in June 2020. While shares in Bapcor continue to trade at a discount to our AUD 6.60 fair value estimate, the uplift in price has reduced the margin of safety and we see more attractive opportunities elsewhere. We continue to expect Bapcor’s earnings will prove resilient over the long term. In our view, demand for automotive spare parts—required for routine maintenance and repair of vehicles—is broadly driven by the increasing pool of vehicles and less affected by changes in discretionary income and consumer confidence. We estimate there are currently around 19 million passenger vehicles in Australia, with an average age around 10 years, and we expect the number of registered vehicles to continue growing at a low-single-digit compound annual rate over the next decade, marginally outpacing population growth.
To download our full Best Stock Ideas report for August 2020, please log in to Adviser Research Centre or take a two week free trial: