
In Forecast 2022 published on 16 December 2021, I wrote, “As 2022 dawns, it’s time for the Federal Reserve (the Fed) to stop protecting equities markets and encouraging risk taking. Elevated inflation is a likely passenger for most of 2022 and negative real interest rates should be reversed as a priority.”
Central banks are now talking tough. After months behind the ball belated heavy-handed action is raising fears of a recession next year. A growing body of opinion believes rates may need to be cut again in 2023 as economic growth slides.
Bringing inflation under control will probably require a meaningful contraction in economic activity. The nightmare scenario would be stagflation, where central banks do not kill growth, but inflation escapes unscathed. Either way, the near-term outlook for equity markets is not overly encouraging. Rallies are likely, reflecting mood swings but there is no room for complacency.
One year ago, in Forecast 2021–22 published on 8 July 2021 I said “So far, 2021 has been a record-breaking year on many fronts. This in part reflects several factors, chief among them the economic recovery and optimism it will continue. Then there is increasing global vaccination, conviction current strong inflationary pressures will prove transitory and hopes central banks will not be distracted from achieving long-held targets around prices and employment and therefore continue with very accommodative monetary settings for some time.”
But behold, Omicron and Russia’s invasion of Ukraine and zero COVID tolerance in China have turned financial markets upside down in the six months to 30 June 2022.
Bond market normalisation questions risk asset valuations
International bond markets are finally free from the shackles of unprecedented central bank manipulation. Over US$25 trillion was outlaid by global central banks in quantitative easing purchases. That collective activity pushed bond yields to historic lows, with over US$15 trillion worth of government bonds bearing a negative yield. Bond markets are now in the process of normalising and regaining their mandate to price securities freely and without intimidation.
While surging inflation shows up in sharply rising bond yields, the absence of central bank intervention has accelerated the rise. The short end of the yield curve reflects inflationary pressures, while the longer end is weighed by fears about future economic growth. Currently, the US 5/10-year spread is inverted and there have been instances where the 5/30-year also inverted, which is not a positive signal.
Equities long benefited from the suppression of bond yields. Their normalisation will bring risk asset valuations into question. It will also affect capitalisation rates used in commercial real estate valuations.
The increasing likelihood of a recession in 2023 will also impact corporate cash flows and earnings. The negative jaws of rising discount rates and subdued cash flow growth need to be acknowledged.
Central banks still hold centre stage
While equity markets react instantly to central bank speak and the utterances of their mouthpieces, the bond market is displaying more discipline and focus. Rightly and perhaps belatedly, the price stability mandate has captured the full attention of central banks. The inflation genie is out of the bottle and is likely to prove difficult ensnare. Energy prices are likely to remain elevated, proving to be an ongoing nuisance as their tentacles reach into every crack and crevice in the economy.
Steely resolve is required. The length of the tightening cycle will determine the platform from which the next easing is launched. Should the US Federal Reserve (the Fed) push the cash rate to 3% and shrink its balance sheet by the planned US$1.3 trillion by September 2023, it will be in an historically weak position. The long-term average federal funds rate is near 5%. The balance sheet will still be a very bloated US$7.6 trillion. There will be still far too much liquidity in the financial system at the close of 2023. One hopes unconventional monetary policy is not required in future. The performance of the Fed and the RBA over the past year does not inspire confidence in getting the job done and nervousness and uncertainty are likely to persist.
Based on 20 June closing prices, over half of Morningstar’s Australia and New Zealand coverage was either 4 or 5-star rated. Excluding the March 2020 COVID-19 crash, this is the highest proportion in a decade.
Our fair value estimates do not incorporate a recession and the recent market selloff caused a significant improvement in price/fair value estimate ratios to 0.85 as at 20 June from 1.03 at the start of the quarter—the cheapest the market has been since May 2020.
Investing is a journey and, long-term investing is a long one. Ensure risk tolerance settings are in line with your overall investment strategy. Have cash available and be prepared to ride out market corrections. I do not believe the bear market is near complete. The first leg is probably over. Another two downward legs could follow.
Exhibit 1: Markets snapshot 30 June 2022
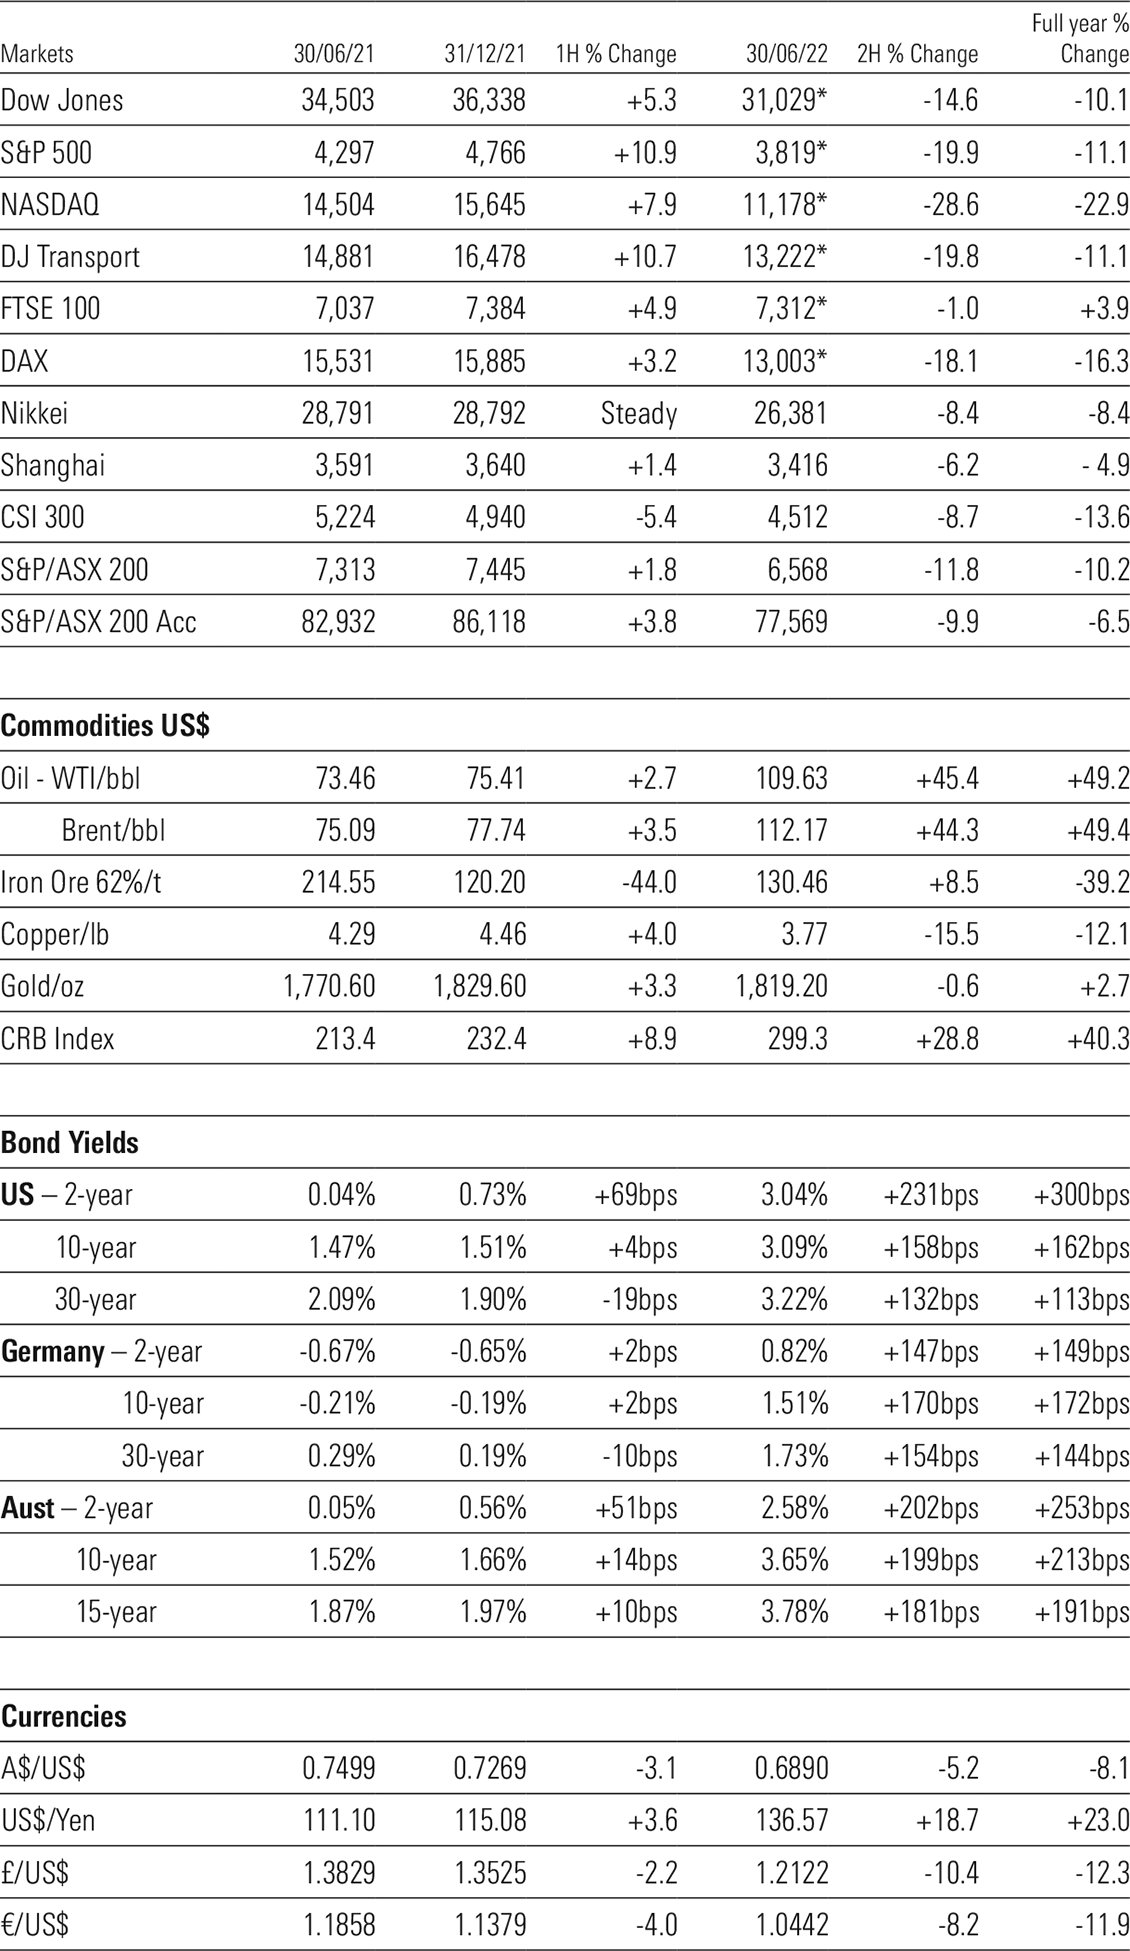
*29/06/22
Source: Morningstar
Exhibit 2: Global performance
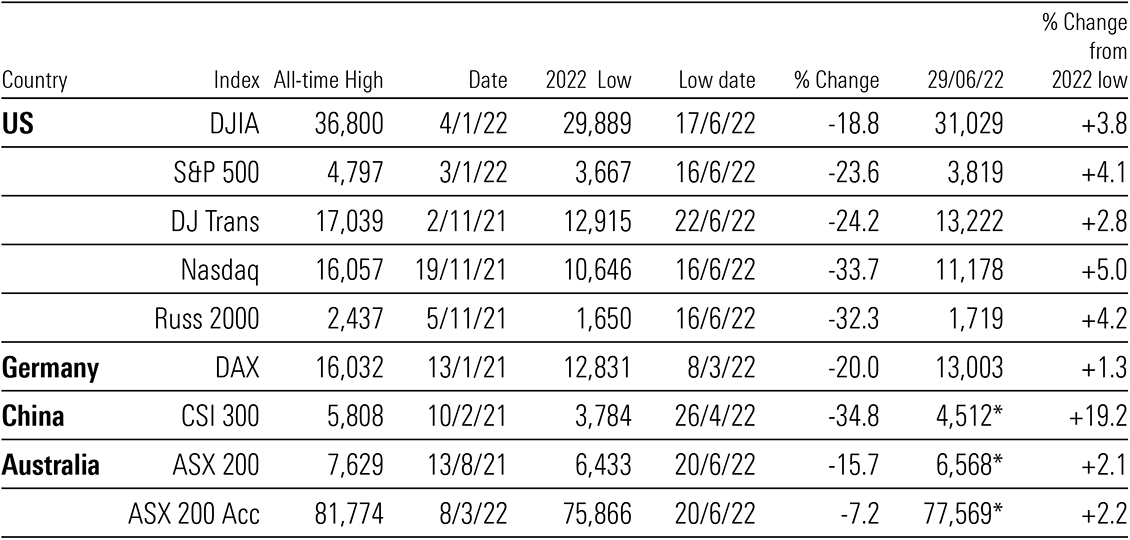
* 30/06/22
Source: Morningstar
Exhibit 3: Spot the outlier
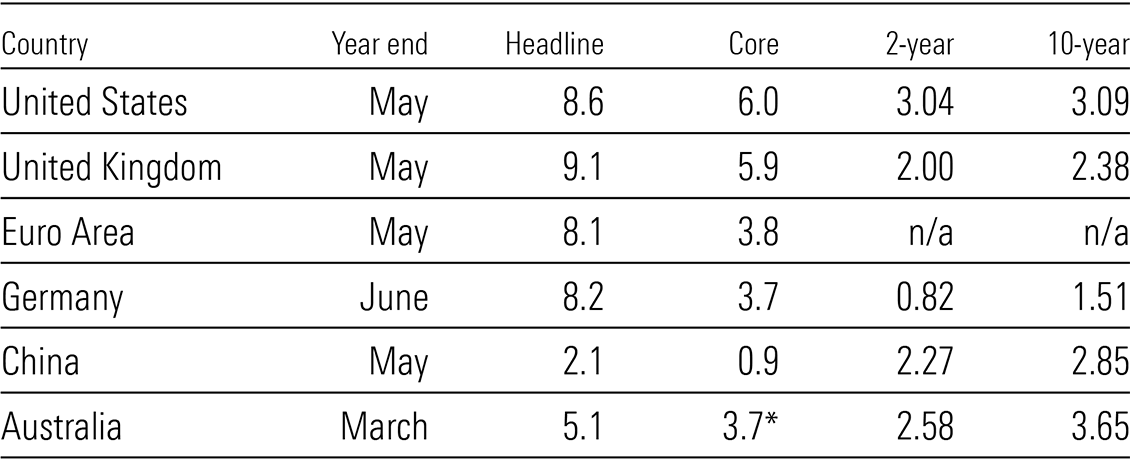
* Trimmed mean
Source: Morningstar
Australia
Be prepared, as the good times fade
In Forecast 2022, I suggested “a strong recovery in 2022 is likely to be front-end loaded.” Nothing has changed. In the backend of 2022 and 2023 economic growth is likely to fade, although the timing and magnitude is unpredictable. Much will depend on the success or otherwise of the central bank campaign against inflation. First to the facts and figures.
GDP grew by 0.8% in 1Q22 compared to 4Q21, marginally above consensus of 0.7% and taking annual growth to 3.3%. After the re-opening spike of 3.6% in 4Q21, the performance in the March quarter was always going to be subdued as the Omicron outbreak led to further restrictions. Severe weather in NSW and Queensland disrupted supply chains and output, but the overall performance was relatively solid.
The main contributors included domestic final demand adding 1.6%, underpinned by a 1.5% increase in household consumption. Government expenditure added 0.6%, driven by increased health-related spending. The federal and state response to NSW and Queensland floods also contributed. A meaningful increase in inventories, reflecting the arrival of delayed shipments and business replenishment, made an outsized contribution of 1% and could act as a drag in 2Q22. The main detractor was net exports which cut 1.7% off the reading, with imports recording the strongest rise in 12 years, boosted by a 32% lift in passenger vehicles and a 30% jump in household electrical items. Exports fell by 0.9% as production was curtailed due wet to weather on the east coast.
The household savings ratio declined from 13.4% in 4Q21 to 11.4% as household spending grew faster than gross disposable income. Insurance claims related to floods increased non-labour income by $2.8bn, adding 0.8% to the ratio. This will reverse as households repair and rebuild in the future. Labour shortages will impact the speed of the rebuilding recovery.
Past emergency settings need to be junked to address another pressing emergency
In Forecast 2022 I wrote that rosy growth forecasts “could be challenging as consumer behaviour moves to a more conservative setting.” Westpac’s chief economist Bill Evans forecast GDP growth of 6.4% this year looks increasingly out of reach.
The outbreak of global inflation remains the major issue facing all economies. Central banks reacted differently depending on how urgent they believed the issue required addressing. Unfortunately, the Reserve Bank (RBA) has been a laggard after spending too much time in the transitory camp. Quarterly inflation readings make management of a dynamic situation more difficult, but the bank’s board should have begun tightening much earlier. The RBA admitted inflation “has picked up significantly and by more than expected” and previous forecasts were wrong.
The March quarter Consumer Price Index (CPI) rose 2.1% taking the annual rate to 5.1%. The June quarter reading will be released on 27 July and is likely to remain elevated. While the oil price has retreated, the energy suite including gas, transport fuels and electricity have not. Price increases continue to reverberate throughout the economy and could push the headline rate well above the March quarter reading. We are in rarefied territory and the possibility of a hard landing has increased.
Exhibit 4: Australia inflation rate (%)
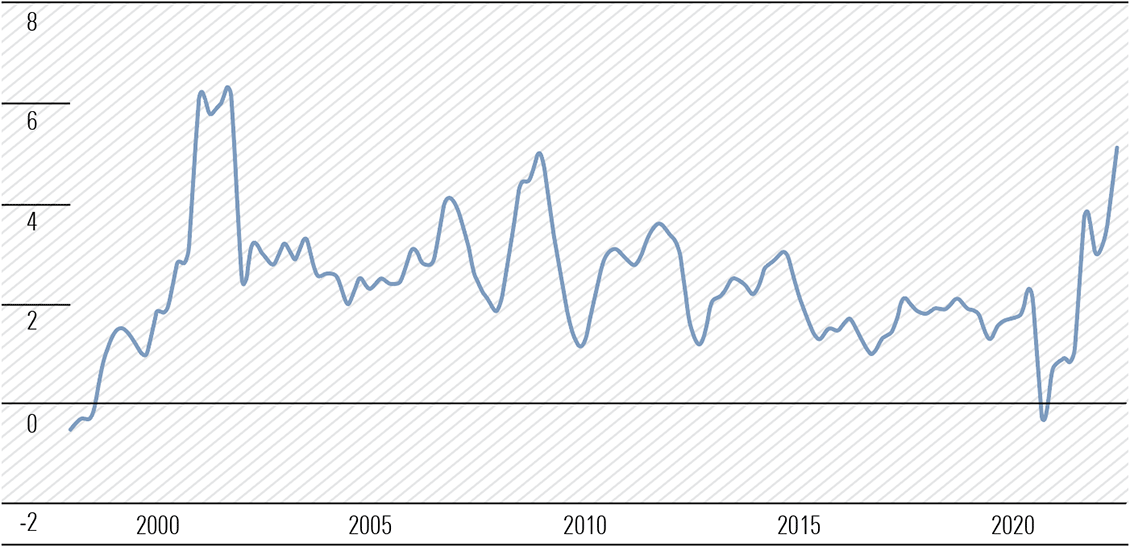
Source: tradingeconomics.com, Australian Bureau of Statistics
As inflation is politicised as a cost-of-living issue, the forces of cost-push inflation have emerged. This occurs when wages and materials prices surge. These costs are passed on to consumers in the form of higher prices. Wages are playing catch up with inflation and now the two major cost components across businesses—wages and energy—are in ascendancy, as households deal with surging food inflation. The combination of demand-pull and cost-push inflation is an explosive cocktail.
The RBA needs to act with steely resolve
Australia’s current official cash rate is 0.85% and still in emergency-setting territory. But there is an emergency of a different kind unfolding as inflation remains unchecked at present. The cash rate should be increased to 1.35% on 5 July. RBA governor Philip Lowe estimates the headline inflation rate peaking around 7% by year end and then fall back through 2023. He also suggests it is reasonable the official cash rate gets to 2.5% “at some point”. This would equate to the mid-point of the RBA’s inflation target, and so in inflation-adjusted terms is a real interest rate of zero. If he thinks that will suffice, he is living in La La land.
Should inflation get to 7%, an official cash rate of at least 3.5% will be needed to stem the surge. History suggests it should be much higher to be effective. Mortgage rates well above 5% are likely and the narrow path to a soft landing will become more difficult to traverse.
Rising interest rates will dampen consumer demand as inflation erodes household income. Higher mortgage rates will cool housing prices and make consumers feel poorer and less inclined to spend. While Lowe has espoused the resilience of the economy, the health of household and business balance sheets and the strength of the labour market, there are uncertainties clouding the economic landscape. “One source of uncertainty about the economic outlook is how household spending evolves, given the increasing pressure on Australian households’ budgets from higher inflation.” Household savings are not evenly distributed, so $250bn squirrelled away during the pandemic will not be as supportive of consumption as many expect.
Rising mortgage rates combined with “world-beating” levels of household debt will have the attention of the RBA. Mortgage loans taken out with a loan-to-value ratio above 75% in the past 18 months are of concern as housing prices ease and the momentum could accelerate. While net household wealth is at a record, most of that wealth is tied up in one asset—the home—the focus will be on the serviceability of the mortgage. Disposable income is key and consumption likely to be trimmed with corresponding knock-on effects in the economy.
With the unemployment rate at a 48-year low of 3.9% and the participation rate at a record peak of 66.7%, the full employment flag is flying. Closed international borders for over two and a half years cut the number foreign workers, international students, and backpackers to near zero. With the absence of over 300,000 workers, vacancies are reported to exceed 400,000. This situation is unlikely to change in the near term. Meanwhile, absenteeism remains a problem for businesses and productivity is suffering.
The trade surplus is likely to remain elevated, although retreat from April’s $10.5bn. Lower iron ore prices will take the shine off export values although buoyant LNG and thermal and metallurgical coal prices will offer support. Imports should recede from the March quarter peak. Increased outbound travel will be a drag on net exports as will the return of international students which will boost tourism and education imports.
United States
Is housing the canary in the coalmine for a “hard landing”?
Household consumption is the major driver of economic growth in developed economies. It is also the engine of corporate sector profitability. The housing or residential sector is an important bellwether for how confident and cashed up individuals are likely to be. It is a cyclical interest rate-sensitive animal that sniffs the winds of change and tends to be a useful, though not infallible, lead indicator to future economic activity. Historically, it leads contractions and expansions in the general economy by around 12 months.
Right now, the US housing industry is flashing amber. All key metrics indicate a topping out and downward momentum is building. Clearly, the rise in the 30-year bond yield and the associated long-term mortgage rate is affecting activity along with rising building material prices, excluding lumber.
Building Permits—fell 7% month-on-month (m/m) in May to 1.695 million and the lowest reading since September 2021.
Housing Starts –fell 14.4% m/m in May to an annualised 1.55 million. April’s 1.8 million was the strongest read since May 2006. Single-family starts down 9.2% to 1.051 million, with the volatile buildings with five or more units slumped 26.8% to 469,000.
Existing Home Sales—fell 3.4% m/m in May to seasonally adjusted annual rate of 5.41 million, the lowest since June 2020.
New Home Sales—rose 10.7% m/m in May to a seasonally adjusted annual rate of 696,000. May rebound surprised, but the overall trend remains negative. There is 7.7 months of supply in inventory.
Pending Home Sales—rose 0.7% in May from April, breaking an 11 consecutive monthly streak of falls as surging mortgage rates eased. Pending sales are based on signed contracts for single-family homes and are 13% below May 2021 levels.
National Association of Home Builders (NAHB) Market Index—fell for the 6th consecutive month in June to 67 from 69 in May and 77 in April and below pre-pandemic levels.
Exhibit 5: United States Nahb housing market index
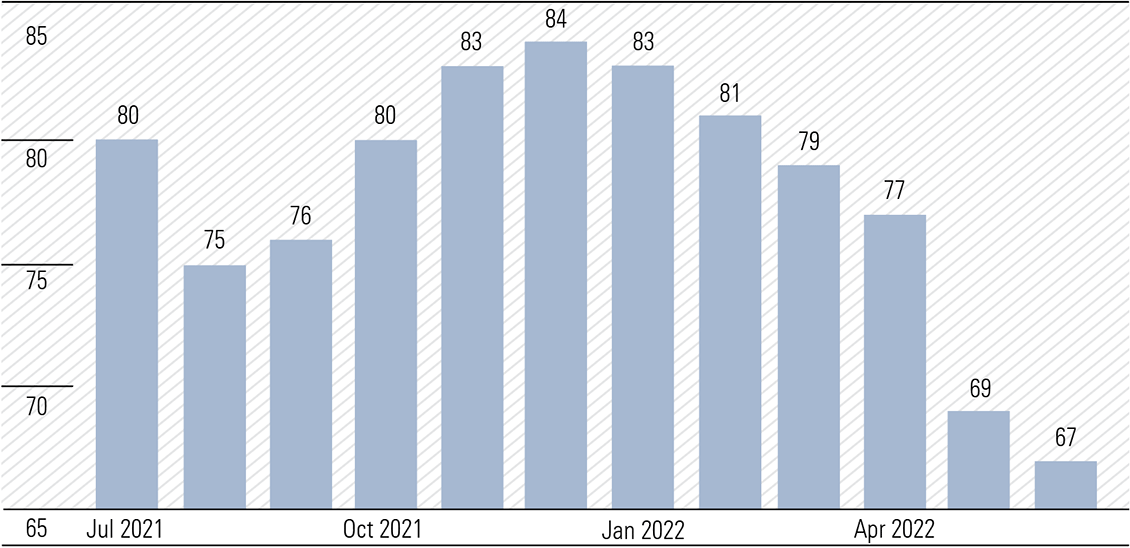
Source: tradingeconomics.com, National Association of Home Builders
Growth concerns and likely recession in 2023
Housing aside, surging inflation and The Fed’s belated response have dominated financial markets this year. The investor pendulum, which monitors mood swings, has focused on the level of aggression in monetary policy tightening. Risk-shy investors are hanging on to every comment from members of the Federal Open Market Committee (FMOC) after rounds of brutal sell offs in equity markets. Aggressive comments trigger declines and vice versa. The much-anticipated volatility has been extreme.
The slight downward revision in May’s final inflation expectations component of the University of Michigan’s Consumer Sentiment Index from the preliminary read of 3.3% on 10 June to 3.1% on 24 June triggered an immediate positive market response. Previously, Fed chairman Jerome Powell had alluded to the preliminary reading as relevant to a possible 75 basis point increase in rates at the 26-27 July FOMC meeting. The market now expects a more modest 50-point increase as fears were dampened.
However, there appears to be a shift from inflationary concerns to fears around future economic growth. The flattening of the bond curve, and in some instances inverted sections of the curve, particularly the 5/30-year negative spread, reflects the level of fear.
Retail sales
As fiscal stimulus handouts are phased out, mortgage rates surge and real wages decline, the heat has quickly come out of retail sales (Exhibit 6). A close friend living in Virginia sent me the following text last week—“I have no crystal ball for where the markets are headed. What I do sense is that the American consumer is about tapped out as increased energy costs have barreled (no pun intended) through every aspect of our economy. People’s wallets are lighter than a year ago and it is showing up at the cash registers.”
Exhibit 6: U.S. retail sales (%)
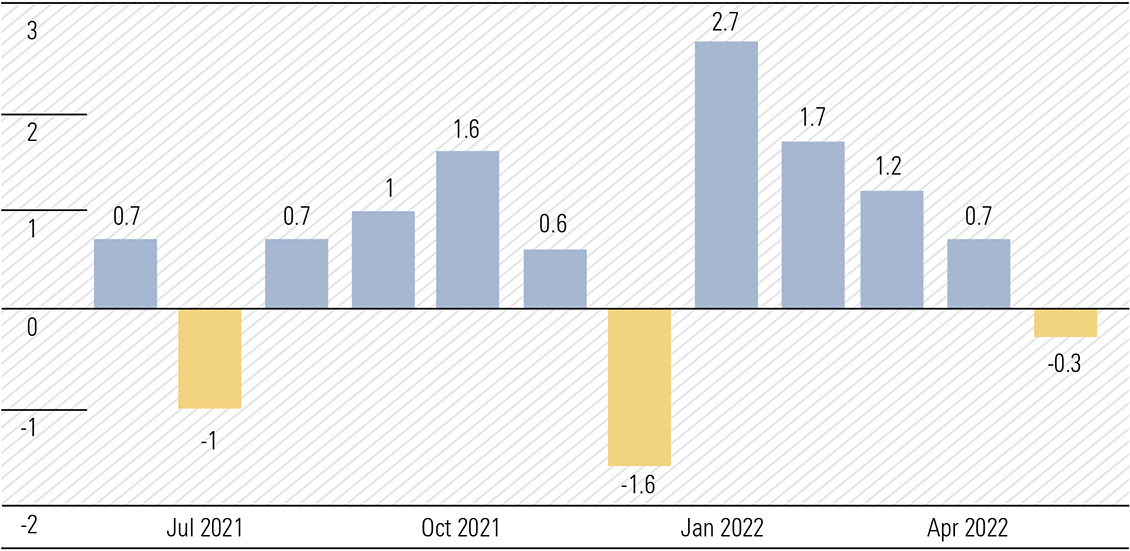
Source: tradingeconomics.com, U.S. Census Bureau
Inflation-adjusted or real retail sales would be even weaker and correspondingly volumes are lower. The disappointing guidance from large retailers including Target and Walmart, but upbeat reports from Dollar Tree and Dollar General reflects bargain-hunting Americans increasingly shopping at discounters as inflation savages the consumer dollar. Retail sales are another economic benchmark closely associated with the health of household finances and the wealth effect.
Some, including Powell believe the US$1-2 trillion in household savings will protect the economy from a recession. I am not so sure, as savings are not equally distributed across households and the wealth effect can evaporate as fast as it was created. Zero Hedge estimates 8.4 million Americans are currently behind on rent, and risk being evicted. I suspect they do not have any savings.
Bulls refer to the large pool of excess savings, as has Powell when saying “we have a good chance to have a soft or softish landing, or outcome” predicated on the belief “households and businesses are in very strong financial shape”. These savings were built during the pandemic from massive fiscal stimulus and lack of spending options as restrictions kept people homebound. But data reveals most savings are held by high-income households that also have the lowest marginal propensity to consume (MPC). The distribution of savings is distorted and the reliability on them is dangerous. The time-tested 80/20 rule probably applies—80% of the excess savings are held by 20% of households, the high-income bracket with the lowest MPC.
Most of the wealth created on Main Street by the rise in risk asset prices has come from the largest asset for most households—the house. Main Street is the biggest contributor to household consumption. US housing prices have increased by 15.4% in the year ended April, strengthening household balance sheets. But subsequent falls in equity and house prices will have the opposite effect, with a negative wealth effect now likely unfolding.
The US household savings rate fell to 4.4% in April from 6.2% in March, the lowest since September 2008.
Exhibit 7: United States personal savings rate
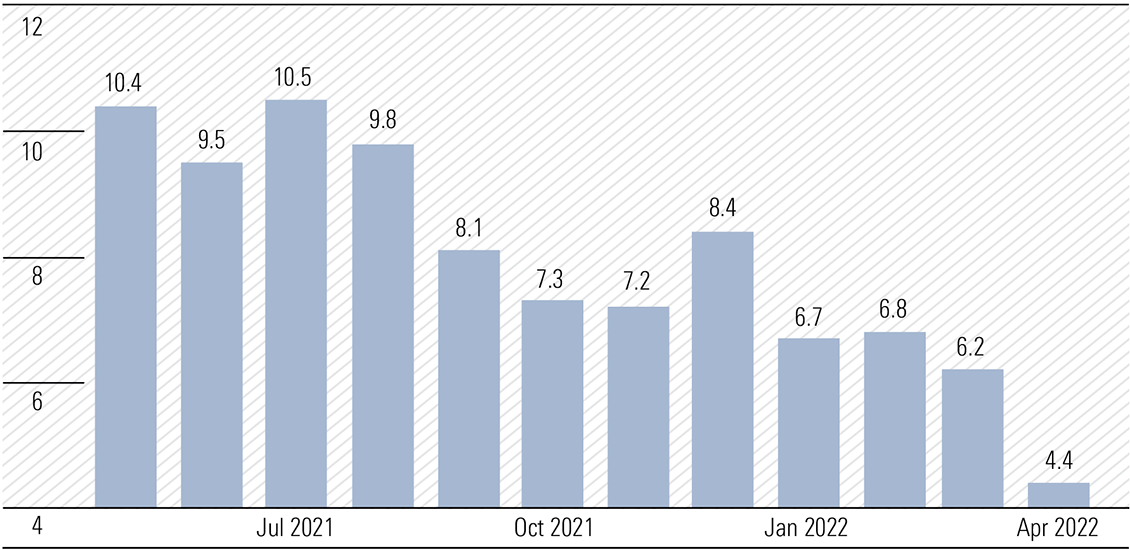
Source: tradingeconomics.com, U.S. Bureau of Economic Analysis
The Fed’s actions will likely determine the landing of the economy
Forecast 2022 “As 2022 dawns, it’s time for the Federal Reserve (the Fed) to stop protecting equities markets and encouraging risk taking. Elevated inflation is a likely passenger for most of 2022 and negative real interest rates should be reversed as a priority.”
After a seemingly lackadaisical performance over the past year, the Fed is rapidly trying to play catch up. While the markets endeavour to ‘price-in’ expected interest rate increases, the implications of balance sheet contraction is a more difficult pricing assignment.
Monetary policy has two components, conventional and unconventional, with the latter—the money printing—providing additional liquidity. The Fed’s balance sheet increased by just over US$1 trillion in the year to 18 May, with purchases still being undertaken to that date.
Exhibit 8: Fed assets* (trillion dollars, weekly)
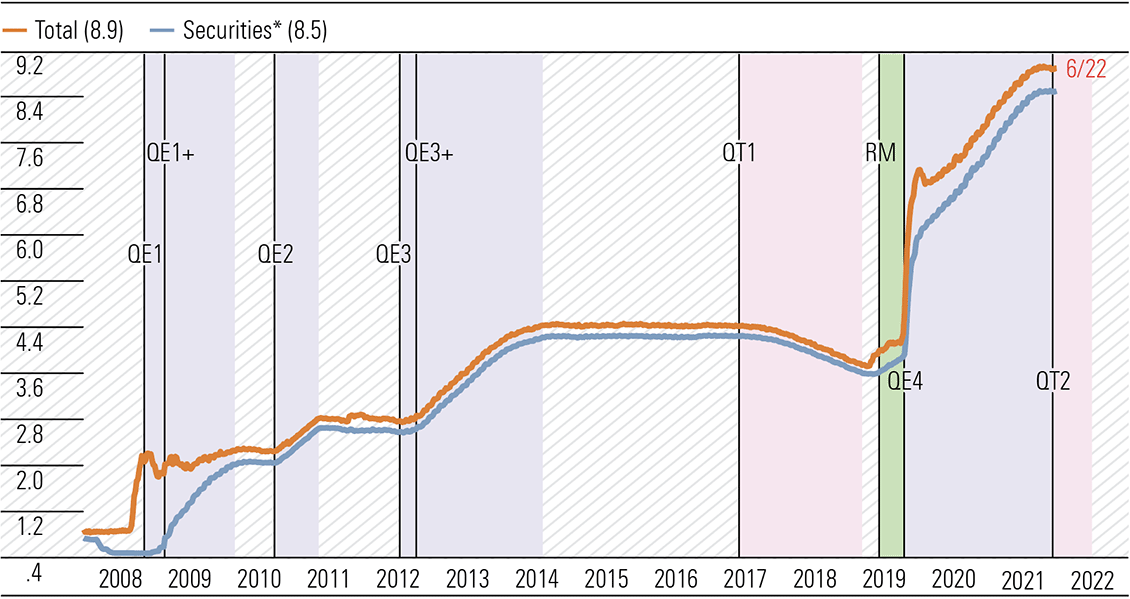
* Averages of daily figures for weeks ending Wednesday. Securities held by Fed include US Treasuries, Agency debt, and mortgage-backed securities. Note: QE1 (11/25/08-3/31/10) = $1.24tn in mortgage securities; expanded (3/16/09-3/31/10) = $300bn in Treasuries. QE2 (11/3/10-6/30/11) = $600bn in Treasuries. QE3 (9/13/12-10/29/14) = $40bn/month in mortgage securities (open ended); expanded (12/12/12-10/1/14) = $45bn/month in Treasuries. QT1 (10/1/17-7/31/19) = balance sheet pared by $675bn. RM (11/1/19-3/15/20) = reserve management, $60bn/month in Treasury bills. QE4 (3/16/20-infinity). QT2 = balance sheet pared by $95 billion per month. Source: Federal Reserve Board.
Source: yardeni.com
Its withdrawal, which is now underway at a monthly rate of US$47.5bn and which doubles from September, will reduce the availability of credit in the financial system.
Also remember equity markets are sensitive to the liquidity created by the Fed, and central banks generally. Much of the liquidity finds its way into equity markets. The Fed’s quantitative tightening (QT) program plans to reduce the balance sheet by almost US$1.3 trillion from US$8.9 to $7.6 trillion from July 2022 to September 2023.
Exhibit 9: S&P 500 Index & Fed’s assets (ratio scale)
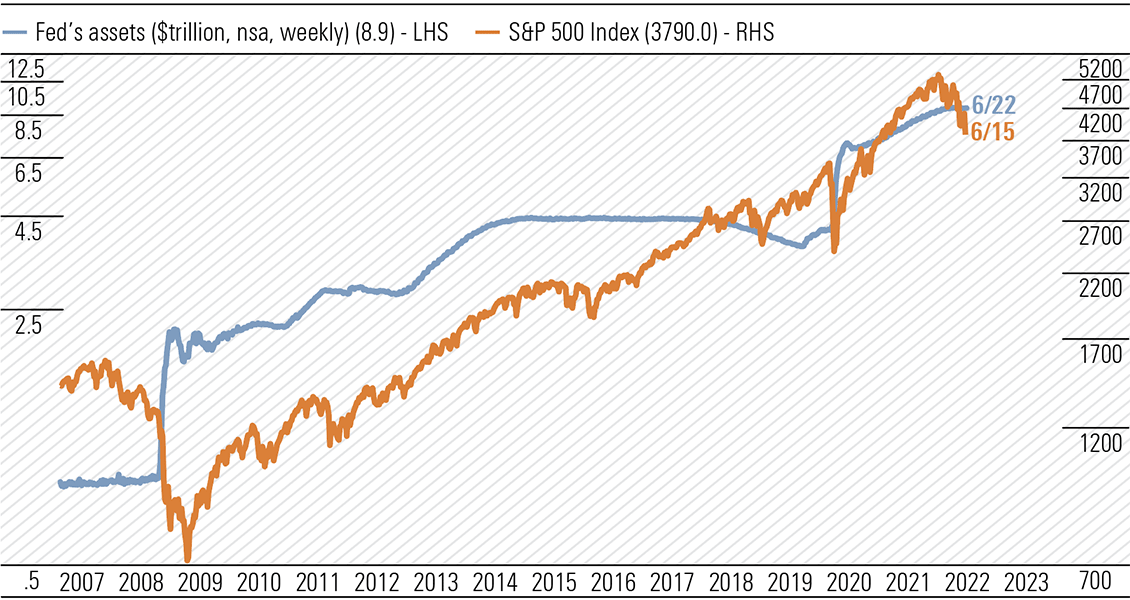
Source: Standard & Poor’s and Haver Analytics, yardeni.com
Historically, when inflation has pushed above 5% it has been very difficult to orchestrate a soft landing. Jerome Powell believes the US can dodge an economic bullet. But the path is littered with potholes and the pilots will need to be ever vigilant, with eagle eyes on the horizon and sensitive hands on the controls. Given the recent performance, I am not sure those in the cockpit will be able to engineer a landing without some meaningful economic discomfort.
The timing of the onset of the contraction is questionable but most likely in around March-September 2023 and its duration could last a year. Remember the US economy contracted at an annualised rate of 1.5% in the March quarter of 2022.
While we have already experienced some useful bear market rallies, recall the events of 2000-2002. In 2000, the Nasdaq lost almost 40% of its value. In 2001, a further 21.05% and in 2002, 31.5%. There were multiple false rallies over the period before the bottom was finally reached. The peak to trough for the S&P 500 in 2000-2002 was 49% and in 2007-09 a mere 52%. Do not get too anxious about missing the boat. History may not repeat but it does tend to rhyme.
Eurozone
The Russian/Ukraine fallout casts a pall over the world’s 3rd largest economy
The European Central Bank (ECB) is yet to raise interest rates. Even the Swiss National Bank lifted rates by 50-basis points on 16 June—the first increase since 2007 as it fights inflation and drops the focus on the currency. The rate rose from -0.75% to -0.25% and the franc surged against the euro. Authorities have signalled further increases are possible.
The ECB will increase its interest rate in July and will cease asset purchases. But it is further behind the curve than other major peers and it is difficult to see how it can avoid a meaningful economic contraction. The balance sheet is larger than the Fed’s—at over US$9 trillion.
Russia’s invasion of Ukraine has dealt a serious blow to the eurozone economy. Energy shortages and rocketing prices will slow manufacturing activity meaningfully. German industry has built a business model on cheap and abundant supplies of Russian natural gas. That is no more. BASF is a microcosm of what is occurring as gas shortages threaten its vast chemical operations. While other developed countries call for onshoring, BASF is currently building a US$10bn chemical plant in China.
Consumer confidence/sentiment is shattering across the region. German consumer sentiment has reached an all-time low since the collection of data for the whole of the country started in 1991. GfK is forecasting a reading of -27.4 for July from -26.2 in June. Consumers continue to see a significant risk of the German economy slipping into recession. Elsewhere, high inflation, political uncertainty and poor sentiment about the general economic outlook combined to send the French Consumer Confidence Index to 82 in June. This was a nine-year low and modestly above the all-time low of 79 in 1972.
Europe is being forced to consider the end of Russian gas imports as soon as this winter, exacerbating the existing economic and humanitarian crisis. The immediate issue is that Russia has reduced gas flows via the Nord Stream 1 to about 40% of capacity. At the same time, an explosion at a key processing plant have reduced the US’s LNG export capacity by about 20% making alternatives to Russian gas even harder to come by.
Against this backdrop and the start of a rate tightening cycle, it is a stretch to see how the eurozone can dodge a damaging economic contraction.
China
The sleeper about to awaken?
In contrast to other major developed nations, China may hold the key to a global economic recovery. What eventuates there could be equally as important as the Fed getting its policy settings right. It has been rightly regarded as being “un-investable” for some time. However, is the worm about to turn?
Recently, President Xi Jinping pledged to meet 2022 targets of GDP growth around 5.5% despite the zero-tolerance approach to COVID and a weak housing market pressuring the economy. Macro-economic policy adjustments will be made, and more effective measures introduced to ensure social and economic development targets are achieved. Forecasters have trimmed growth estimates due to the impact of the zero-tolerance lockdowns and data for April and May confirm a meaningful slowdown. The second half will have to come with a wet sail to achieve annual growth above 5%.
China’s inflation is comparatively low, running at 2%, below the 3% target. The bond market has not experienced the sell-off that has occurred in western countries. The authorities are ready to stimulate which is in stark contrast to developed countries. The country is also benefitting from buying Russian commodities at a discount. Russian oil is selling at a US$30-35 per barrel discount to Brent crude. US President Biden is considering reducing tariffs on Chinese imports to help curb inflation. Should that occur, China’s export volumes would increase.
China’s economic transition and the likely extension of Xi Jinping’s role as undisputed leader are key issues for investors. Beijing will host the 20th Party Congress in November and it will determine who leads China for the next five to 10 years; how powerful Xi is; and the policy trajectory to be followed for the next five years.
The transition currently underway is based on the “dual circulation” strategy, which was first aired in 2020 as the rift with the US widened. It was a key priority of the 14th Five Year Plan (2021-2025) and embraces “internal circulation” and “external circulation” to deliver growth based on quality rather than quantity. It aims for slower but more sustainable growth driven by lifting domestic demand in the 1.4 billion population, with a focus on a rapidly growing middle class of over 400 million.
The focus on “internal circulation” is designed to lift the productivity of labour and capital by moving both higher up the production value chain underpinned by increased investment in advanced technology. The aim is to lift the value of output, thereby lifting GDP. Wages would be higher, which would increase household income, drive domestic consumption, and close the GDP per capita gap with developed nations. Time will tell, but there is a strong commitment to achieve the goal.
Energy
Energy prices will ultimately ease but not likely in the near-term
—Mark Taylor
The now four-month-old invasion of Ukraine by Russia drags on and high energy prices persist. The energy price response is reaching all corners, including in non-conventional areas. The battery metal lithium price is soaring, carbonate pushing US$70,000 per tonne, up 10-fold on 2020 levels. And key input spodumene concentrate price reportedly recently achieved a record spot level of US$7,000 per tonne—spodumene normally attracts around 5% of the lithium carbonate price, not the current 10%.
Crude oil refiner margins have also taken flight. Singapore gross refining margins recently touched new highs above the US$25 per barrel mark, jumping over four times. Sanctions on Russia, and Asian refinery shutdowns contribute to the rises. ASX-listed Viva Energy (VEA) reported its Geelong Refining Margin for April 2022 was US$26.40 per barrel versus US$8.30 for the March 2022 quarter.
Energy prices were already strongly in the ascendant prior to Russian actions due to re-opening of economies and resurgent demand as the effects of the pandemic eased. But continued near unprecedented adherence to quotas from OPEC members, and capital expenditure discipline from US shale producers was also evident.
While all energy commodity prices have risen, natural gas has delivered the greatest gains in the hydrocarbon space, and in particular gas hub prices. Brent crude sits in the vicinity of US$110 per barrel, or 300% ahead of prices at the beginning of 2020. But the US$37/mmBtu spot Asia LNG price quoted as the Japan Korea Marker (JKM) is up a staggering 17-fold. Even the lumbering Henry Hub (HH) gas price in the US is up around 300% to US$6.20/mmBtu, an increase unusually in line with that for Brent crude, and HH was recently even higher above US$9.00/mmBtu.
We still anticipate Brent crude and gas spot prices to retreat to our unchanged mid-cycle forecast levels of US$60 per barrel and US$8.50 per mmBtu by mid-2024—essentially half, or slightly less in the case of gas, of current levels. Even were hostilities to cease in Ukraine nearer-term, we do not expect western European countries to go back to business-as-usual with respect to Russian gas supplies. Russia until recently accounted for 45% of European Union gas imports and 40% of the total gas consumption. But we think re-sourcing of gas supply from elsewhere, including the US, Middle East and Asia Pacific, the increasing uptake of renewables, in addition to Russian gas bleeding into non-western aligned nations will take the sting out of energy prices.
We expect lithium prices to hold up longer due to undersupplied market conditions, down around 30% from current levels by 2024, but reaching mid-cycle levels around US$15,000 per tonne by 2030, just under half current levels.
In the meantime, Australian energy-exposed companies can expect heightened cash flows to bolster balance sheets, facilitate expansion plans, and increase the likelihood of capital management initiatives including share buybacks and/or special dividends. That is in addition to earnings-boosted ordinary dividends, where they are paid. And despite this many still reflect excellent value, often in 4-star territory.
Exhibit 10: Energy-theme exposed companies
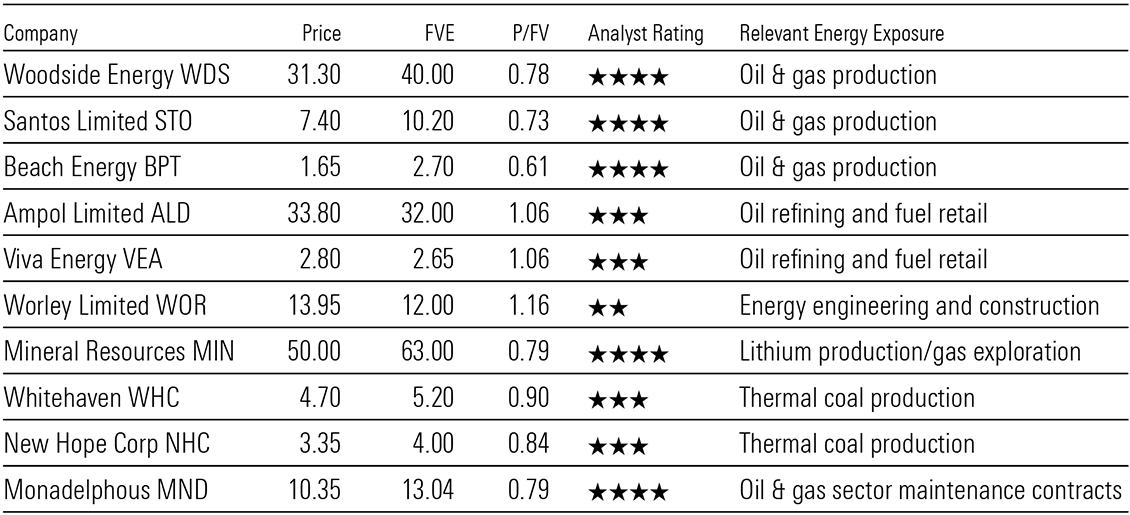
Source: Company filings, Morningstar