
Despite the very long-term nature of the Australian superannuation system, investors can move between options and super funds on a daily basis.
This liquidity mechanism afforded to investors means the liquidity profile of a fund cannot be ignored. But looking at the level of illiquid assets as a proportion of total assets is only part of the story. Understanding the future cash flow profile and member demographics of the fund also gives an indication of the sustainability of the level of illiquid assets.
While liquidity stress-testing is required to be conducted by funds under SPG530 – Investment Governance, the level of public disclosure on this issue is limited. We attempt to piece together some key metrics of a handful of large funds to see how they stack up.
The five funds selected for the purposes of this analysis are:
- Australian Retirement Trust
- AustralianSuper
- Aware Super
- Cbus
- UniSuper
Of the roughly $2.25 trillion of total fund assets reported to APRA as of June 30, 2022, these five funds reporesented almost 40% of this pool.
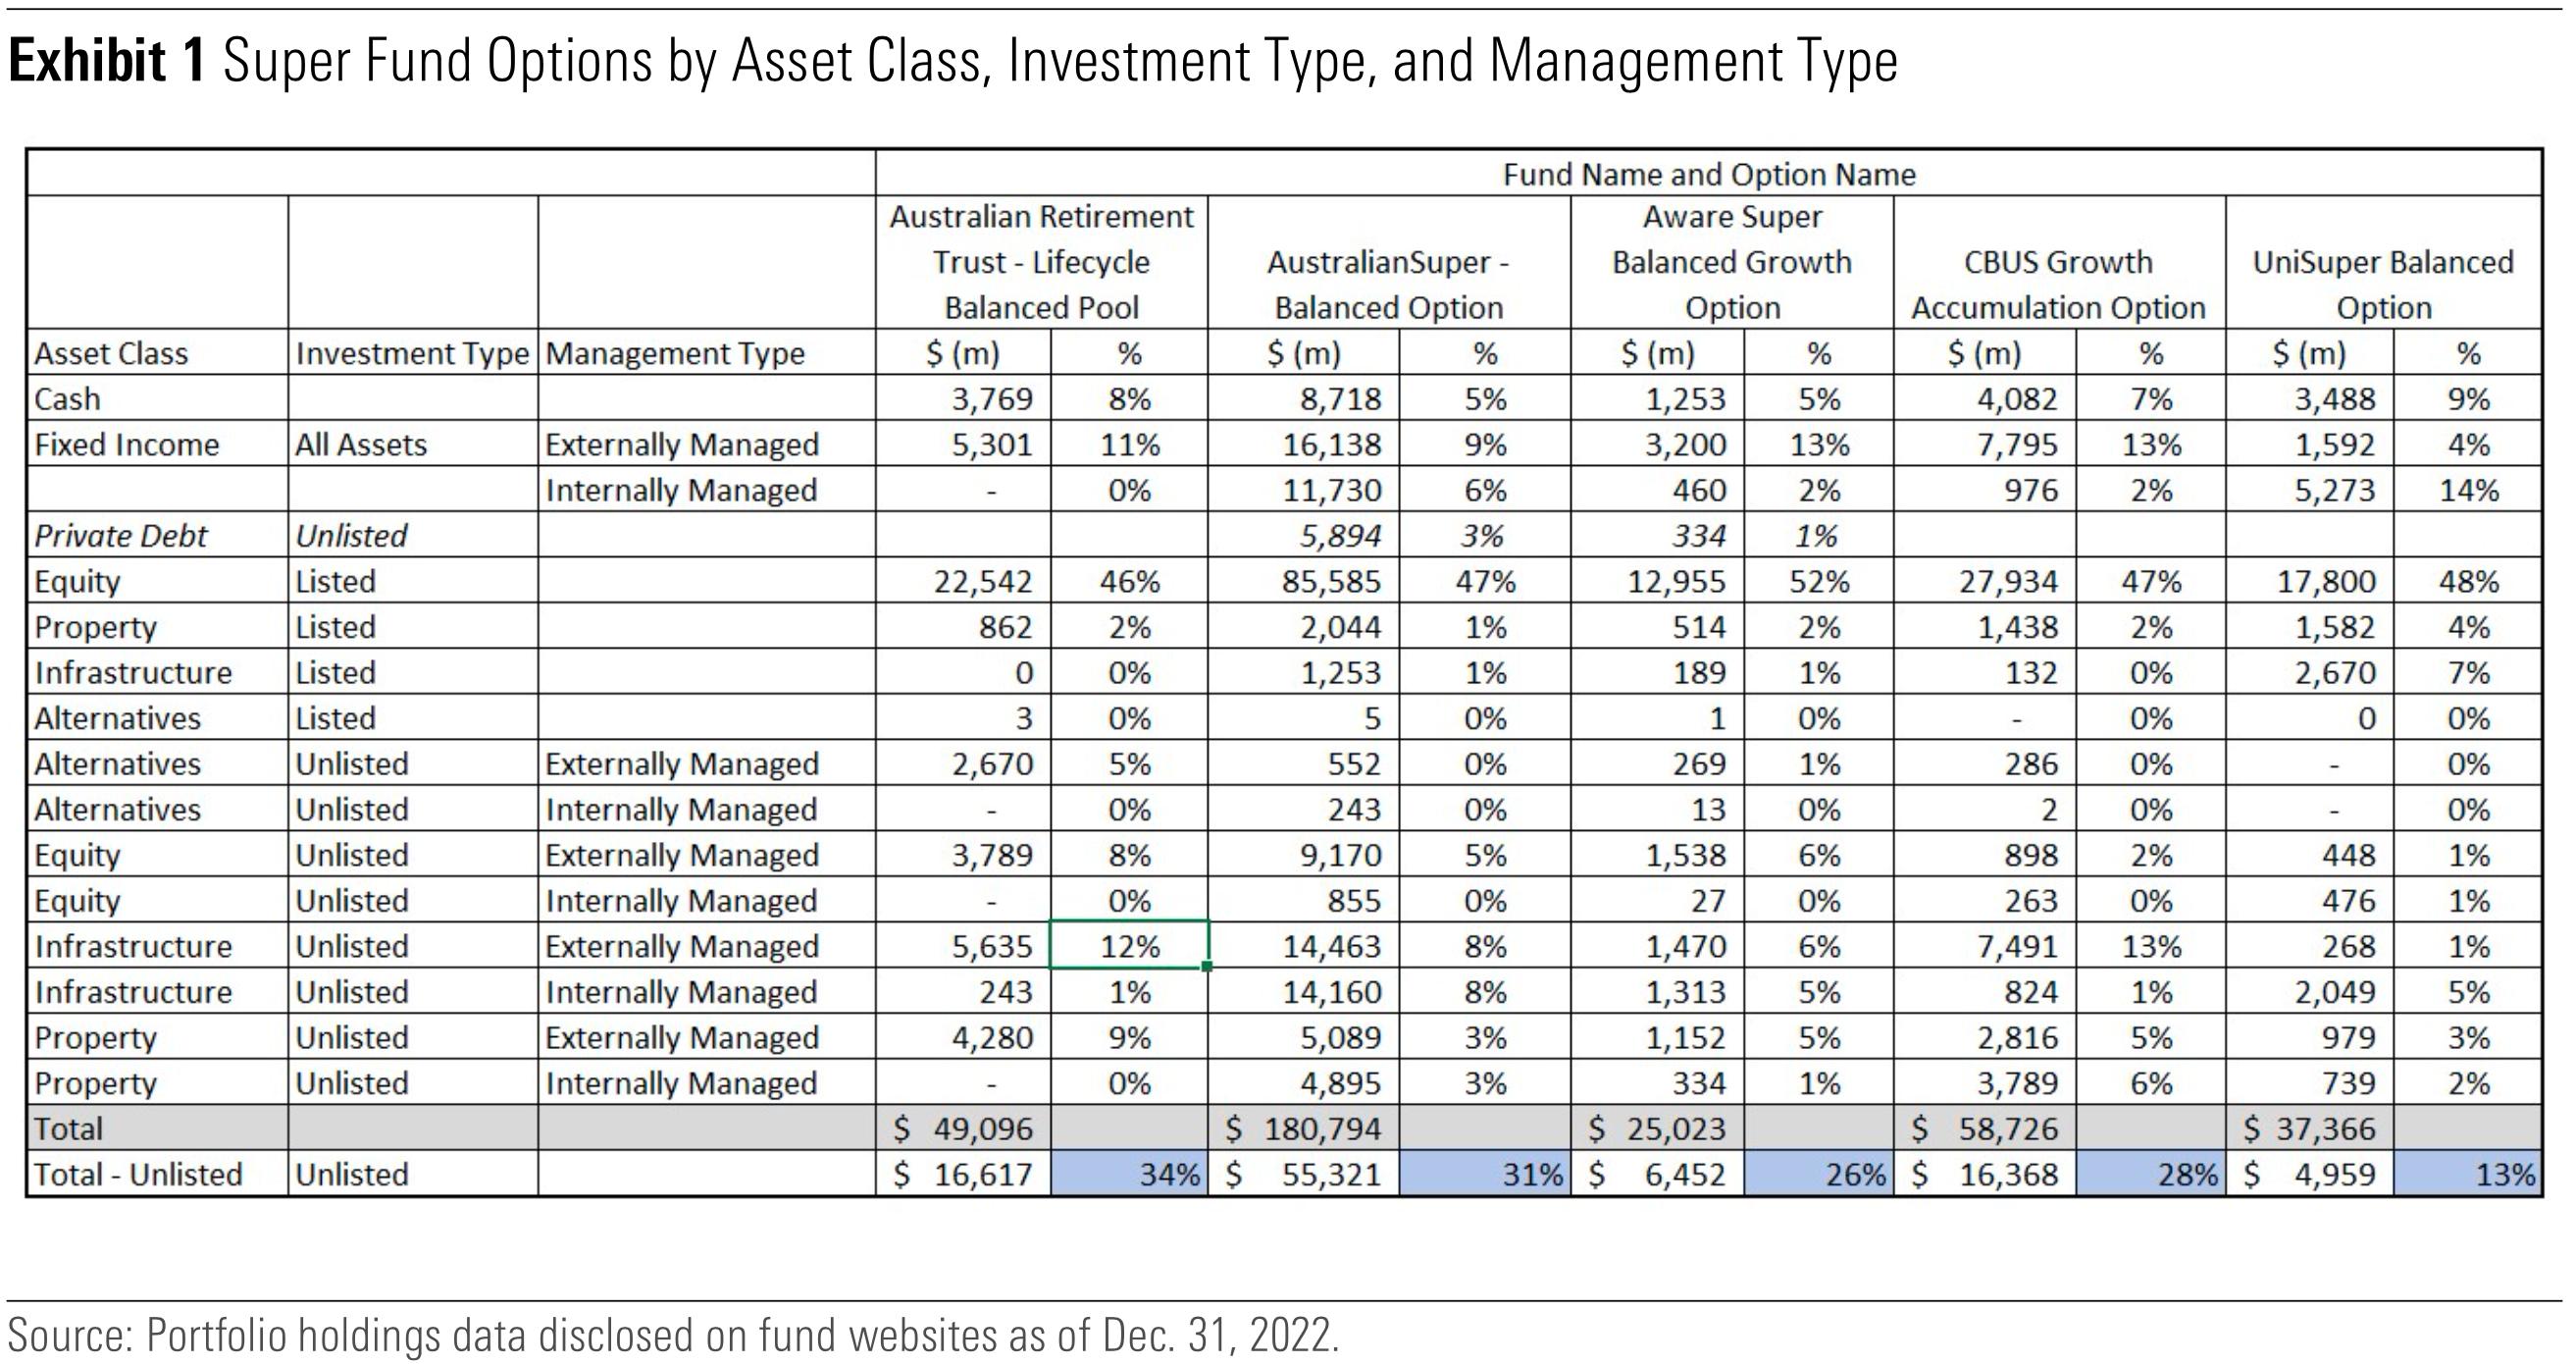
Unlisted allocations of the big funds
This analysis uses the Portfolio Holdings Disclosures of super funds, which specifies a fund’s allocation to “unlisted” assets for a particular option. The funds’ larger options, typically in the balanced and growth categories, have been selected for the analysis.
Measuring illiquidity is challenging, and while “unlisted” does not equal “illiquid”, unfortunately the liquidity ladders of super funds are not made available. That is, the assumed proportion of a fund that could be liquidated in one week, four weeks, three months, one year and so in is not disclosed.
So, in the absense of disclosure, “unlisted” will crudely be used as a proxy for “illiquid”.
While the definitions may be imperfect the analysis shows that there are varying levels of unlisted assets held across these large super funds’ options.
Australian Retirement Trust’s Lifecycle Balanced Pool holds the highest level of unlisted assets at 34%; UniSuper’s Balanced Option holds the lowest level at 13%, and AustralianSuper’s Balanced Option sits at around 31%.
The level of illiquid allocations as a percentage of the total portfolio will move around – particularly in periods of volatile listed markets.
When listed markets are declining in value and illiquid markets are either remaining static (due to mark to market pricing stability) or declining to a lesser degree, the illiquid allocation will naturally become a higher proportion of the portfolio through this period.
Mark to market is a method of adjusting assets and liabilities, and considers what an asset would sell for if it were sold on the open market, regardless of what was actually paid for it.
During 2022, we witnessed a strong selloff in both listed equities and bonds, and a weak Australian dollar. This selloff did not impact the asset prices of private markets to the same degree and, as a result, it’s likely that some of these unlisted allocations are slightly higher than fund targets and what you’d expect during more normal market conditions.
Illiquidity through another lens
Another way of understanding the nature of assets held by superannuation funds is to dig through the annual financial statements where the accounting standards require a breakdown of estimated fair values for different market types using a hierarchy.
The hierarchy basically scales from Level 1 (mainly listed equities where there are readily available quoted market prices) through to Level 3 where there isn’t observable market data and therefore fair values are based on unobservable inputs. The more-illiquid assets such as infrastructure, private credit, property, and private equity are typically included in this third level.
Based on the 2022 financial statements from the five funds, the proportion of Level 3 assets relative to the fund’s total net assets is shown in the table below.
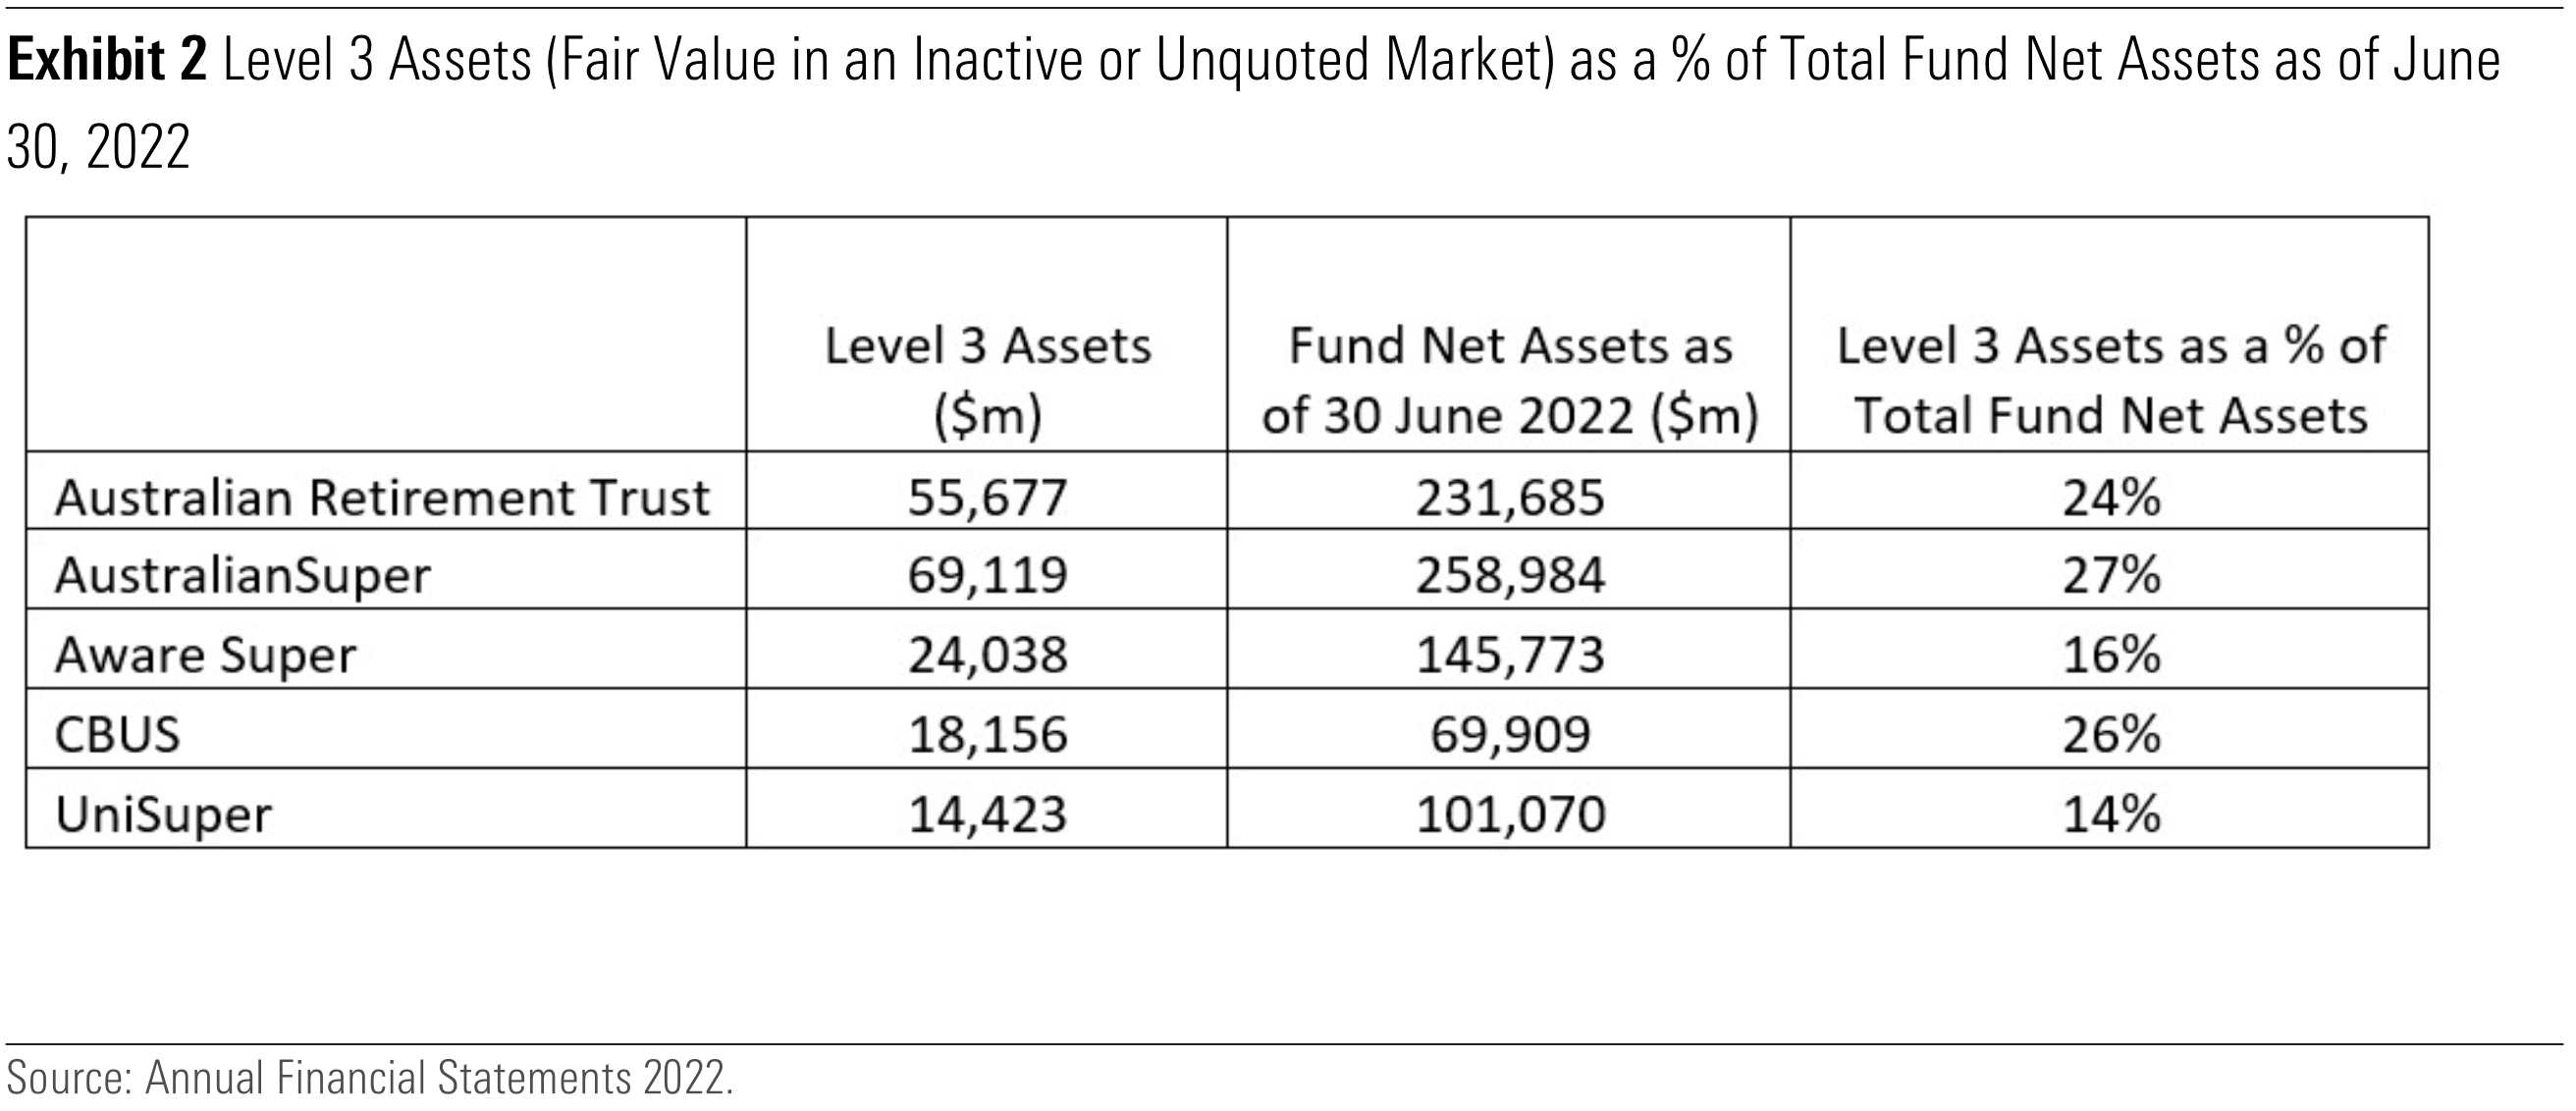
Exhibits 1 and 2 are not perfectly comparable given one considers each fund’s assets invested in Level 3 assets and the other considers a particular funds option’s exposure to unlisted assets. Each fund has a number of other options (including equity-only options that are highly liquid). It makes sense that at a total fund level, there would be a different total of illiquid assets.
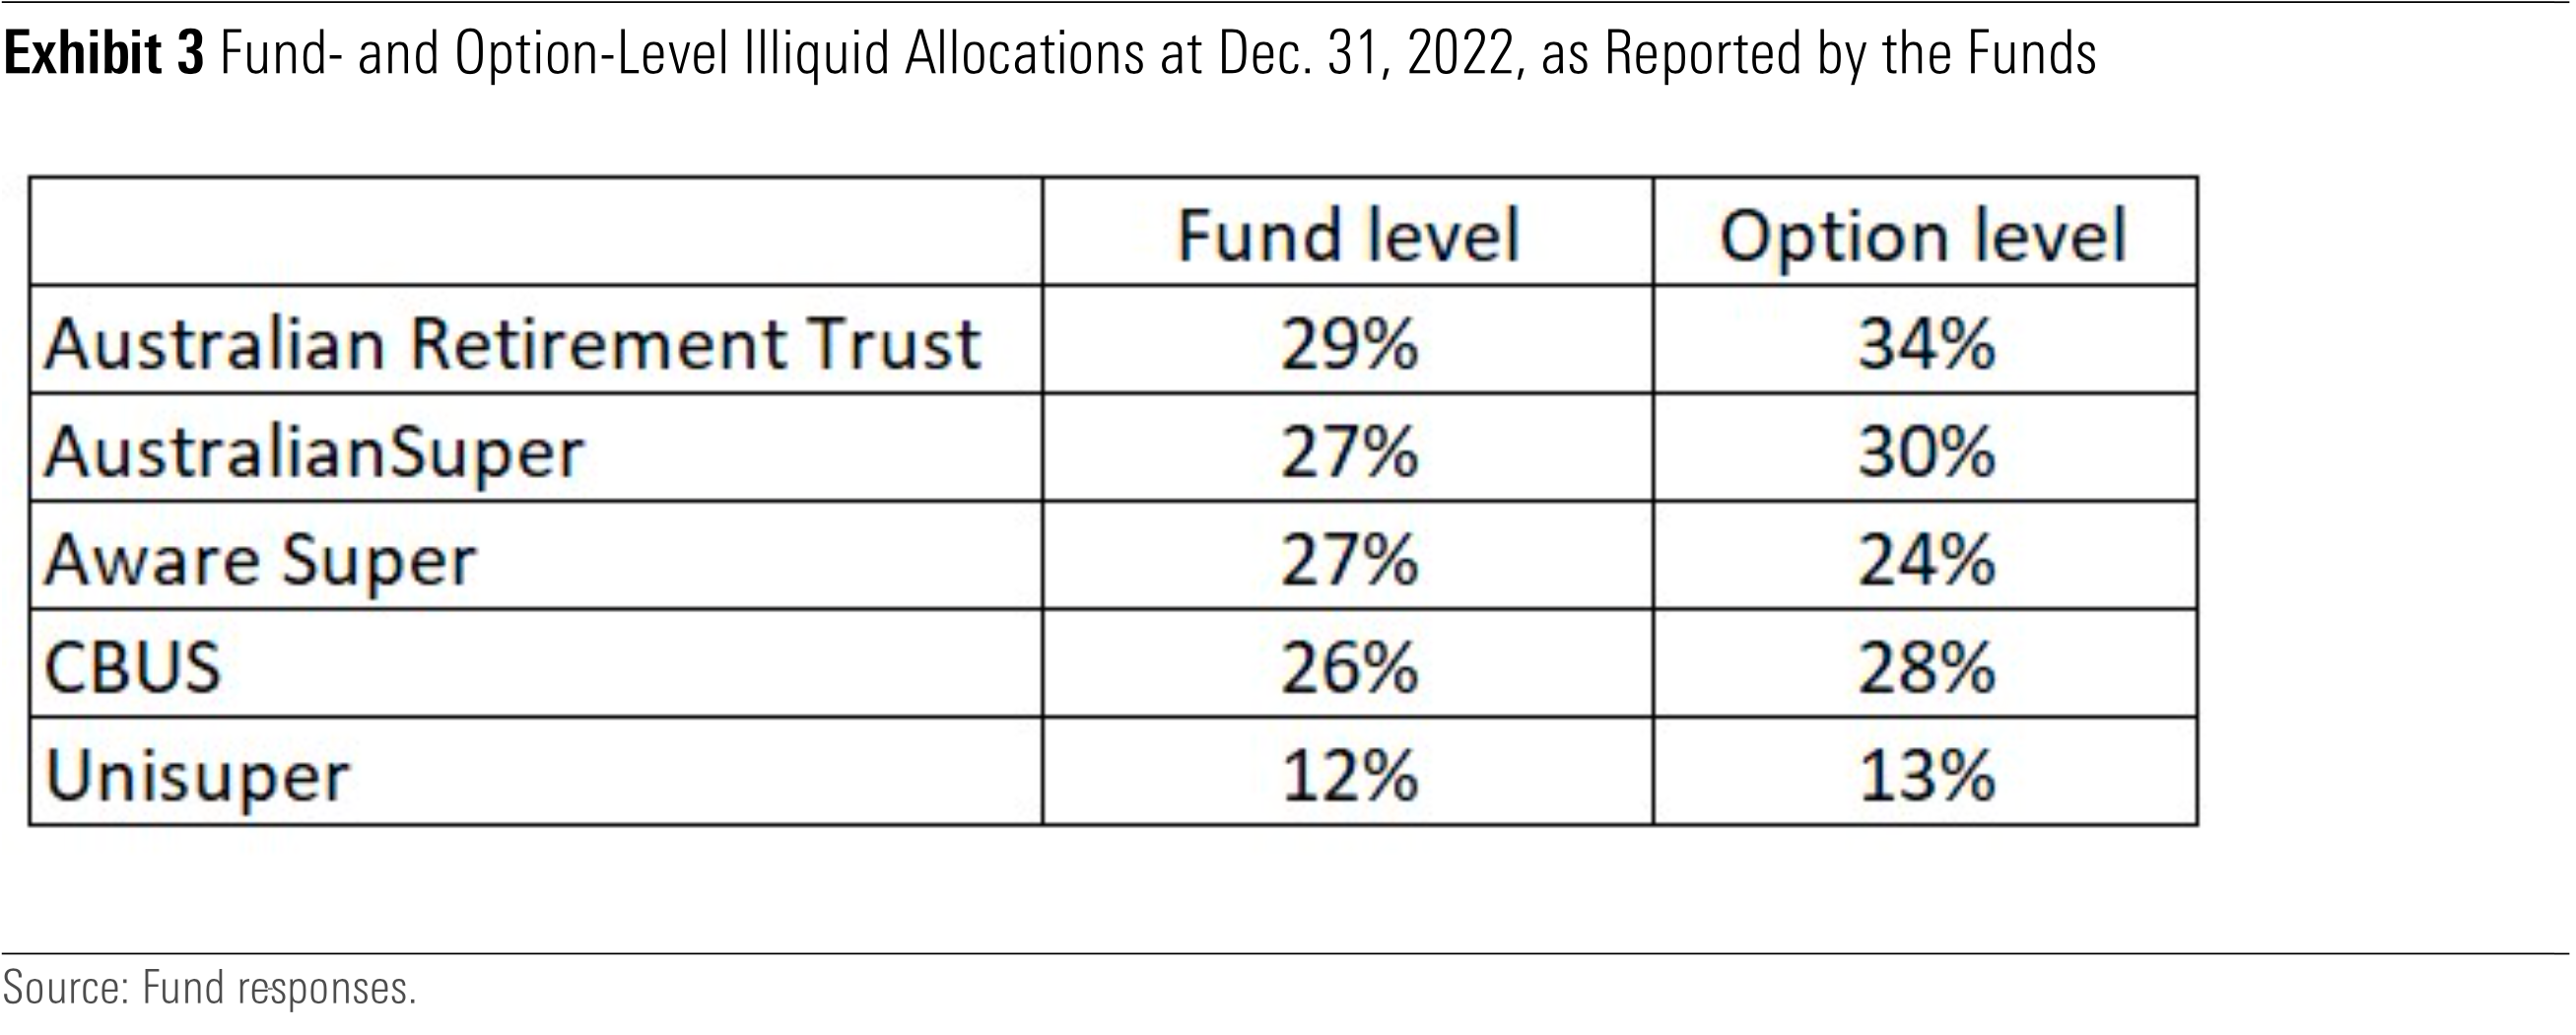
What do the funds say?
Of course, the other method of defining levels of liquidity is to just ask the superannuation funds for their interpretation.
Undoubtedly the investment teams have applied some deep thinking to this problem, and their interpretations are displayed in the table below:
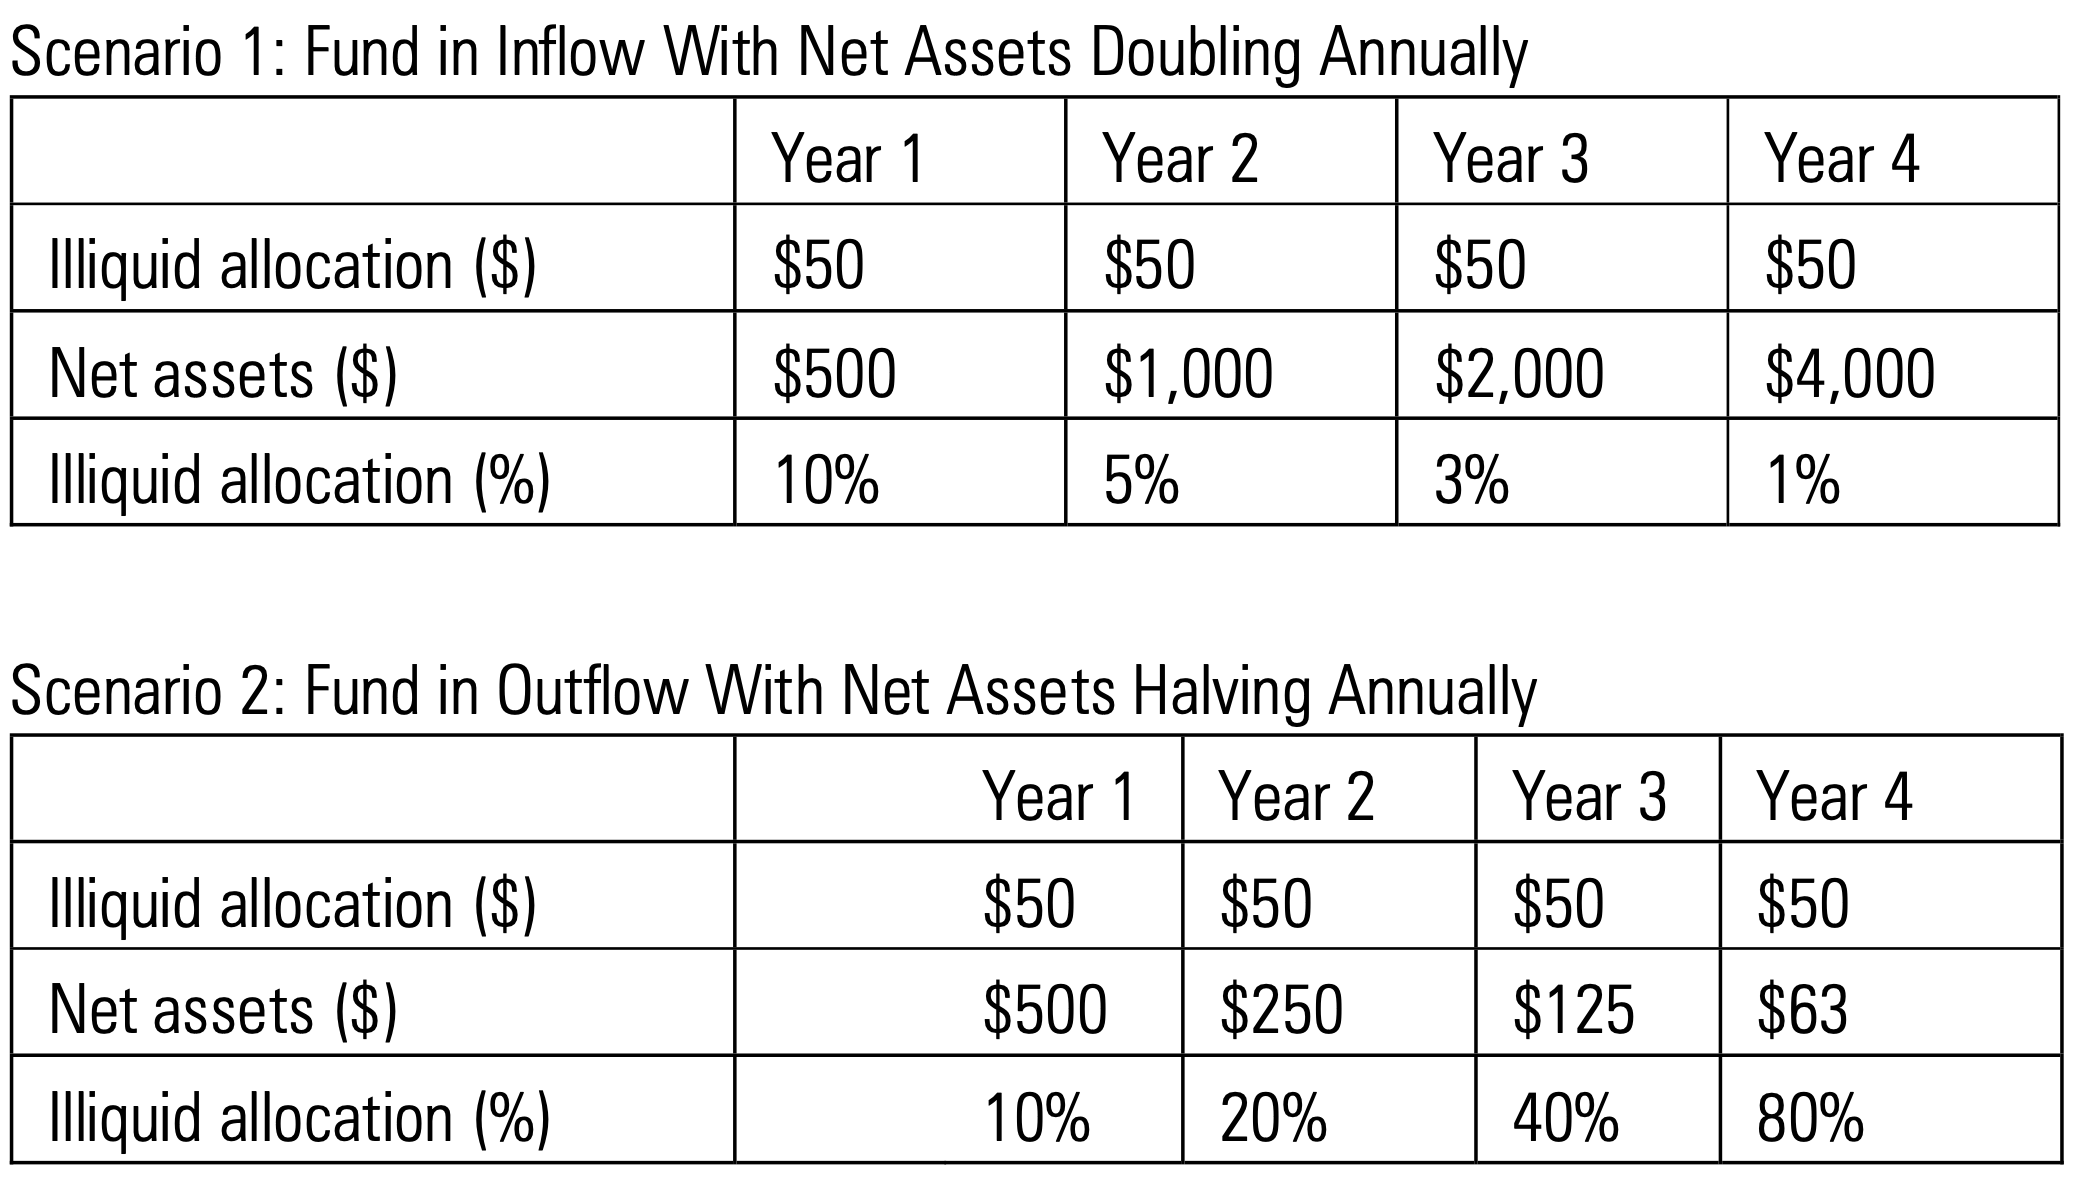
Money coming in; money going out
When it comes to liquidity, the money coming into or moving out of a fund is highly relevant.
To illustrate the point using an extreme example, if a fund has net assets of $100, and in Scenario 1 the net assets double each year, the illiquid allocation diminishes very quickly. Conversely, if a fund has net assets of $100, and in Scenario 2 the net assets halve each year, the illiquid allocation ramps up very quickly.
Inflows and outflows matter. And each year under APRA’s annual fund-level superannuation statistics, funds must disclose the level of flows broken down by member contributions (inflow), member benefit payments (outflow), rollovers (inflow/outflow), and flows as a result of merger activity.
The Conexus Institute established a neat framework for thinking about the types of flows in their State of Super 2023 Booklet.
For the purposes of considering the liquidity profile of a fund, the table below considers “total members’ benefit flows in” (that is, superannuation employer and member contributions) and “total benefit payments” (that is, lump-sum withdrawals and pension payments), termed “Natural flows” in the Conexus Institute’s research.
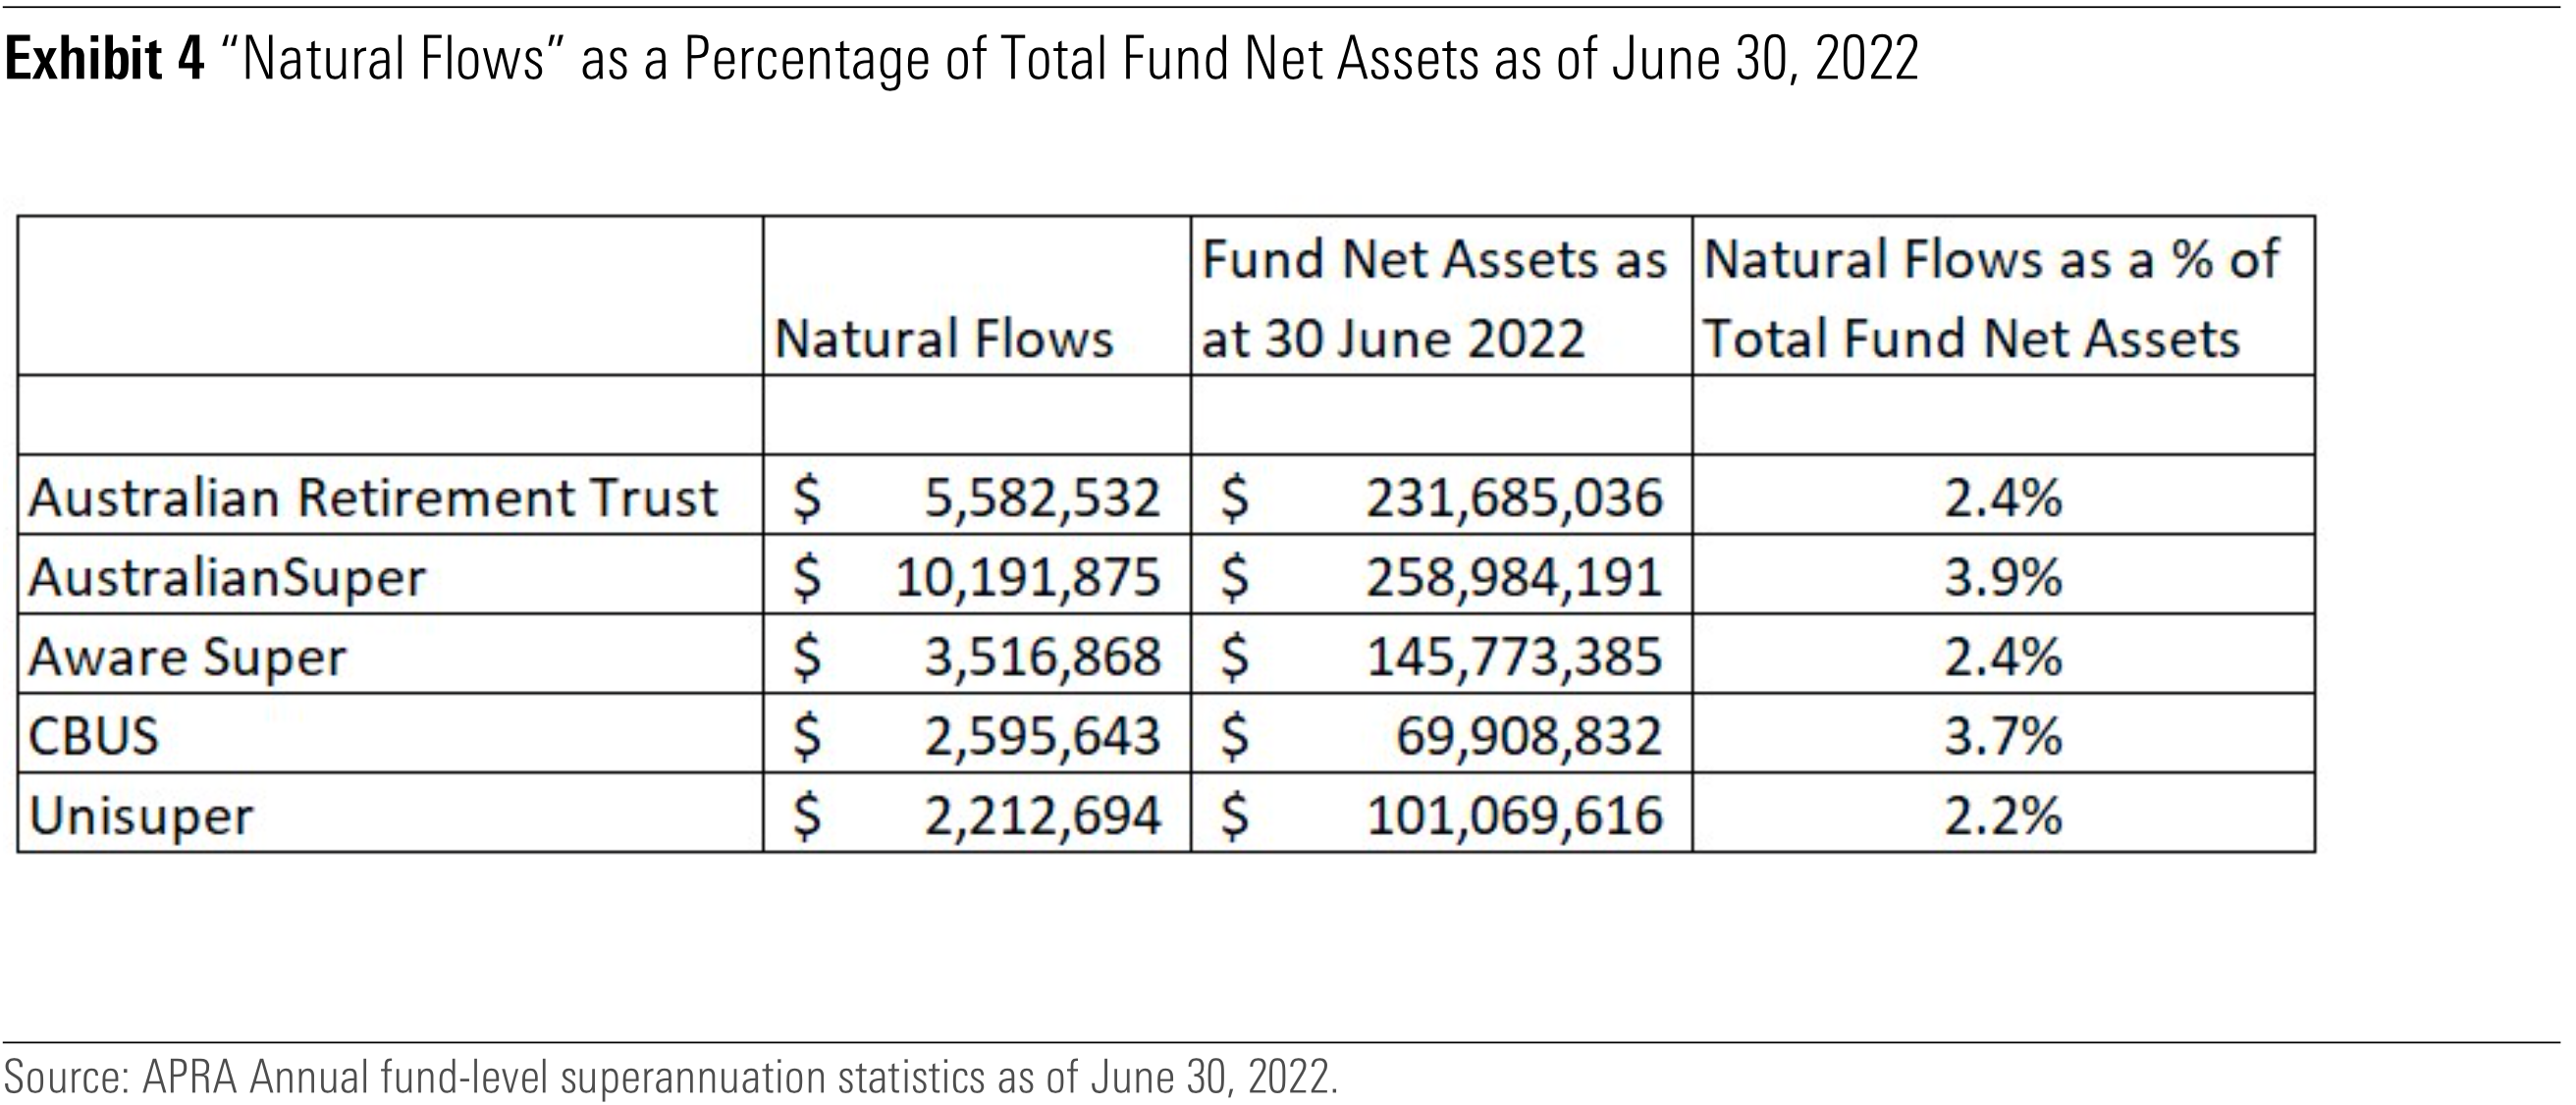
Exhibit 4 shows that when it comes to natural flows, both in absolute terms and as a percentage of total fund net assets, AustralianSuper is winning the war. It’s worth highlighting that Cbus is also doing a very good job of capturing flows as a percentage of its net asset base.
Member demographics and cash flows
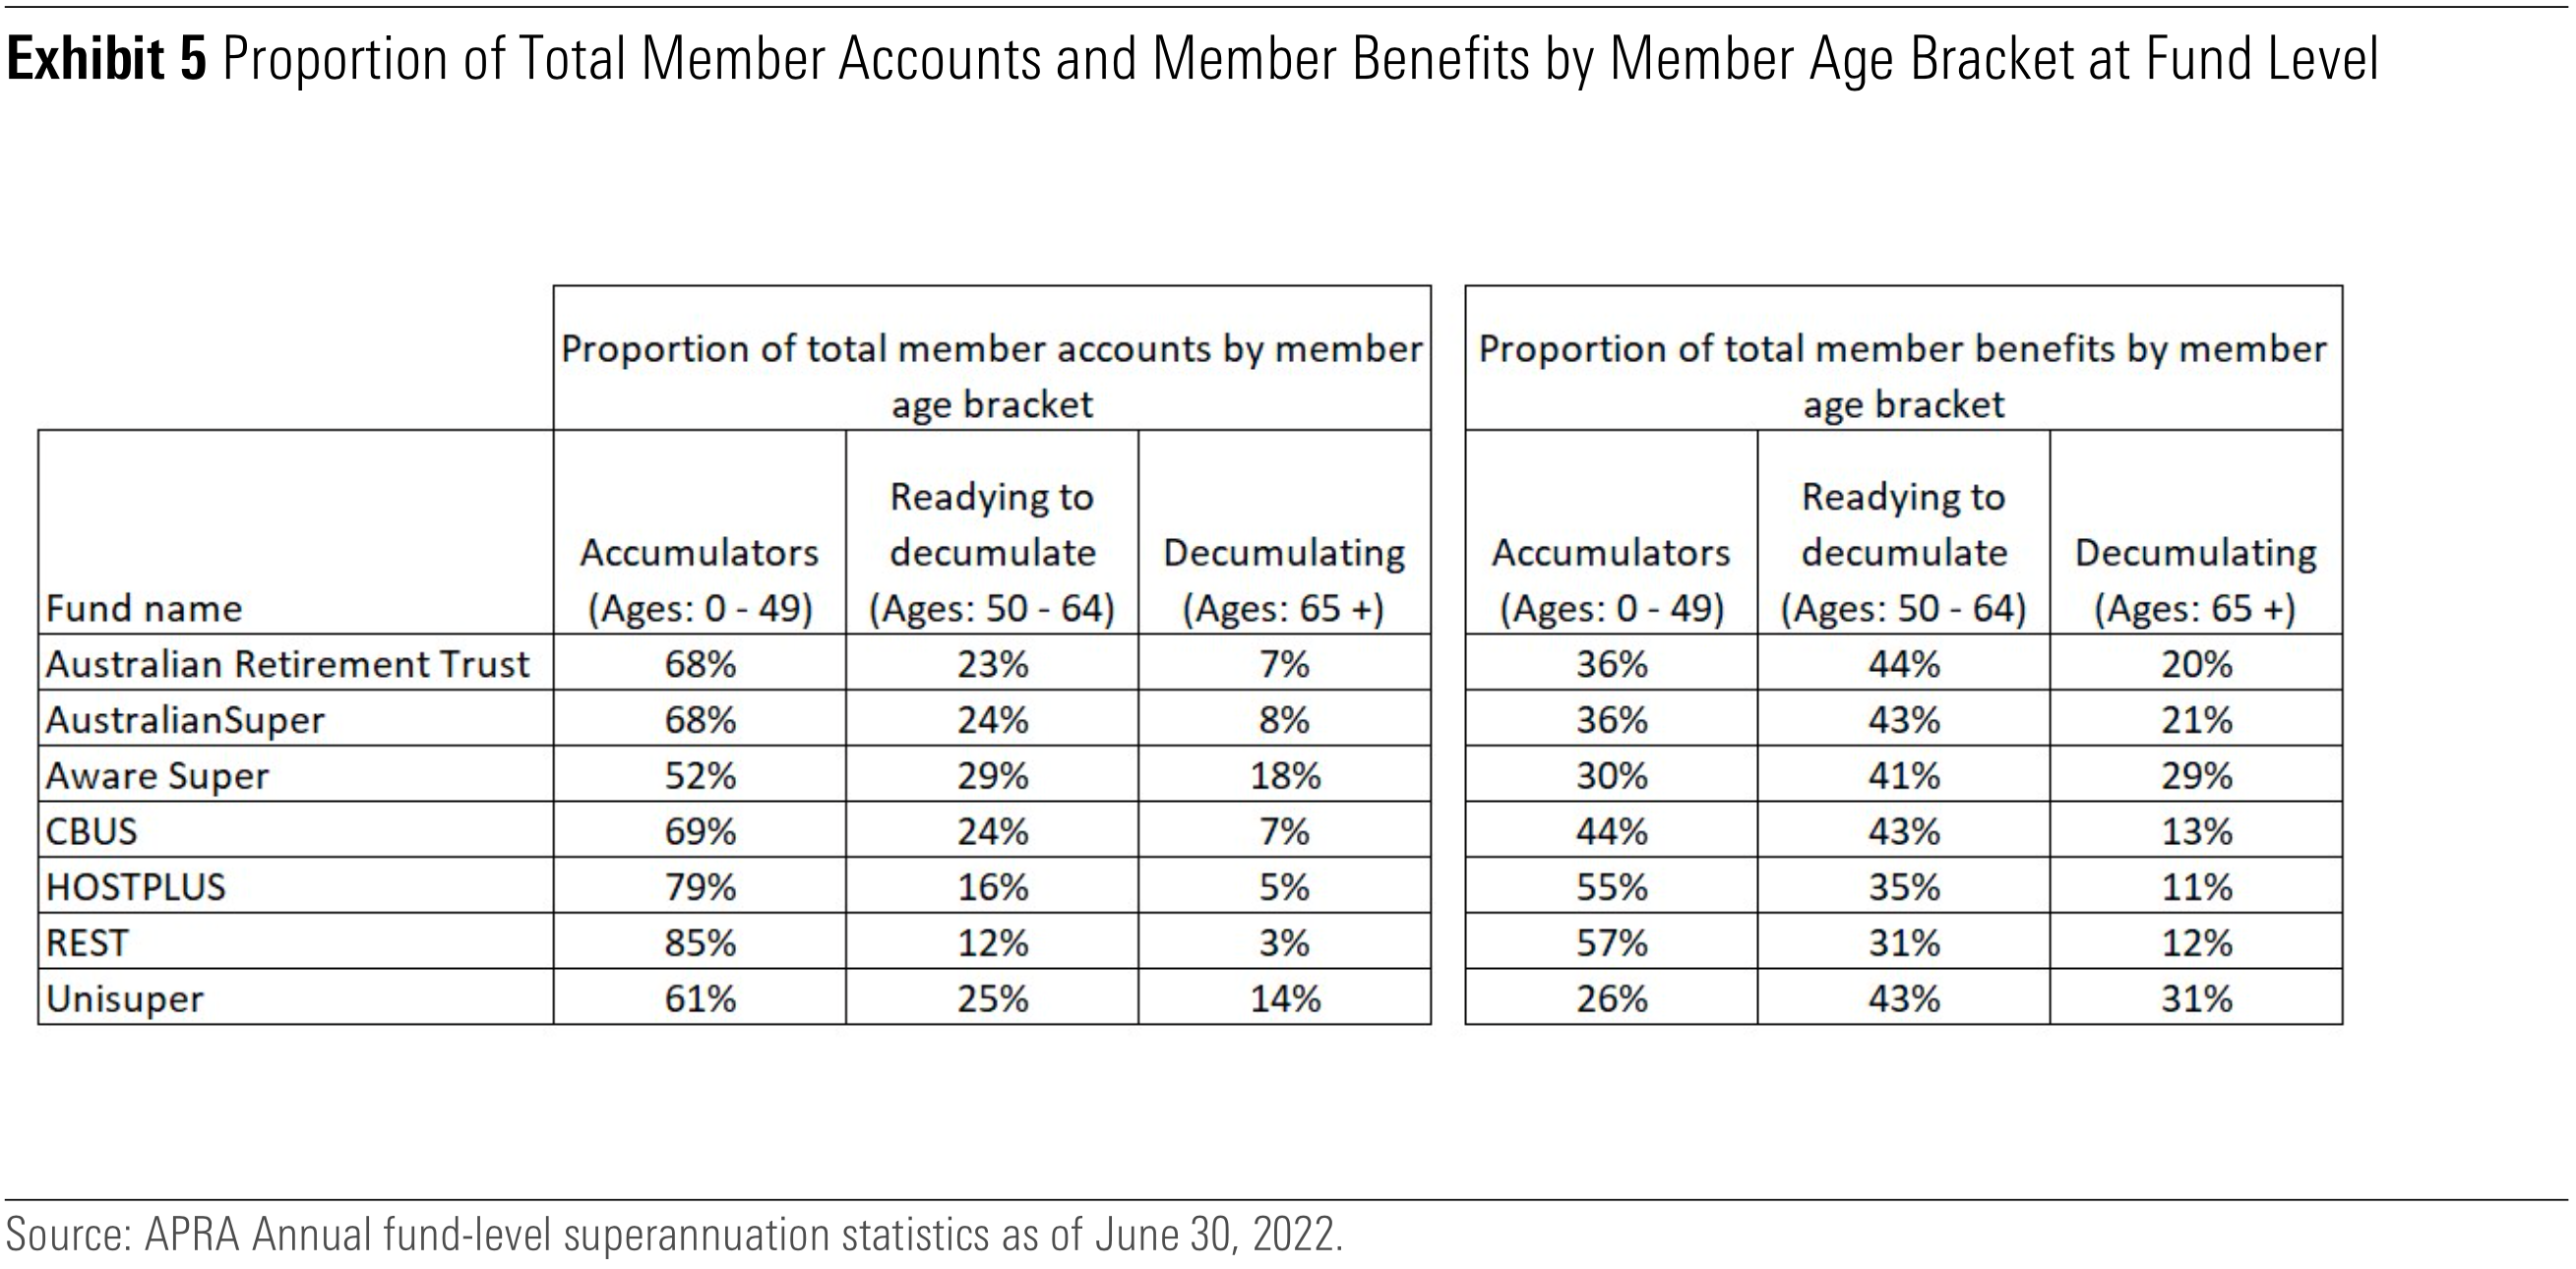
“Natural flows” will be impacted by the demographics of a member base.
For example, an older member base will likely be drawing down their superannuation rather than contributing to it. Further, how the profile of a member base changes over time should also impact the liquidity profile of a fund.
If a fund knows that a significant portion of its member base is nearing retirement and will either start drawing down its super balance or switch funds, liquidity levels should shift in response.
As shown in Exhibit 5, some funds have a significantly higher proportion of their member base who are decumulating. Hostplus and Rest superannuation funds have been included in Exhibit 5 to contrast the proportions for funds with a substantially younger member profile.
How illiquid is too illiquid?
Interestingly, under the Corporations Act, quite explicit guidance is provided for managed investment schemes. The provision states that “a scheme is liquid if liquid assets account for at least 80% of the value of the scheme property.”
In the absence of explicit guidance, the best we can hope for is that fund trustees are focused on their Liquidity Management Plans and how they stand up to different market conditions. Notably, the funds passed the test handed down in early 2020 – including the Early Release Scheme introduced, the aggressive selloff in listed markets, and the level of switching that occurred in response to volatile markets.
But it would be remiss of us to get too comfortable. A run on a fund (or a bank) can happen at any time —Silicon Valley Bank is a timely reminder. Large member outflows, a risk-off environment where listed markets selloff aggressively, and the Australian dollar in free fall would see funds’ allocations to illiquid assets likely increase as a proportion of total assets. Ongoing regulatory oversight of this issue is critical, and increased public disclosure on funds’ liquidity profiles would be welcome.
With its long-term framework, the retirement system supports the ability of superannuation funds to buy multigenerational (often illiquid) assets, which should deliver great returns for investors over time. However, we need to preserve the sustainability of such a system to ensure the illiquid component of these funds are prudently managed.
But measuring liquidity is complex and it’s important to consider all relevant factors—not just the headline illiquid or unlisted allocations. And based on the data presented, currently there isn’t cause for alarm across these five funds.