
“Fingers Crossed” read the headline of The Australian Financial Review last weekend. Two words investors should never rely on.
Appeals to hope should be a wake-up call in the current environment. They should shake up the complacent and reinforce the need for capital preservation. Luck is not a sustainable investment strategy. There is likely to be much more economic pain ahead before greener pastures emerge.
Wishful thinkers are looking at the strong recovery in equity and bond prices since mid-June when US and Australian equity markets bottomed. Recall, bond prices rise when yields fall and vice versa.
The share market rally reflects the belief the Fed will pull back from rate hikes. Markets now believe 75-point increases are off the Fed’s radar and 50-point hikes are in the past for the Reserve Bank. The rapid changes in market perception are reminiscent of a fiddler’s elbow. Hope springs eternal as human psychology and wishful hand gestures overtake sombre economic data. Lessons should have already been learnt. Confidence the Fed will perform a dramatic pivot is extreme.
Meanwhile US real GDP fell for the second consecutive quarter in June. Call it what you want—technical recession or random blip—but the US economy contracted in the six months to 30 June, despite unemployment falling to 3.6%, the lowest since February 2020’s 3.5%.
Even war battered and energy starved eurozone expanded by 0.7% in the June quarter after a downwardly revised 0.5% growth in the March quarter. How resilient is the US economy?
Short-lived bursts of enthusiasm are common during downturns. Recall there were nine double-digit rallies in the NASDAQ-Dot Com bear market between February 2000 and February 2003, as the index speared from over 4,500 to below 1,000 before eventually bottoming. Similarly, there were numerous double-digit rallies in the GFC bear market.
The tech-heavy NASDAQ Composite has led the US recovery getting support from falling bond yields and the rapidly easing fears of a rampaging Fed. Having lost near 5,000 points or 32% from 31 December to the mid-June low, it has added just over 2,000 points or 19% to 3 August. The S&P 500 shed 1,100 points and has rebounded some 490 points or 13.3%.
Exhibit 1: Equity market performance
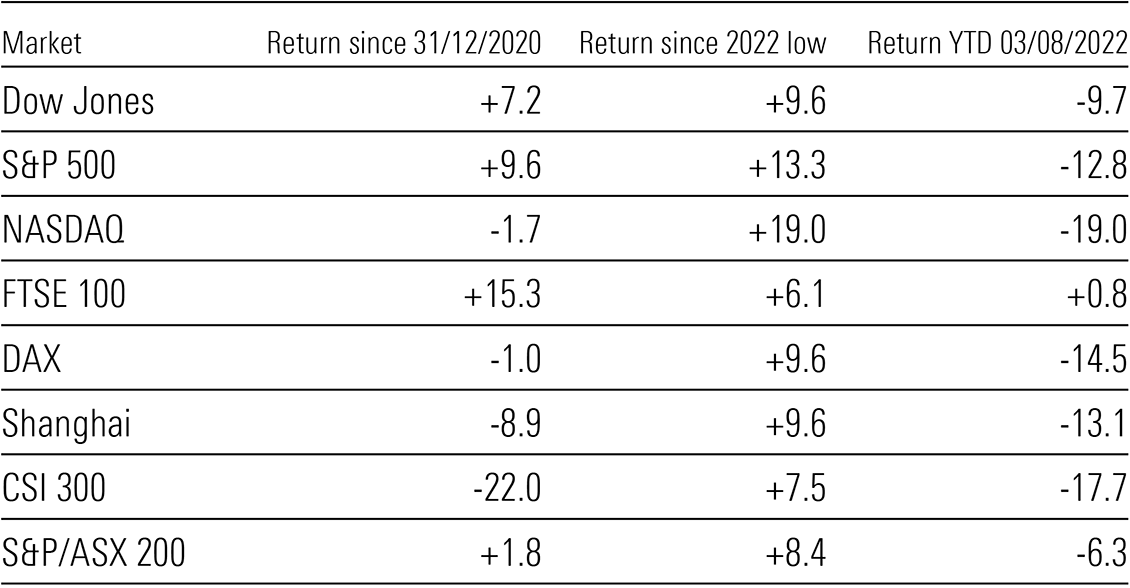
Source: Morningstar
The US 2Q22 earnings reports have been reasonable although consensus estimates were progressively trimmed prior to 30 June. The blended earnings growth rate for 2Q22 is 6% for the S&P 500 and if this becomes the actual performance, it will be the slowest quarterly increase since 4Q2020. Full year estimates are being downgraded and more companies have so far issued negative guidance than positive.
Interest rates are only one component of monetary policy tightening. Central banks are also reeling in excess liquidity by reducing balance sheet assets, known as quantitative tightening (QT). From 1 June, the Fed was to reduce its balance sheet at a monthly rate of US$47.5bn for three months. This was to be achieved by allowing Treasury securities (US$30bn) and agency mortgage-backed securities (MBS) (US$17.5bn) to mature and not reinvest the proceeds. The monthly rate will double from 1 September to US$95bn.
As at 27 July, total assets were US$8.89 trillion, just US25bn less than 1 June. US Treasuries were US$37bn lower and agency MBS US$10bn higher. The Fed holds just US$47bn in MBS with maturities between 91 days a one year making it impossible to meet the monthly reductions without selling securities into the market. The target to 1 June 2023 is for a reduction in the MBS holding of US$367.5bn.
Exhibit 2: The Fed is hardly rushing to contract its balance sheet
Monthly change in the size of the Federal Reserve’s balance sheet (US$, trillion)
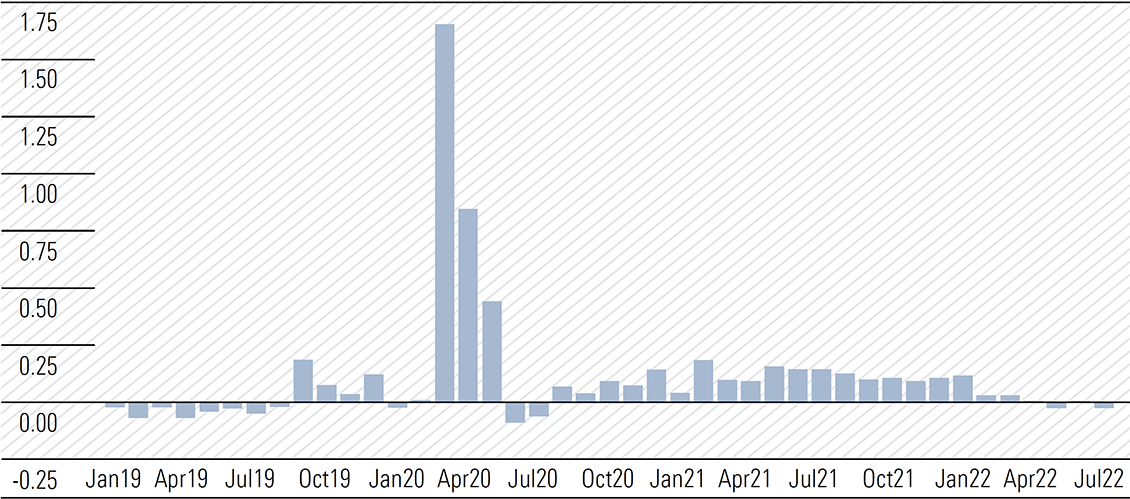
Source: Gavekal Research, Macrobond
Remember since 2008, the Fed and other central banks have supported financial markets by buying debt as part of an economic support program that started in the aftermath of the GFC. These programs were supercharged in response to the COVID-induced fallout in financial markets. This liquidity fueled a rally in risk assets from equities, bonds, and real estate to crypto currencies.
As a result of the widespread central bank intervention in global debt markets, they now own a disproportionate percentage of government debt. The Fed currently owns a quarter of all outstanding Treasury debt and a third of agency MBS. The European Central Bank and the Bank of England each own almost 40% of their government bonds, while the Bank of Japan owns nearly half of the outstanding government debt and is still buying.
Morgan Stanley estimates balance sheets at the Fed, the ECB and the BOE will shrink by US$4 trillion by end 2023. That assumes they stick to current plans. This could have meaningful implications as the monetary base contracts. The withdrawal of liquidity of this dimension is the equivalent of an interest rate increase of at least 150-basis points.
Exhibit 3: The balance sheets of central banks are set to shrink (assets $tn)
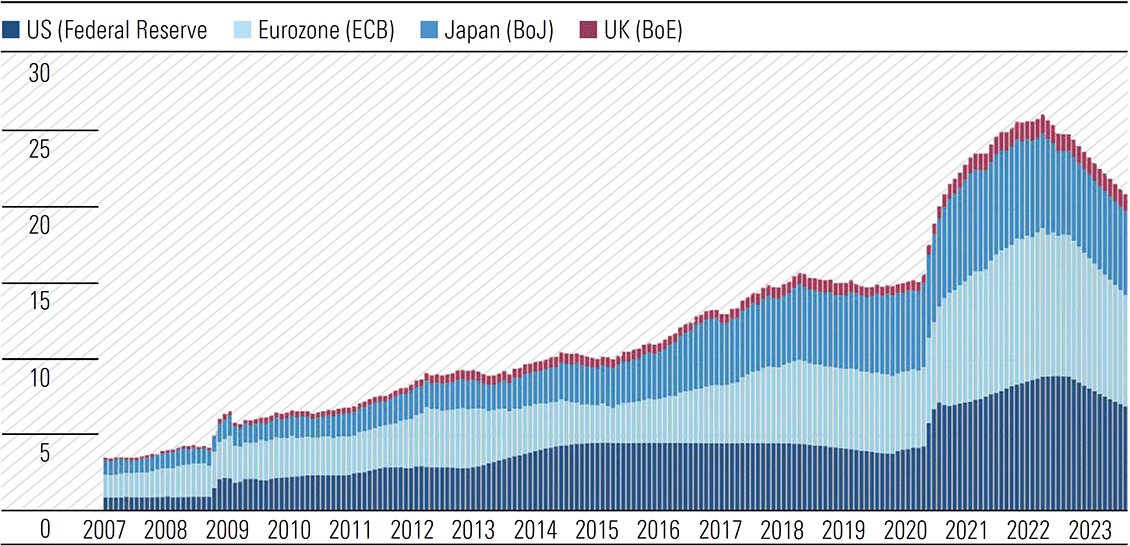
Source: Refinitiv, Morgan Stanley
Central banks asset purchase programs drove bond yields to historically low levels and forced many commercial investors out of the risk-free debt market and into the riskier corporate debt market. While the actions may have helped save the economy, it increased the risk profile of all lenders and supported riskier parts of the economy that might otherwise have struggled.
Global manufacturing at the crossroads
Global manufacturing activity is stalling as rising interest rates choke off demand and China battles to regain pre-lockdown production levels. Official data from the US, the eurozone, China and Australia confirm the slowing.
In the US, the ISM manufacturing gauge hit a 25-month low in July with a still-expansionary reading of 52.8% driven by lower new orders and production. Moderating inflation saw the prices index fall sharply to the lowest since August 2020.
China’s official Purchasing Managers’ Index (PMI) fell from June’s 50.2 to 49 in July and was the lowest reading in three months. Sensitive components including production, new orders, and new export orders all fell below 50. A reading below 50 signals activity is contracting, above 50 expanding. One of the main causes is continued subdued activity in oil, coal, and metal smelting industries. The zero-tolerance COVID shutdowns across major financial and commercial hubs sent the economy into a downward spiral in the June quarter. GDP contracted by 2.6% from the March quarter and was the first quarterly contraction since the March quarter of 2020. Officials have ceased talking about the 5.5% GDP growth target for 2022.
The eurozone manufacturing sector fell to 49.8 from 52.1 in June, the first contractionary reading since June 2020. The fall in factory output, excluding the lockdown period, was the steepest since December 2012. New orders declined for the third consecutive month. Manufacturing expectations worsened with more companies now expecting to cut output than increase production in the coming year. Not to be left out, the Australian Industry Group Australian Performance of Manufacturing Index (that is a mouthful) also fell in July from 54 in June to 52.5. Most indicators declined, although new orders and sales strengthened.
Australian earnings outlook subdued at best
Higher rates, falling house prices and reduced buying power is an unpleasant cocktail that investors should expect to sample over the upcoming reporting season.
Consumption is likely to fall and as the major contributor to economic activity this will flow through into GDP data. GDP growth is already slowing, and this trend will continue in the current half of 2022 and into 2023. The RBA’s central forecast is for GDP growth of 3.25% in 2022 and 1.75% in each of 2023 and 2024. Last week, Westpac cut growth forecasts for 2023 from 2% to 1% and from 2.5% to 2% in 2024. While the hackneyed savings buffer is being continually rolled out being consumption supportive, it is not equally distributed and should not be relied upon.
The fiscal 2022 reporting season will be backwards looking. Expect more earnings downgrades for fiscal 2023 and 2024 once analysts have heard management commentary and guidance.
Margins are likely to remain under pressure as demand softens and competition intensifies to protect market share. Supply chains are far from operating effectively or efficiently and productivity is suffering from elevated absenteeism and a heightened level of unskilled workers. While inflation can support revenues, there is a lag in passing through cost increases.
Falling real wages provides some margin support, but Treasurer Jim Chalmers intends to rectify the imbalance. In his address to parliament last week, Chalmers said, “The harsh truth is households won’t feel the benefits of higher wages while inflation eats up wage increases and then some. Real wages growth relies on moderating inflation and getting wages moving again. Based on current forecasts, real wages are expected to start growing again in 2023–24.” Moderating price increases and higher real wages signal margin-absorbing jaws face corporate Australia in FY24.
Falling housing prices are also now a concern. The RBA boosted prices over the past two years and will now deflate them. Hopefully, the disruption to Australia’s economy is minimised, but don’t hold your breath given the mismanagement of monetary policy we have witnessed over the past year.
Uncertainty prevails on many fronts: rising interest rates, slowing global economic growth, and elevated geopolitical tensions. While rallies will continue, lower highs are more likely than new highs. The current bear market has not yet run its course.