The so-called Australian public infrastructure boom probably brings to mind a raft of high-profile transport infrastructure projects around the country. Think WestConnex, Sydney Metro, West Gate Tunnel, Bruce Highway, Inland Rail to name a few. Several ASX-listed companies are exposed to Australian construction spending. Here we mean industrials and/or basic materials companies with revenue from building or construction work, the supporting services and infrastructure maintenance providers. Infrastructure owners, such as Transurban with toll roads, are not exposed to the same underlying drivers.
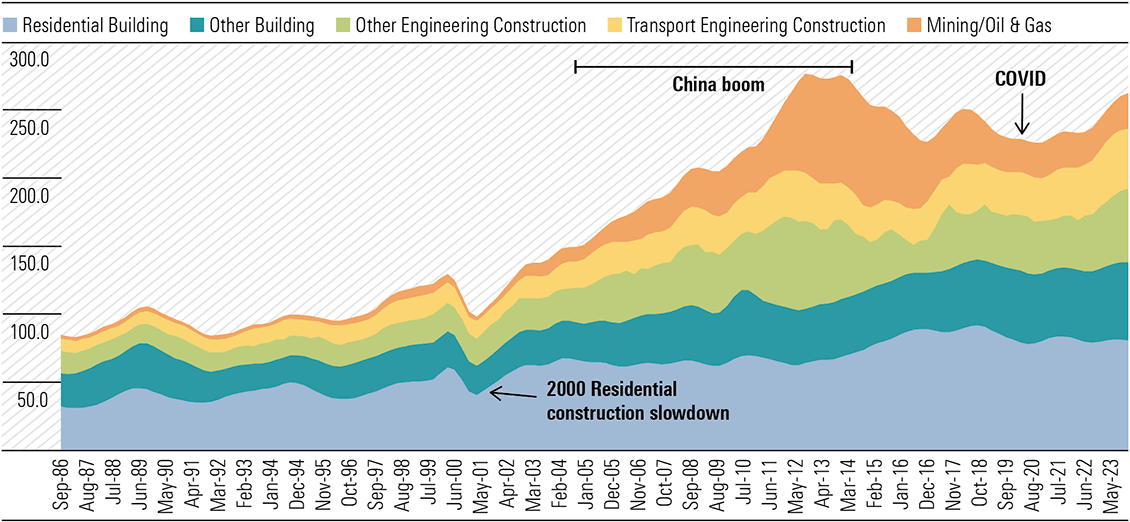
Many pundits think we are approaching a cliff for historically high construction spending, with the number of approved transport projects falling. But just how elevated is spending and how exposed are companies we cover to a drop? (Exhibit 1)
Exhibit 1: Trend value of Australian building and engineering construction AUD billion (real 2022)

Source: ABS, Morningstar
Starting with some basics, the chief division for construction activity is between building and engineering. Building is essentially anything with a roof, chiefly residential and commercial structures. Engineering is the balance and includes roads, highways, bridges, railways, water, sewerage, electricity, pipelines, telecommunications, and oil and gas and mining infrastructure. Maintenance expenditure is of growing importance and a separate category. While cyclical, building work tends to be steadier than engineering construction.
Where are we in the cycle?
In summary, the data suggests Australian construction spending overall is not exceptional, so we think the concerns of a bust are likely overblown. In real terms, expenditure is close to long run averages, both on a per capita basis and as a function of GDP, and well below 2013/2014 peaks. Particular segments like mining, oil and gas, and transport infrastructure will boom and bust, but other categories tend to grow or contract to accommodate these moves, perhaps reflecting limits to labour and capital overall. The China driven resources boom was an exception, attracting considerable foreign capital and labour.
We can also see upside potential from the current energy transition, which could herald another period of significant expenditure growth. The Net Zero Australia 2023 Report—University of Melbourne, University of Queenland, and Princeton University—estimates over AUD 2.0 trillion investment in Australian clean energy and infrastructure is needed over the next 10 years to achieve net-zero 2050 goals. But whether it can repeat the China boom remains to be seen, and that’s not our base case. However, there’s a decent case it can at least offset any potential spending retreat in transport infrastructure, or mining or traditional energy. Many companies are expanding their energy transition credentials in anticipation of the coming wave of demand. Examples include Worley Limited (ASX:WOR), Monadelphous (ASX:MND), Ventia Services Group (ASX:VNT), and Downer EDI (ASX:DOW).
Australian annual construction spend peaked around AUD 275 billion in 2013/2014 with the China-driven resources boom, according to the ABS. And while spending again grew from 2021, it is still below the 2013/14 inflation adjusted peak despite a 13% increase in population and 22% expansion in GDP.
We think it’s reasonable to contend construction-exposed companies have already survived a larger post China-boom decline in spending than is likely to occur from now. The peak in resources infrastructure spending, the region of darkest blue in Exhibit 1, is considerably larger than the transport infrastructure spending uptick, the middle blue region, now underway.
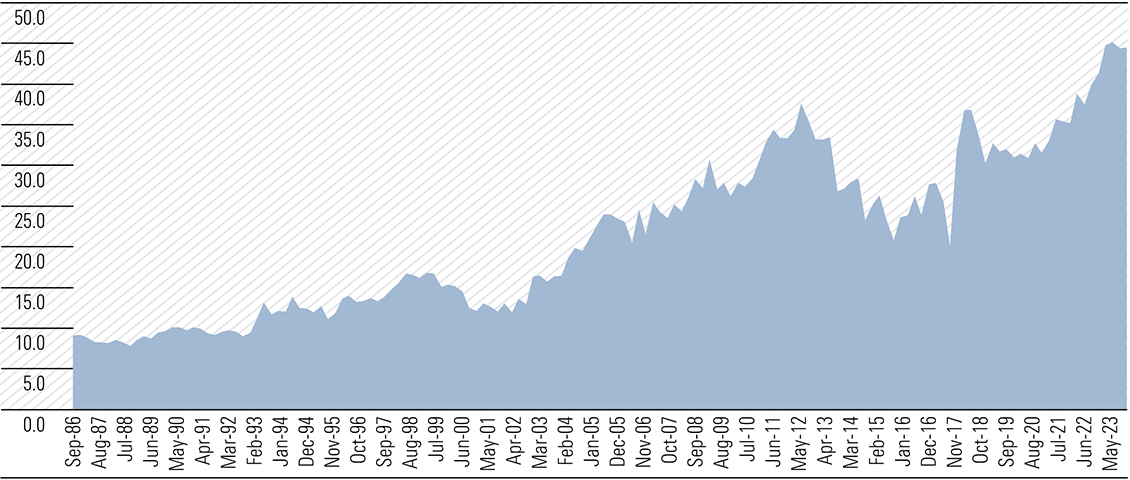
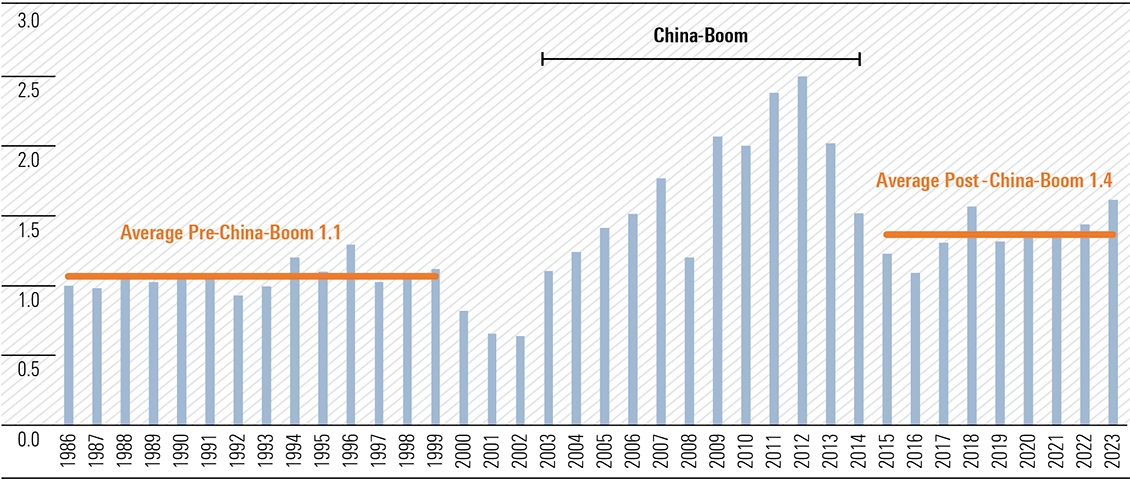
At around AUD 45 billion, Australian transport engineering construction expenditure is at record levels, excluding the China-boom which inflated private infrastructure spending such as on iron ore railways. Spending as a portion of GDP now is nearly 30% above levels prevailing prior to the China boom. While elevated, we don’t expect a drop off soon. COVID pushed out the timelines of major transport infrastructure projects underway and the spending plateau could extend for five years or so. Important also are high rates of population growth and catch-up from considerable under-investment. But if and when spending as a portion of GDP falls to pre-boom levels, we expect the impact on exposed companies such as Seven Group (ASX:SVW), ADBRI (ASX:ABC) and Boral Limited (ASX:BLD) to be relatively muted.
As the installed base of infrastructure grows, maintenance requirements grow and are increasingly important to company earnings.
Growing population and wealth will create both demand for greater and improved infrastructure capacity.
Companies have diversified exposures to construction spending in general and in our view are relatively adept at adjusting exposures as required. (Exhibit 2 & 3)
Exhibit 2: Australian transport engineering construction expenditure, AUD billion (real 2022)

Source: ABS, Morningstar
Exhibit 3: Australian transport engineering construction expenditure as a function of GDP (Index 1986 = 1)

Source: ABS, Morningstar
The energy transition could be massive
The elephant in the room is the energy transition, including that estimate that over AUD 2.0 trillion investment is required over the next 10 years. A simplistically assumed approximate annual spend of AUD 200 billion, or 15% of GDP, would dwarf current total engineering construction spend of around AUD 125 billion. Just AUD 20 billion, or 16%, is for electricity generation, transmission and distribution assets. Despite growing from an average nearer AUD 15 billion since 2008 it remains a drop in the ocean.
Energy transition spending at such a rate looks impossible given funding, labour and engineering capacity, not-in-my-backyard and environmental constraints. But even a fraction of that spend could underpin robust demand for at least a decade and growing revenues for exposed companies like Worley and Ventia, even if other categories like transport decline.
Our Top Picks
Four-star rated Ventia and Downer are our top picks of infrastructure exposed companies, albeit now solely as maintenance services providers. They benefit from the growing installed infrastructure base off the back of engineering and building construction expenditures, but don’t participate meaningfully at the construction stage. Downer recently sold out of the last of its mining businesses and similarly exited engineering construction activity. It derives around 55% of revenues from transport including roading maintenance/paving and manufacturing of rail rolling stock, 18% from services to the technology and communications sectors and 26% from facilities including for defence. Ventia was spun out of CIMIC and derives 42% of revenue from services to defence and social infrastructure, 24% from infrastructure services, 24% from telecommunications and 11% from transport. Ventia sees its maintenance services addressable market size increasing by almost 20% to AUD 88 billion in the next three years. Drivers are the size and growth of the installed asset base, population growth, increasing outsourcing rates, and the energy transition.
In addition to benefitting from growth in the installed infrastructure base, Ventia and Downer gain from the increasing rates of outsourcing of maintenance services activity. Maintenance markets are less exposed to inflationary pressures seen across construction markets and capital intensity is low. Most contracts favourably contain some form of embedded price escalation. Ventia has the highest forward yield of companies in our list, supported by repeat income and the low capital intensity associated with maintenance services.
Engineering construction and maintenance services provider Monadelphous is next on our list with a 3-star rating. It is the only company on our list which still participates directly in engineering construction activity with 27% revenue exposure. The 63% balance pertains to maintenance services chiefly to the resources industry. Maintenance work increases reliably as the installed base of infrastructure grows. Monadelphous’ exposure is chiefly to mining and oil and gas segments where value of maintenance work has nearly doubled over the last decade. This is separate/additional to engineering construction and building activity. (Exhibit 4)
Exhibit 4: Companies with material exposure to Australian construction

Source: Morningstar
Construction-exposed but expensive at present
There are a number of other construction-exposed companies where a better entry price would be welcome. Industrial conglomerate Seven Group has the highest revenue exposure of all but is a fan-favourite and we think too expensive. Its WesTrac business sells and services Caterpillar heavy equipment to the mining and construction sectors, Coates Hire rents construction equipment, and its 72% owned construction materials specialist Boral supplies aggregates, cement and asphalt. Seven Group has a live takeover offer underway for the balance of Boral it doesn’t already own.
There are also a number of predominantly building exposed companies. Cement, lime, concrete and aggregates comprise around 90% of revenue for ADBRI, currently under takeover offer from CRH PLC (NYSE:CRH) and Barro Group. Not on our list given 90% of revenue derives from offshore, 2-star rated Worley is ideally placed to provide high value services to the energy transition but is expensive.
 Morningstar


