In last week’s overview, we dissected S&P/ASX 200’s performance for the June-quarter and summarised our near-term projections for all the major sectors of the index. If you haven’t seen it, you should—if only to see the photos of our equity analysts, most of them bearing little resemblance to what we currently look like.
From two weeks’ time, we will get to see if actual company earnings justify equity market’s remarkable resilience, and whether corporate Australia’s outlook statements can further propel the index from current near record highs.
That is because the reporting season will kick off on July 29. Report cards for ASX-listed companies for the six-months ended June 2024 will flood the market. Hyperventilating headlines will light up the financial press and digital airwaves. Snap judgements and investment recommendations will compete with “how to lose weight while eating 2 burritos a day” tips on social media. And stock prices will gyrate in response.
Having been through over 50 earnings seasons, here are three ways I recommend long-term investors to cut through the noise and make the most of this bi-annual bedlam.
Happiness = Results − Expectations
Ever wondered why a seemingly strong earnings result is sometimes met with a shocking stock price drop? Or you hear a company guiding to a 25% slump in profit next year, but its stock price is up 15% in response?
It is all to do with consensus earnings expectations heading into the result. In a world of relativities, people want a reference point against which a result or a profit guidance can be judged. In stock investing, that reference point usually comes in the form of: (1) management guidance, or (2) the majority view of the analysts assiduously following that company (aka consensus).
There is whole industry that deals with consensus, in terms of its gathering, packaging and managing. In fact, there is an army of investor relations professionals out there, nudging analyst expectations one way or another, depending on how earnings are tracking—just so that their company stock prices don’t behave like a two-dollar yo-yo come the day of the result.
As an investor, it is useful to be aware of these market expectations during earnings season. Not only does it put some sense into stock price behaviour post results announcement and outlook, but it serves other critical purposes. In the case of judging a result by reference to company guidance, it sheds light on how good management is in assessing and predicting operating conditions, how well it has its arms around the business and factors within its control, and how it deals with uncertainties.
In the case of consensus estimates, knowing them allows investors to take advantage of short-term mismatches between market expectations and sustainable earnings delivery. A company that has consistently delivered 10%-plus EPS growth over a long period may report 5% growth one year and suffer the wrath of a market that has been conditioned otherwise. But that stock price correction could be an opportunity for long-term investors, especially if the reason for subpar growth was to reinvest to solidify the company’s competitive position and prolong its earnings growth trajectory.
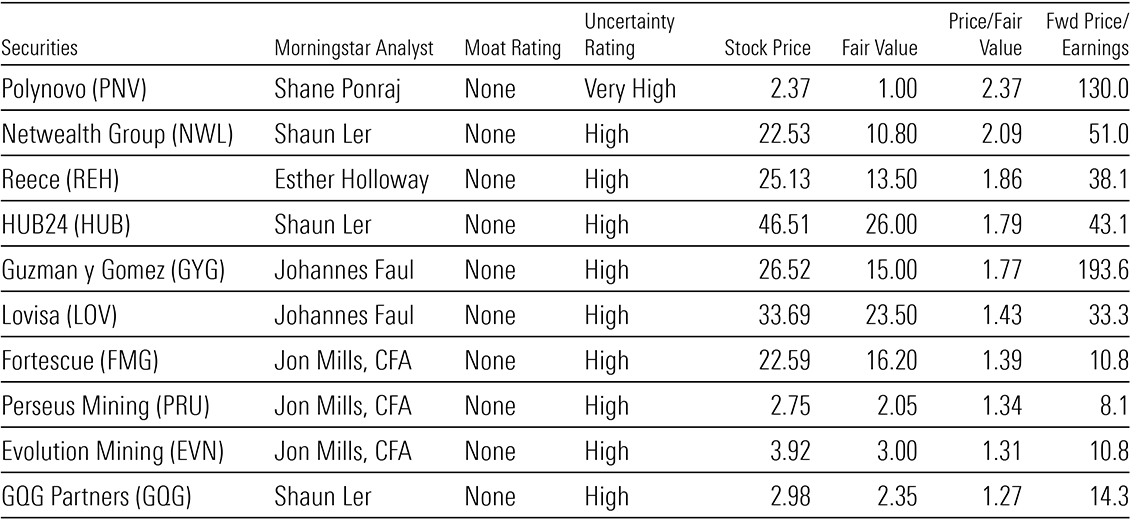
In Exhibit 1, we highlight ten most overvalued (as measured by their premiums to our fair value estimates), no moat-rated companies under our coverage with the highest fair value uncertainties. We see their high stock prices as perhaps reflective of hyper consensus expectations and, therefore, susceptible to a correction.
Exhibit 1: Ten most overvalued, no-moat, high-uncertainty rated stocks under our coverage

Source: Pitchbook, closing prices on July 16, 2024.
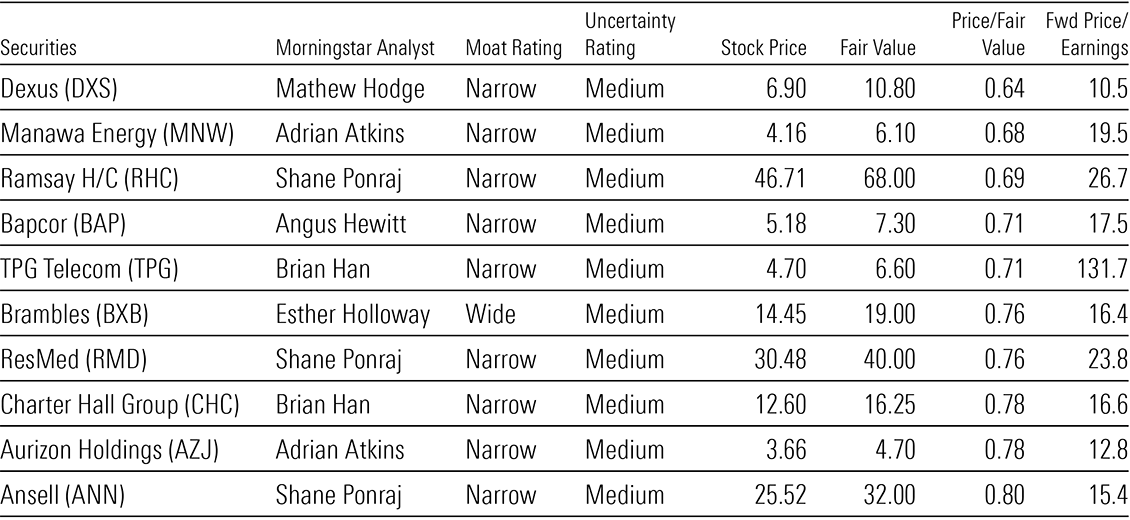
Conversely, in Exhibit 2, we highlight some high-quality, moat-rated companies whose stock prices show very low market expectations relative their midcycle earnings potential. And when expectations are low, happiness is more easily achieved.
Exhibit 2: Ten most undervalued, moat, medium-uncertainty rated stocks under our coverage

Source: Pitchbook, closing prices on July 16, 2024.
Quality over quantity
Westpac Banking Corporation’s fiscal 2024 interim financial report was 141 pages. Fair enough. It’s a big bank with many units and moving parts. But the results presentation and Investor Discussion Packs slides—meant to summarise the key drivers of operating and financial performances—also ran to 121 pages! The fetish for figures and slides is not confined to large companies. Coast Entertainment, a $220m market cap company that operates just a theme park and an observation deck on the Gold Coast, produced a 31-page presentation deck to supplement its last interim financial report, as well as a 3-page media release as an accompaniment.
Such information dumps may be a godsend to anal analysts and fussy fund managers who love getting into the weeds and adding to their formidable 5,000-line, 20-tab financial models. But for investors who don’t want to lose the sight of the forest for the trees, there are some quality-checks you can do on the results day, while you wait for the experts to generate the detailed research in due course.
One, go straight to the Statement of Cash Flow in the financial report, find “receipts from customers and recurring sources” and subtract “payments to suppliers, employees and others”. Compare the result to reported EBITDA. If the calculated cash inflow is materially lower, zero-in on the reasons why. In the process, you’ll likely be met with many different versions of EBITDA (adjusted, normalised, underlying, before-the-dog-ate-it). It’s not exactly straight forward, but have fun delving into them. See if the reasons for the discrepancy between operating profit and operating cash flow are reasonable (usual working capital changes) or suspect (unusual revenue/expense recognition).
Two, you can follow this cash flow thread further and see how much the company spent on capital expenditures, compared to the previous period (for example, in terms of capex/sales). If there is a big change, again, delve into it. You don’t want a company skimping on capex to compromise future earnings power. But you also don’t want any unnecessary gold-plating. Then keep going—see how management allocated the resulting net cash flow (after capex). How much of it was spent on acquisitions, dividends, debt retirement or share buybacks? What have all these allocation decisions done to the company’s indebtedness, shareholder returns, and future operating and financial sustainability?
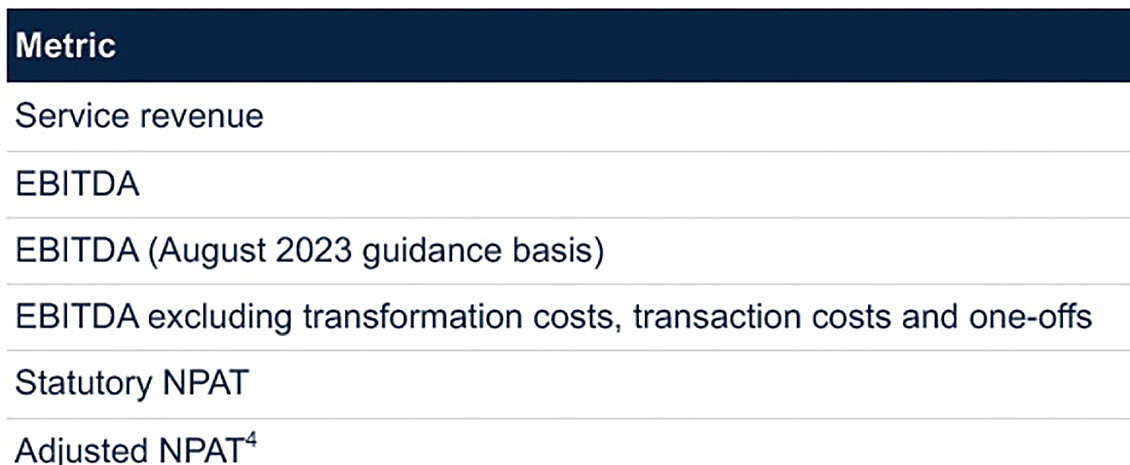
Three, compare the REPORTED net profit in the financial statement to the creatively labelled “adjusted”, “normalised”, “underlying” net profit littered throughout the unaudited presentation slides (see Exhibit 3 as an example).
Exhibit 3: A real-life example of a company with different versions of earnings (company identity and figures removed)

Source: Company presentation
Invariably, the reconstituted net profit will be higher than the reported net profit. In the process of investigating it, you’re likely to be bombarded with the terms “abnormal” or “one-off”. Delve into these reasons and see if these abnormals and one-offs are anything but, by looking at the company’s financial history.
Treat this as an exercise to gauge the quality of a result, and as a starting point to “proactively look” for information in presentation slides, rather being bamboozled by them in accordance with management’s agenda.
Assume bad intentions
One of the more entertaining, yet futile, aspects of earnings seasons are the conference calls that companies host to discuss their results.
Entertaining because nothing is funnier than analysts who profusely congratulate management on a good result, and proceed to ask questions which sound more like: (1) a dissertation of his knowledge and experience and/or (2) a demonstration of his close bond with management.
Futile because, in many instances, management spends 50% to 75% of the conference reading out what’s already written on the slides, dictating what it wants to communicate and restricting what investors want to know. Worse still, there are many companies that release prepared speeches to the ASX prior the conference calls, and their senior executives then proceed to read them verbatim during the call for 30 minutes to one hour! We kid you not!
As such, do away with at least the first half of any earnings call—we don’t need management to treat us like we’re in kindy. Instead, focus on the subsequent Q&A section. Pay attention to how management answers questions. Not Dorothy Dixer questions analysts ask so they can hear their own voice, let the management know they support the company and let their fund manager clients know they’re working. But questions real investors ask because they are genuinely interested in the company’s earnings drivers, cash flow movements, capital allocation and operating strategy.
Perhaps you may even want to ask a question yourself for fun, for example, “Thank you for the opportunity to ask a question. My question is: why are your one-offs and abnormal items always negative? And have you ever classified exceptionally good weather as a one-off positive item to be excluded from underlying EBITDA?”
Earnings seasons are chock full of noise. And companies make matters even more overwhelming by massaging their messages and figures, bedazzling audiences with fancy jargon and MBA-speak. It is the job of professional analysts and fund managers to wade through this information jungle and pinpoint what’s important to determine the intrinsic value of companies.
However, ordinary long-term investors can also actively participate in earnings seasons, without getting lost in the weeds. Focus on a few key areas and let your curiosity dictate how you navigate the mountains of information provided, rather than letting companies distract you with theatrics and minutiae.
 Morningstar


