
Four investors walk into a bar and start having an active discussion about the state of the global economy and markets. The debates were almost as noisy as the group playing a game of darts next to them.
One of the patrons sitting nearby couldn’t help eavesdropping on the discussion and made his way over to the group. The investors were visibly shocked and surprised to see this character wishing to join their company.
The four investors introduced themselves to the new patron as Annie, Bridget, Charlie, and Don. The patron introduced himself as Mr. Market.
Naturally, the investors couldn’t hold themselves back from asking Mr. Market for his perspective on their discussions about investing. The group was debating which one of them would be right about the future.
Mr. Market understood that investors have different views of the markets and global economy, but he wanted to show them some simple tricks to navigating rocky markets.
The group then asked Mr. Market a few questions.
How often does Mr. Market go down?
That is purely dependent on the time horizon or investment period used to measure it.
History has shown that the potential for a negative return diminishes as the time horizon gets longer. The longer the frame of measurement, the more time for an investment to compound its returns.
The chart below illustrates this concept using the past 30 years of returns over different time horizons.
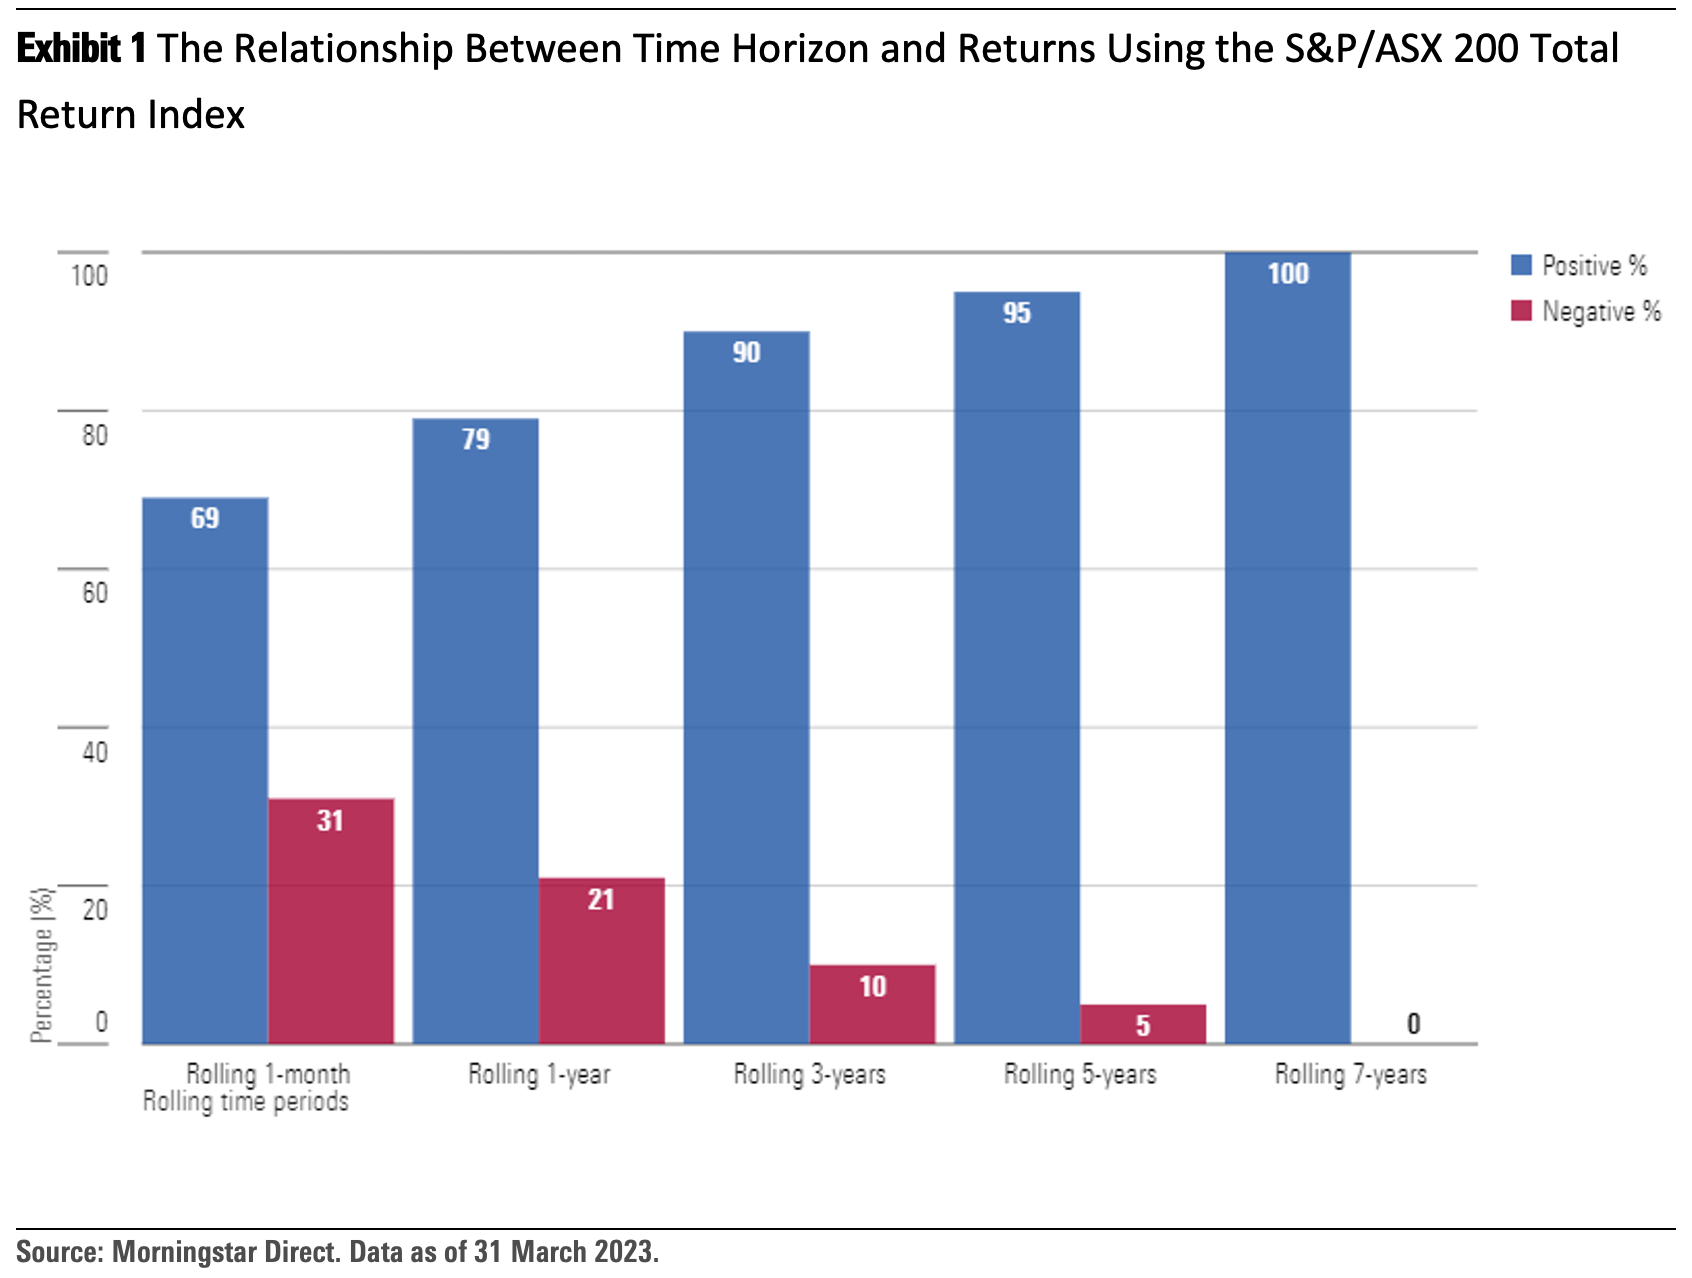
The link between the investment horizon length and the potential for negative returns is quite apparent, especially over the seven-year rolling period—there were no negative returns over any rolling seven-year period in the past 30 years. We do not have certainty that any of the future seven-year rolling periods will be positive, but it does illustrate the historical link between the investment horizon and positive returns.
What drives growth in the market over the long term?
The market is made up of companies that are producing and selling a product or service.
Companies that are well-run and well-capitalised to reinvest in their businesses have a higher chance of success over time.
These companies produce earnings, which in turn create the cash flows for growth and dividends for shareholders.
This is what drives equity returns over the long term: earnings and dividends.
The companies that fail to grow are the ones that leave the market over time. The paradox is that investors are generally more tempted to sell when markets go down, while tempted to buy after seeing markets going up.
How often does cash beat Mr. Market?
This choice of being in and out of the market is an active one, but so is deciding to remain invested for the long term, which is often the more difficult choice to make.
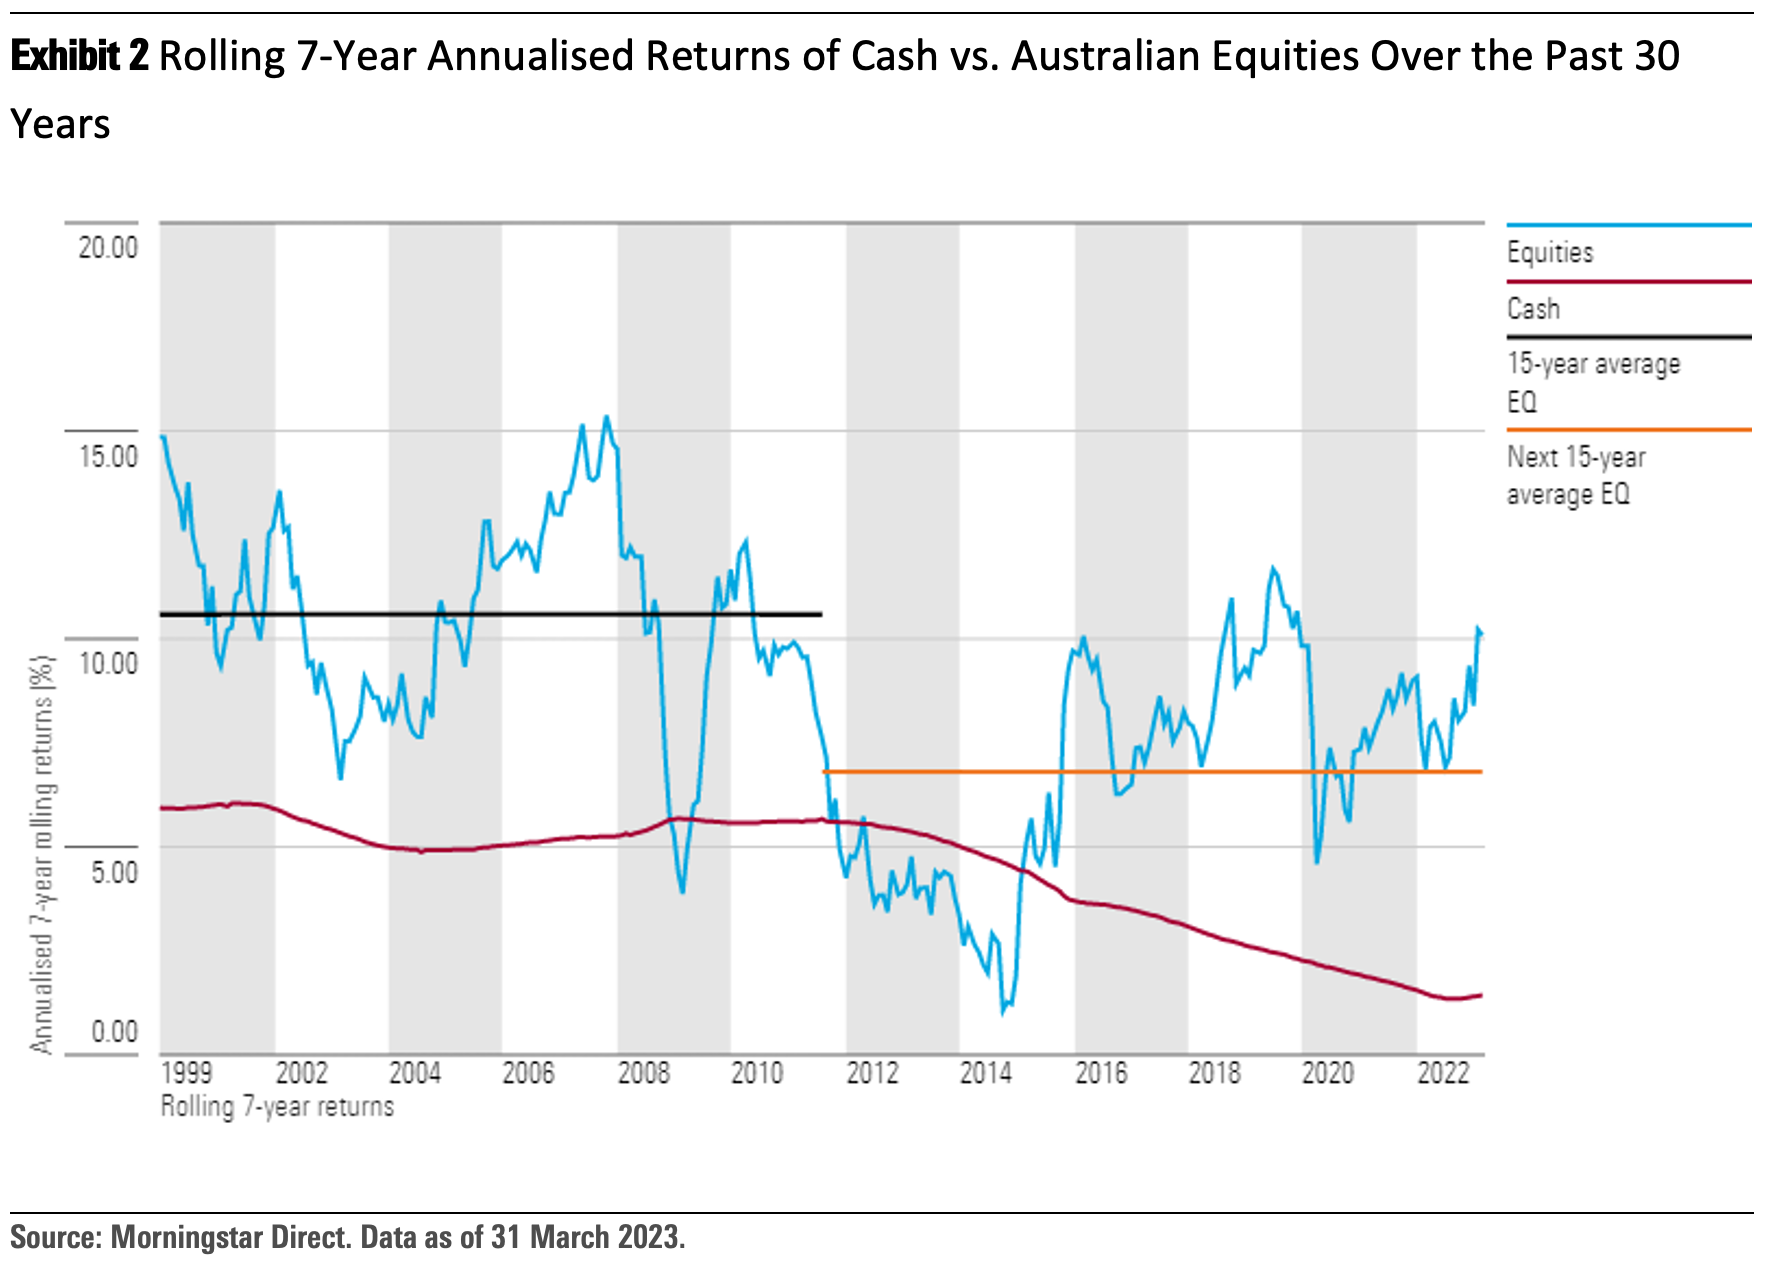
Over the past 30 years, Australian equities have outperformed cash in 85% of the rolling seven-year periods, as shown in the chart below.
Why should a 30-year time frame be considered? What are the compounding effects?
First, the average age of members across the superannuation industry is 45 years old.
Though the retirement age is 65 years, people are living much longer today than they ever were. This 30-year horizon is crucial in determining how they retire comfortably.
Second, society is undergoing the single largest wealth transfer in history as the baby boomer generation leaves some or most of their wealth to the millennial generation.
Millennials are between 27 and 42 years old. This also fits the concept of the 30-year horizon. What are the compounding effects over this period?
As we showed in the chart above, the average return of the first 15 years of seven-year rolling returns was 10.50%. The next 15 years’ average return was 6.75%.
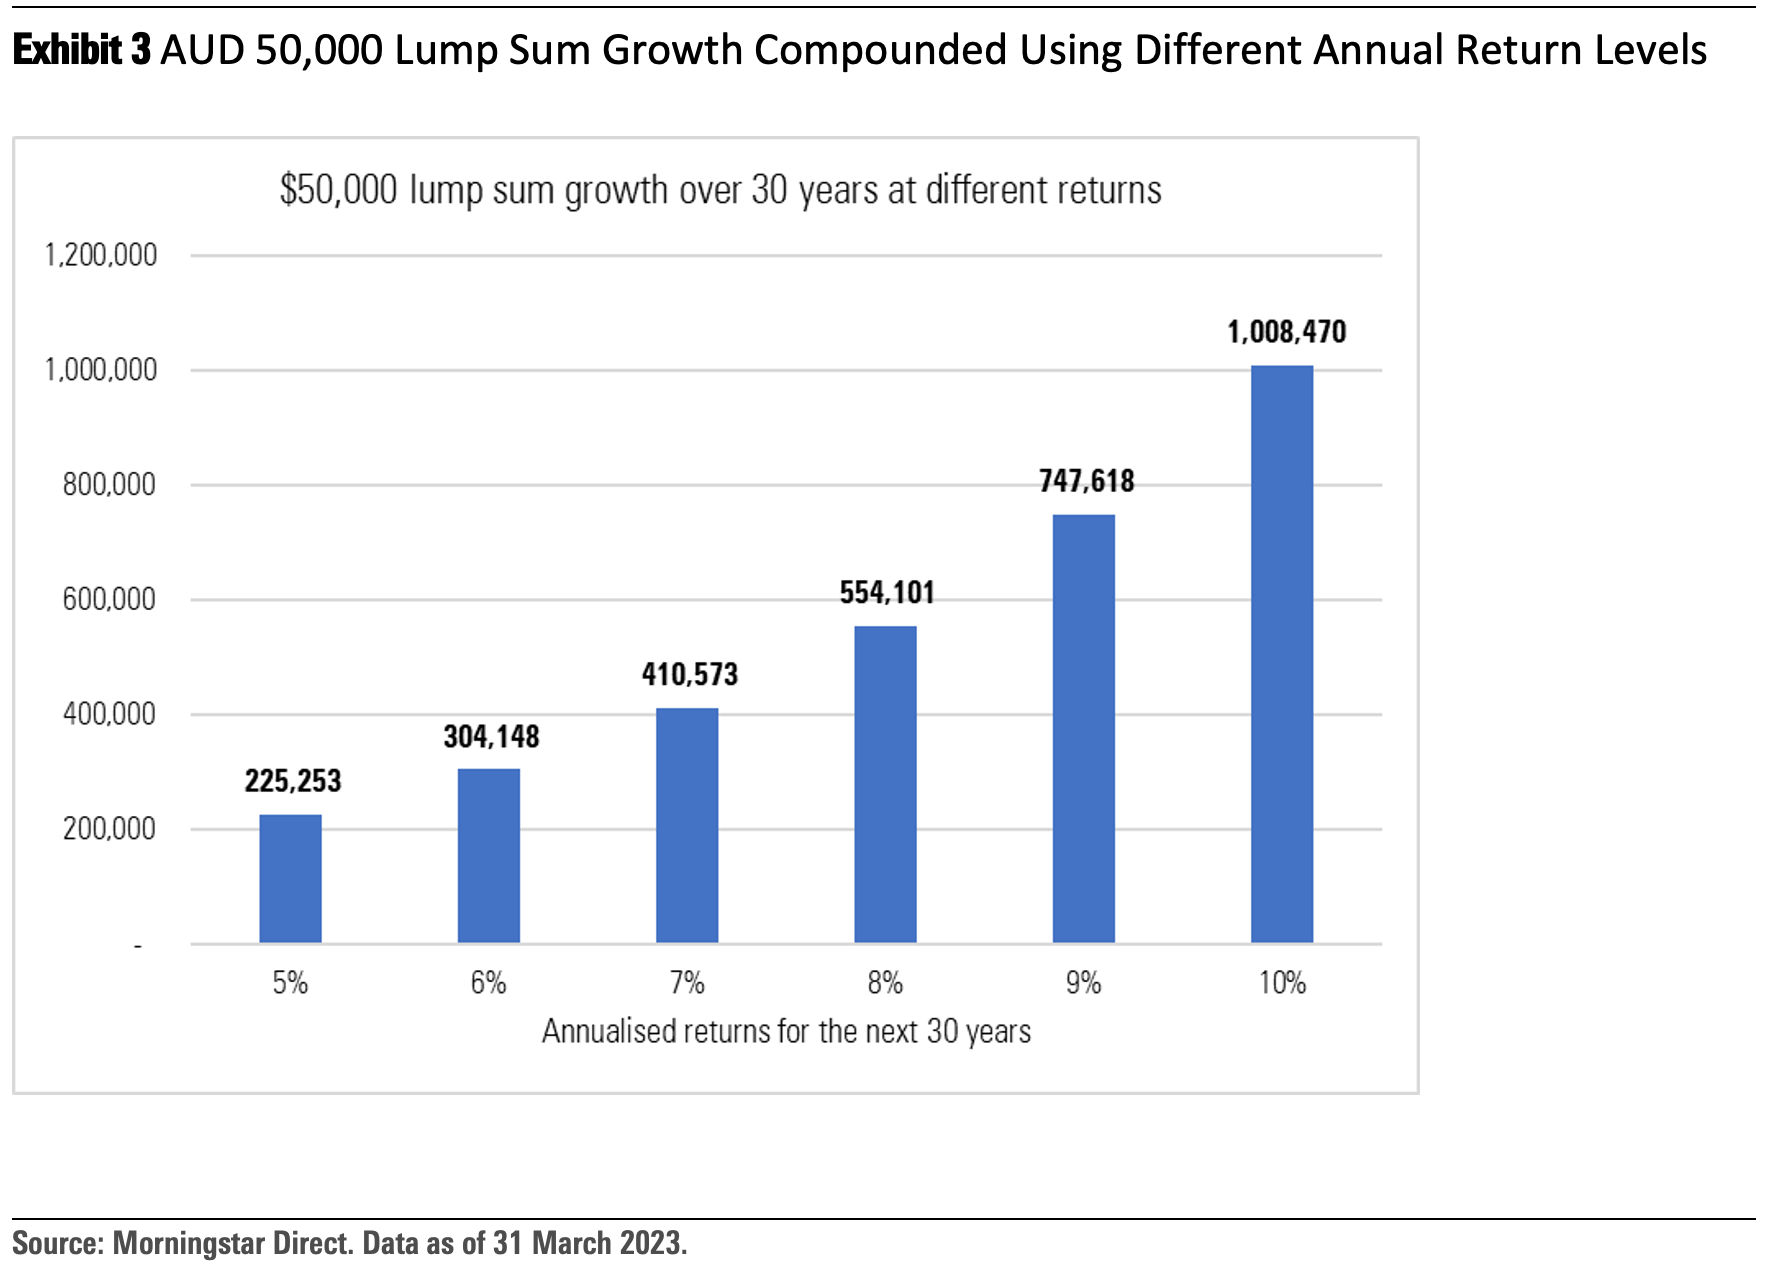
We can’t predict the future, but we can model a few scenarios and their outcomes:
Warren Buffett had a net worth of USD 34 million (yes, million) at age 43.
After almost 50 years of compounding and staying invested, at age 92, he’s worth USD 113 billion—even after donating USD 111 billion along the way.
Key takeaways
- Investing for the long term and staying the course is a key tenet to achieving wealth-generation objectives.
- The compounding effects over long periods of time are phenomenal.
- The possibility of negative returns diminishes as the time horizon gets longer.
- Historically, Mr. Market has delivered positive returns over long periods of time, despite his unpredictable temperament on any day.
- Companies invest for growth and require time to deliver value to shareholders. Successful companies generally become larger over time, and the ones that fail are taken out of the market.
What do our four investors think? Armed with these insights, they wanted to understand from Mr. Market how to time the market better.
They wanted to understand what they could do in terms of their buying and selling decisions through time that would produce better results.
“Mr. Market’s job is to provide you with prices; your job is to decide whether it is to your advantage to act on them. You do not have to trade with him just because he constantly begs you to.”
—Benjamin Graham
In part two of ‘4 Investors Walk Into a Bar’, we’ll find out who wins versus Mr. Market.