Client portals are a huge opportunity for advisers to engage clients and better protect their security.
In less than three minutes, find out how client portals can help advisers from Morningstar Australia’s Head of Business Development and Strategy, Peter Bryant.
The following user guide is for Morningstar Direct users to be able to download their model portfolios that can be easily imported into Morningstar’s Portfolio X-ray tool on Adviser Research
Centre and AdviserLogic.
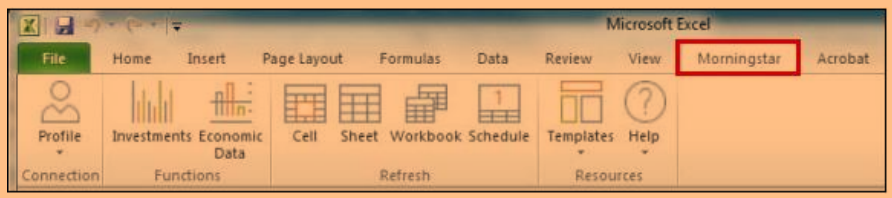
1) Ensure you have installed the Morningstar Excel Add-In. If not already downloaded, please go to Home module of Morningstar Direct, click Excel Add-In and click download latest
version. (as below)
Follow the Setup Wizard prompts in Excel.

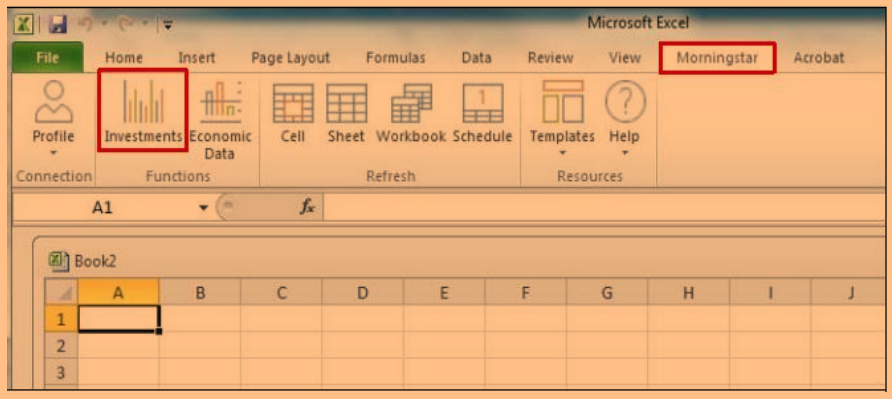
2) To log in to the Morningstar Excel Add-In, create a connection with Morningstar Direct:
- In Excel, select the Morningstar tab.
- If Morningstar Add-In dialog box does not open: click Profile, then select Direct.
- If applicable, enter your login details for Morningstar Direct.
- For any further troubleshooting of accessing the Morningstar Add-In, please go to the Morningstar Excel Add-In user guide that is available in Downloads section. (as above image)
3) Ensure your model portfolios are saved via the Portfolio Management tool.
To create a spreadsheet of your model portfolio, open excel, click Morningstar and then the Investments icon.
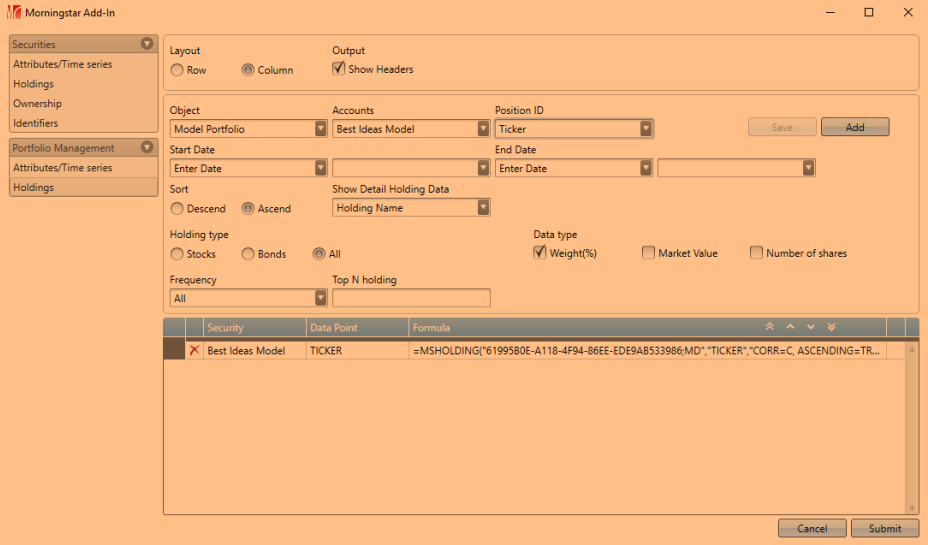
4) In the navigation pane, under Portfolio Management tab, select Holdings.
- Change Object to Model Portfolio and select your Model Portfolio name under Accounts.
- Change Position ID to Ticker. Then click Add.
- Finally click Submit.
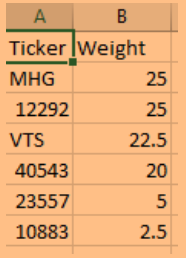
5) Your model portfolio will be displayed in the spreadsheet.
- Save your new spreadsheet as CSV.
- Delete the column “Name”. To leave Ticker and Weights only.
- You now have the complete model portfolio exported from Morningstar Direct that can be imported into Portfolio X-Ray.
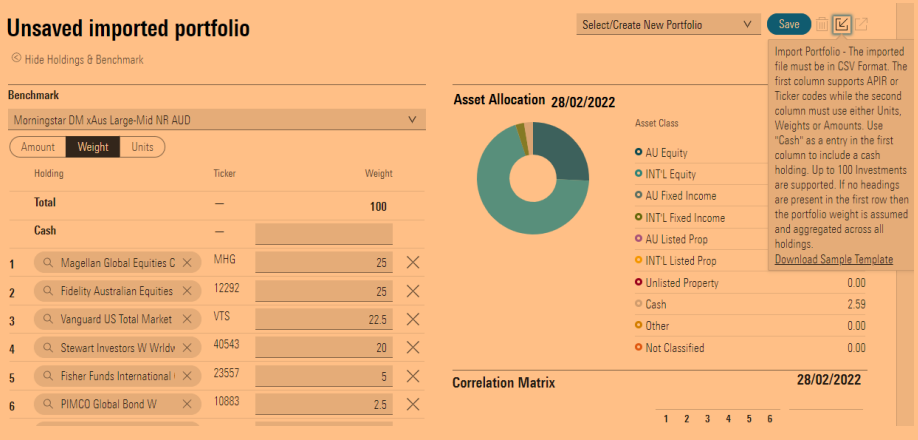
6) Import your saved spreadsheet into Morningstar’s Portfolio X-ray tool.
The tool will automatically upload with the balances saved from the spreadsheet.
7) Bonus step:
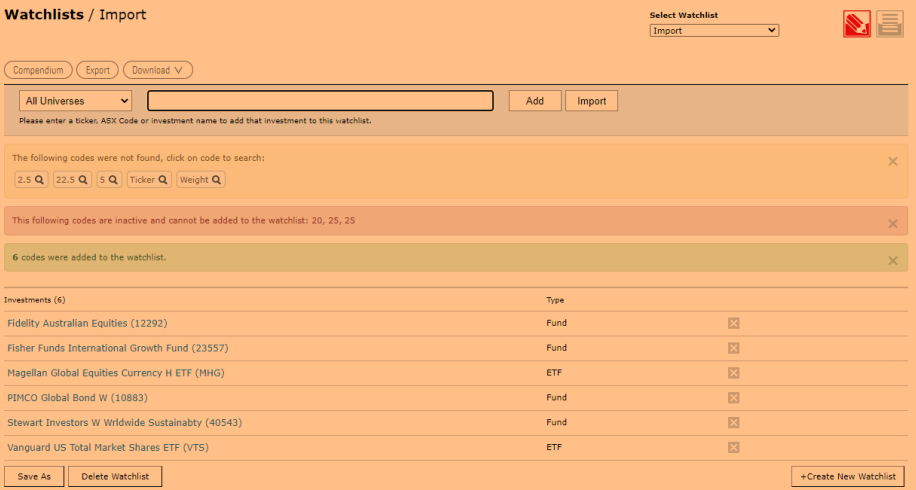
Users of Adviser Research Centre can import the same spreadsheet into My Watchlists using the import feature. This will add the investments to the selected portfolio, or you can create a new watchlist and import to, providing easy access to the latest research reports for each asset.
Asset Flows to Australian Sustainable Investments Slow in First Quarter 2022
The first quarter of 2022 saw sustainable assets under management decline a little, despite net positive flows, largely because of macroeconomic headwinds that included inflationary pressures, rising interest rates, and market volatility. Retail assets invested in Australasian-domiciled sustainable funds as identified by Morningstar totaled AUD 37.988 billion at the end of the first quarter 2022, which was an 8.59% decline from the previous quarter. The recent market conditions have been difficult for sustainable investors. Many sustainable strategies tend to underweight or not hold the energy sector, which has performed well, and they have been negatively impacted by exposure to technology stocks, which have undergone recent downward pricing pressure after a sustained period of strong performance growth. Despite these short-term market challenges, sustainable assets globally have been more resilient when compared with the broader market. This quarterly paper highlights recent trends within sustainable retail investments in Australia.
Key Takeaways
- At the end of first-quarter 2022, assets invested in Australasia-domiciled sustainable investments were AUD 37.988 billion, equating to an 8.59% decrease compared with the quarter ended 31 Dec 2021.
- Whilst net inflows into sustainable funds remained positive, the decline in overall total assets reflects volatile market conditions. The decline in sustainable investments’ asset values is not unique to Australasia, similar trends have occurred globally. Despite this difficult quarter, total assets invested sustainably have experienced a 41% increase compared with the first quarter of 2021. Further, assets invested in Australasia-domiciled sustainable investments more than doubled in the two years since 31 March 2020.
- Estimated first-quarter flows of AUD 1.122 billion were substantially lower than the previous record- breaking quarter, fourth-quarter 2021, equating to 68% less. Whilst flows were positive, weaker inflows are a trend we observed globally this quarter. Despite this, sustainable funds’ inflows have held up far better than their conventional peers.
- Fifty-two percent of sustainable investments with five-year track records outperformed their peers within their respective Morningstar Categories. This is encouraging for investors looking to build environmental, social, and governance portfolios that align with their values, knowing that they won’t sacrifice returns when compared with investments in mainstream funds.
- In the immediate-term, sustainable funds faced an extremely challenging first quarter, with only 26% of sustainable funds outperforming their peers within their respective categories. Performance of the broader market provides context; the S&P/ASX 200 Resources Index was up 15.4% for first four months of calendar-year 2022, compared with the broader S&P/ASX 200 Industrial Index, which had a performance outcome of negative 2.2%. With the rally in oil and gas prices, the S&P/ASX 200 Energy Index was up 31.8% year to date. Sectors that ESG strategies have traditionally favoured, such as healthcare and technology, performed particularly poorly. The S&P/ASX 200 Healthcare Index was down 8.0% over the same period, and the S&P/ASX 200 Information Technology Index was down 22.7%.
- Sustainable investors should expect short-term fluctuations compared with the broader market as portfolios will tend to have certain structural biases in order to meet their sustainable objectives.
- Morningstar has identified 150 Australasia-domiciled (Australia and New Zealand) sustainable investments through our intentionality framework. Of these, 118 employ some form of exclusion from investment in controversial areas, with a high number of funds excluding tobacco (110) and controversial weapons (103 companies that derive a significant portion of revenue from nuclear weapons, land mines, cluster munitions, and so on).
- Compared with Europe and the United States, the sustainable funds market remains relatively small in Australia. No new funds were launched in the first quarter.
- Six fund houses dominated first-quarter flows, with Dimensional (AUD 333.67 million) atop a group that included Vanguard (AUD 262.95 million), Australian Ethical (AUD 216.47 million), BetaShares (AUD 170 million), Alphinity (AUD 118.03 million), and Nanuk (AUD 97 million). All these fund houses apart from Alphinity and Nanuk have multiple sustainable investment options contributing to total flows.
- When it comes to sustainable investing, active strategies are favoured over passive, although in the first quarter of 2022 the passive/active allocations were more evenly distributed, with 53% of flows going to active sustainable funds. When looking at total assets invested, 70% of assets are invested actively.
- The Australian Securities and Investment Commission has identified climate-related disclosures for listed companies and greenwashing as part of their corporate governance priorities in 2022.
- As stated in a recent global research report “Investing in Times of Climate Change 2022,” beyond Europe, China, and the United States, Morningstar categorises all other countries as “rest of world.” Australia has the most assets invested in climate-related funds in this rest-of-world category, with USD 2,447 million across 18 funds.
Product Launches
Compared with Europe and the US, the sustainable funds market remains relatively small in Australia. There were no new sustainable funds launched in the first quarter of 2022. However, a total of 17 funds were launched in 2021. As of 31 March 2022, Australasian retail investors had access to 150 Australasia-domiciled sustainable funds.
Exhibit 1 Australasia-Domiciled Sustainable Fund and ETF Launches
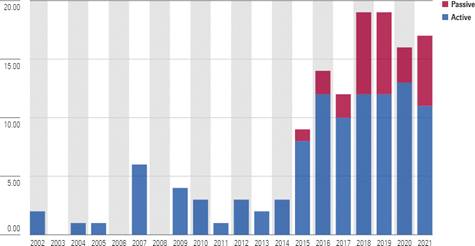
Source: Morningstar Direct. Data as of 31 March 2022.
Despite the lack of new funds launched to date in 2022, the momentum of sustainable fund launches has lifted significantly since 2015. Product launches are typically slower during first quarter of the year, and this metric doesn’t capture asset managers repurposing and rebranding conventional products into sustainable offerings. Finally, the sustainable funds universe does not contain the growing number of Australasian funds that now formally consider ESG factors in their security selection.
Despite the lack of new funds launched to date in 2022, the momentum of sustainable fund launches has lifted significantly since 2015. Product launches are typically slower during first quarter of the year, and this metric doesn’t capture asset managers repurposing and rebranding conventional products into sustainable offerings. Finally, the sustainable funds universe does not contain the growing number of Australasian funds that now formally consider ESG factors in their security selection.
Asset Flows
Exhibit 2 Estimated Net Flows of Australasian Sustainable Investments (AUD, Mi
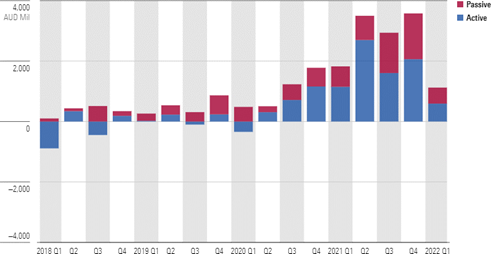
Source: Morningstar Direct. Data as of 31 March 2022. Excludes funds of funds.
Click here to download the Sustainable Investing Landscape for Australian Fund Investors Q1 2022 report.
Oil and gas, and to a lesser extent wheat, have dominated the headlines and financial markets since the invasion in February.
With the market’s attention firmly on inflation and central banks, it is time to turn our gaze to the other two major issues weighing on the outlook. China and the war in Eastern Europe. First to China.
China’s economic transition and the likely extension of Xi Jinping’s role as undisputed leader are vital issues for investors. Beijing will host the 20th Party Congress in November and it will determine who leads China for the next five to 10 years; how powerful Xi is; and the policy trajectory to be followed for the next five years.
Rosenberg Research postulates Xi will stay in office for a third term and emerge more powerful than ever. A succession plan or a successor is not in sight. The proliferation of ‘Xi Jinping Thought’ is widespread through government, state-owned enterprises, and elementary schools. Some suggest the emphasis Xi has already outlined for goals in 2035 could see him in power for three more terms, pulling stumps after five terms in 2037 at the age of 84. In 2032, after four terms Xi would be 79. To put this in context, President Joe Biden is 79 and Donald Trump 75. In 2032 they would be 89 and 85, respectively. Who would be the sharpest tool in the shed?
The transition currently underway is based on the “dual circulation” strategy, which was first aired in 2020 as the rift with the US widened. It was a key priority of the 14th Five Year Plan (2021–2025) and embraces “internal circulation” and “external circulation” to deliver growth based on quality rather than quantity. It aims for slower but more sustainable growth driven by lifting domestic demand in the 1.4 billion population, with a focus on a rapidly growing middle class of over 400 million.
Meaningfully lifting domestic demand faces headwinds from the current deleveraging of the economy and an ageing population. Deleveraging will impact the level of consumer demand. Similarly, the rate of consumption fades as the consumer ages. The combination will have an impact on total demand, but it is unlikely to be terminal.
China’s economic rebirth, which was kick started by Deng Xiaoping’s reforms in the 1980’s, saw China’s share of global GDP lift from 2% at the end of Mao’s regime in 1977, to 4% in 2001. China gained admission to the World Trade Organisation in 2001 and just over a decade later, by the time Xi began his first term in 2012, China’s share of the world’s GDP had surged to 12%. In 2019, China reached 16% of global GDP but the trade war with the US and other allies along with the outbreak of COVID-19 derailed the goal of 20% by 2021, the Centenary of the Republic of China.
The migration of 60% of the population from the agricultural regions to newly built cities and the rapid growth of the middle class has caused some indigestion. The massive investment in infrastructure required by the transformation from an agricultural economy to an industrialised powerhouse has been so large that diminishing marginal economic returns have set in. The “dual circulation” strategy, with a focus on “internal circulation” is designed to lift the productivity of labour and capital by moving both higher up the production value chain underpinned by increased investment in advanced technology. The aim is to lift the value of output, thereby lifting GDP. Wages would be higher, which would increase household income, drive domestic consumption, and close the GDP per capita gap with developed nations.
Xi’s long-term plans envision China reaching 25% of global GDP by the centenary of the founding of the Chinese Communist Party in 2049. He may not be around, but there is nothing wrong with a long-term vision, something the democracies cannot match given the political self-interest and short-term nature of governing tenures.
The risk of policy change remains high as evidenced by recent regulatory moves in the real estate and big-tech arenas. So, perhaps the developed economies should plan for a more insular and self-reliant China in the decades to come, with a bias toward quality growth, rather than sheer quantity. While renewable energy investment is also a key part of the strategy, China plans to build 150 nuclear reactors by 2030, more than what the rest of the world has built since 1985.
Three chokepoints in the Russian/Ukraine conflict
Oil and gas, and to a lesser extent wheat, have dominated the headlines and financial markets since the invasion in February. The disruption has already been meaningful, but here are more issues under the surface that could have widespread impacts on commodity and financial markets. Recent Credit Suisse research provides some insight into these issues, which is summarised below.
Chokepoint #1—Southern Ukraine and neon gas
A little-known fact: Ukraine has three steel plants producing neon gas as a byproduct of air separation and steelmaking. The bigger the plant the more neon produced. Ukraine’s three biggest plants are Azovstal, Zaporizhstal and Ilych.
Three quarters of the world’s neon is used in chipmaking, where it powers high precision lasers in a vital process known as lithography. Two of the world’s largest neon gas manufacturers are in Ukraine and supply half of the world’s semiconductor grade neon. Russia’s campaign in Southern Ukraine gives it control over steel plants, air separation and neon production. Half the world’s neon supply could be under Russian control shortly in an already tight market. No neon means no chips worsening the existing chip shortages with significant knock-on effects to manufacturing in developed economies. Semiconductor chips are also used in sophisticated military equipment. Does Russia’s focus on the Donbass have a neon dimension?
Chokepoint #2—Moving the neon
With widespread sanctions in place, neon will go by road to China and then get shipped to chipmakers in Japan, South Korea, and Taiwan.
Chokepoint #3—Russian oil
All Russian oil exported to Europe is transported by sea and sanctions could eventually mean Russia is forced to turn off daily production of 7 million barrels. One turned off it will be difficult to resume production quickly. Releases from Strategic Petroleum Reserves (SPR) and China’s reduced demand due to lockdowns help. But SPRs are finite and lockdowns temporary.
Even if sanctions are avoided, transport problems abound. Euronav, the single largest owner of very large crude carriers (VLCC) has suspended shipments of Russian oil, threatening a shortage of the VLCCs required for seaborne trade.
India has increased its imports of Russian oil and the volume of Russian oil on the water has increased since March. However, Russia’s exports are likely to reduce by at least 3 million barrels per day.
Combine shortages of oil, natural gas, refined products, VLCCs, neon and chips and you get a very messy world.
Financial markets will not take a ‘gung-ho’ attitude while uncertainty is at elevated levels. This uncertainty is likely to last months rather than weeks. And all this is without discussing inflation, central bank tightening, China’s lockdowns, and the implications of slowing global growth.
US inflation
The annual rate of headline inflation as measured by the Consumer Price Index (CPI) eased from 8.5% in March to 8.3% last month. The core rate also drifted down from 6.5% to 6.2%. On a monthly basis the rises were 0.3% and 0.6%, respectively. All readings, year-on-year and month-on-month exceeded consensus estimates. The key takeaway was the spread of price rises from the goods sector to services with breadth of rises widening and transforming into a cost-of-living issue. This is shotgun inflation, not narrow and rifle-like. It will make bringing it under control more difficult. With the Federal Reserve’s (the Fed) monetary policy settings well behind the curve, the task becomes more onerous.
Despite higher new car prices, the durable goods component hardly moved in April after a slide of 0.9% in March, reflecting the fall in used car prices. The core services component increased by 0.7% from March, the biggest monthly rise since August 1990. Increases were across the board including airlines, medical services, delivery services and shelter rental.
The Fed chairman tried to placate financial markets after the 4 May meeting of the Federal Open Market Committee (FOMC) commenting, “I think we have a good chance to have a soft or softish landing or outcome, if you will. So, a 75-basis point increase is not something the Committee is actively considering. I think expectations are that we will start to see inflation flattening out.” Rest assured, a 75-basis point increase will be actively considered at the 14–15 June FOMC meeting. The odds are shortening that a larger than expected rate hike will follow as the Fed chases the inflation genie. As consumer demand softens under the weight of rising interest rates and reducing liquidity an economic contraction is increasingly likely.
Meanwhile back home…
Consumer sentiment slumped in the wake of the Reserve Bank’s (RBA) first increase in the official cash rate in over 11 years. The Westpac Melbourne Institute Index of Consumer Sentiment fell 5.6% in May to 90.8. This was the biggest fall since 2015, excluding the pandemic period in 2020. Raising interest rates to control inflation is aimed at dampening demand and the initial reaction indicates the journey has started.
Inflation pushing through 5% and the RBA’s interest rate hike has hit home. A sharp fall in the decision about the time to buy a major household item was compounded by a fall of over 40% about the time to buy a house. There was also a 9.5% fall in the outlook for house prices.
There will be several more rate hikes and so consumer sentiment is likely to sour further. Household consumption is going to come under pressure and consequently so will GDP growth over the remainder of the year.
Observations
- Magellan Financial Group announced an on-market share buy-back of up to 10 million shares on 16 March. Since the program went live on 4 April, shares have traded between $14.55 and $17.25 but none have been purchased. What message is management sending to the market?
- The Strathfield Hotel is on the market with a price tag thought to be above $90m. The business generates annual revenues over $10m from bar, bistro, gaming, wagering, accommodation and retail liquor operations and consistent earnings over $3m. The hotel has a 2am liquor licence and 30 gaming machines. There are approved plans for a mixed-use development including 60 apartments, 14 hotel rooms and commercial and retail space on the 2067sqm site. Back of the envelope, the asking price suggests nine times revenue and a P/E multiple of 30 and is likely to be sold.
- Endeavour Group owns and operates 340 hotels and 1640 retail outlets under the Dan Murphy’s and BWS banners, has 12,400 electronic gaming machines and 300 TAB/Keno in over 280 hotels. Market capitalisation is currently $13.8bn with FY22 revenue estimated at $11.6bn and NPAT of $480m—1.2 times revenue, a P/E multiple of 29 and a modest 3% fully franked yield. Retail investors can’t buy the Strathfield Hotel. Endeavour is the dominant player in the on-premises and retail liquor industry with wide moat, low uncertainty, and exemplary capital allocation ratings. Perhaps a candidate for the wish list.
- With the Aussie market in retreat, it was interesting to view the top trades in April on the ASX. Vanguard’s ETFs held the top three places followed by Betashares Nasdaq 100 (Exhibit 1). The subsequent slide in global markets, particularly in the US would have inflicted a fair degree of pain so far in May. It appears ETFs could be the vehicle of choice of traders more than investors at present. Margin calls would be adding to downside pressure. This will add to already extreme levels of volatility.
Exhibit 1: Top 20 ASX trade April 2022 on Sharesight
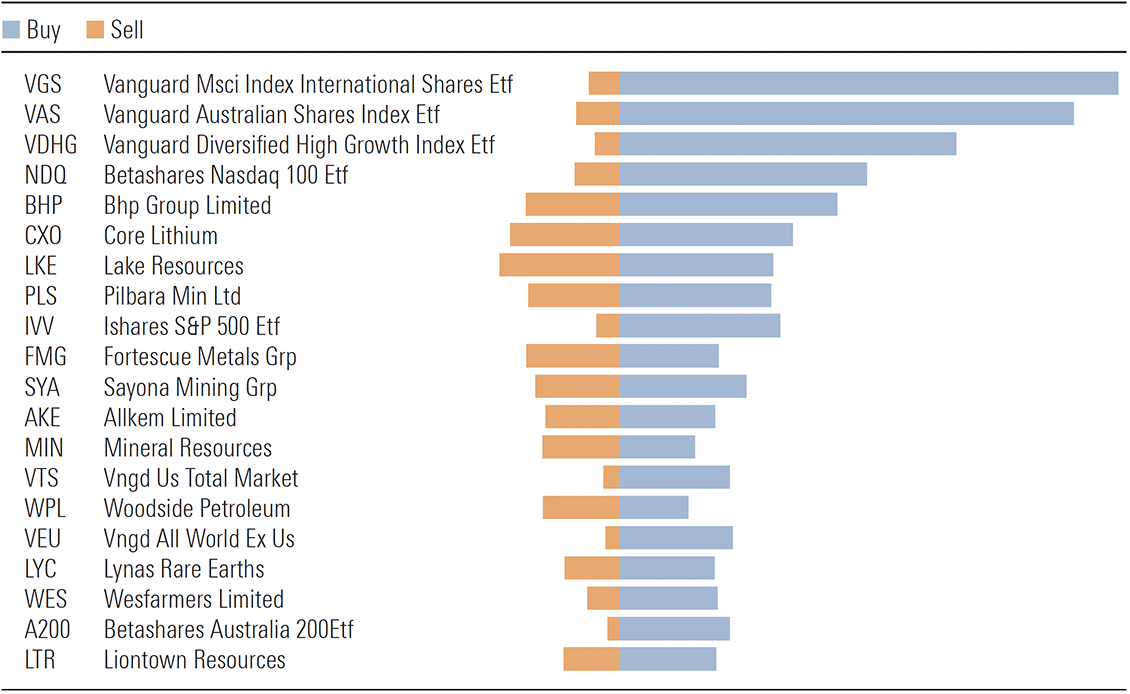
Source: Sharesight
Stay calm, this storm was predictable and will pass. Be frugal and prudent. This is not yet the time to be buying the dip.
By the time retirement savers realise the error of their ways, it may be too late
As inveterate watchers of sitcom reruns (and a real-life Felix/Oscar combination), my sister and I loved The Odd Couple while we were growing up.
One of our favorite episodes featured a courtroom sequence in which Felix (Tony Randall) berates a witness to “never assume,” and proceeds to use the chalkboard to demonstrate what happens when you do. More years later than I care to admit, the mere mention of the word “assume” makes me smile.
But assumptions aren’t always a laughing matter, and that’s certainly true when it comes to retirement planning, where “hope for the best, plan for the worst” is a reasonable motto.
Incorrect – and usually too rosy – retirement-planning assumptions are particularly problematic because, by the time a retiree or pre-retiree realises her plan is in trouble, she may have few ways to correct it; spending less or working longer may be the only viable options.
What follows are some common – and dangerous – assumptions that individuals make when planning for retirement, as well as some steps they can take to avoid them.
Dangerous assumption #1: Stock and bond market returns will be robust
Most retirement calculators ask you to estimate what your portfolio will return over your holding period. It may be tempting to plug in strong returns to help avoid hard choices like deferring retirement or spending less, but think twice.
To be sure, stocks’ long-term gains have been pretty robust. The S&P 500 generated annualised returns of more than 10% from 1926 through the end of last year, and returns over the past 15 years have been in that same ballpark. But there have been certain stretches in market history when returns have been much less than that; in the decade ended in 2009, for example – the so-called “lost decade” – the S&P 500 actually lost money on an annualised basis.
The reason for stocks’ weak showing during that period is that they were pricey in 2000, at the outset of the period. Stock prices aren’t in Armageddon territory now, but nor are they cheap. The Shiller P/E ratio, which adjusts for cyclical factors, is currently at 37, versus a long-term mean of less than half that figure.
Morningstar’s price/fair value for the companies in its equity coverage universe is a much less scary 0.97, indicating that stocks are pretty close to fair value. But few are expecting good results from bonds, given that starting yields have historically been an excellent predictor of bondholders’ returns.
What to Do Instead: Those valuation metrics suggest prudent investors should ratchet down their market return projections somewhat just to be safe, at least for the next decade, and that has implication for retirement planning. In our recent research on retirement income, for example, embedding very modest return expectations for stocks and bonds resulted in a safe starting withdrawal percentage in the low 3% range. But we also explored ways to lift that starting percentage, including employing some variability in spending.
Dangerous assumption #2: Inflation will be benign
During most of the past two decades, inflation was a non-issue, with the Consumer Price Index (CPI) increasing by just 2% or even less in most years.
That made inflation easy to ignore or at least downplay when forecasting retirement spending. Recent events, however, illustrate the peril of assuming that consumer prices will remain steady.
The most recent CPI reading showed an increase of nearly 8% for the year ended February 2022. Should inflation remain on the high side, retirees would need to withdraw more than they anticipated from their portfolios just to maintain their standards of living. Bill Bengen, the author of the original “4% guideline” research, articulated concerns about that very issue when we interviewed him in December 2021.
What to Do Instead: Rather than assuming inflation will stay good and low in the years leading up to and during retirement, investors should use longer-term inflation numbers to help guide their planning decisions. While it seems unreasonably pessimistic to assume the currently high inflation readings will persist in perpetuity, 3% or even 4% is a reasonable starting point.
And to the extent they can, investors should customise their inflation forecasts based on their actual consumption baskets. For example, healthcare costs are often a bigger slice of many retirees’ expenditures than they are for the general population, while housing spending may be a lower component of retirees’ total outlay, especially if they own their own homes.
The possibility that inflation could run higher during your retirement than it did from 2000-20 also poses the question of laying in hedges in your retirement portfolio to help preserve purchasing power once you begin spending your retirement assets.
That means stocks, which historically have had a better shot of outgaining inflation than any other asset class, as well as Treasury Inflation-Protected Securities and I-Bonds, commodities, precious-metals equities, and real estate. It may also caution you against holding too much in fixed-rate investments, whose return potential is negative once inflation is factored in.
Dangerous assumption #3: You’ll work past 65
Never mind how you feel about working longer: The financial merits are irrefutable.
Continued portfolio contributions, delayed withdrawals, and delayed social security filing can all greatly enhance a retirement portfolio’s sustainability. Given those considerations, as well as the ebbing away of pensions, increasing longevity, and the fact the financial crisis did a number on many pre-retirees’ portfolios, it should come as no surprise that older adults are pushing back their planned retirement dates.
Whereas just 11% of individuals surveyed in the 1991 Employee Benefit Research Institute’s Retirement Confidence Survey said they planned to retire after age 65, that percentage had more than tripled (to 39%) in the 2021 survey.
Yet there appears to be a disconnect between pre-retirees’ plans to delay retirement and whether they actually do. 46% percent of workers leave the workforce earlier than planned, according to EBRI research. Some of that divergence, especially recently, may be because of enlarged portfolio balances, the result of an extended stock market run. But health considerations, unemployment, or untenable physical demands of the job will also weigh.
What to Do Instead: While working longer can deliver a three-fer for your retirement plan, it’s a mistake to assume that you’ll be able to do so. If you’ve run the numbers and it looks like you’ll fall short, you can plan to work longer while also pursuing other measures, such as increasing your savings rate and scaling back your planned in-retirement spending. At a minimum, give your post-age-65 income projections a haircut to allow for the possibility you may not be able to (or may choose not to) earn as high an income in your later years as you did in your peak earnings years.
Dangerous assumption #4: You’ll get inheritance
It’s a convention in movies for children to be crestfallen when their parents don’t leave them an inheritance, and a few studies show there can be a disconnect between what children expect to receive and their eventual windfalls.
While about 70% of the millennials surveyed by Natixis said they expected to receive a windfall, just 40% of their parents planned to leave one. A Schwab survey identified a similar disconnect in inheritors’ expectations versus reality. Increasing longevity, combined with long-term-care needs and rising long-term-care costs mean that even parents who intend for their children to inherit assets from them may not be able to.
Adult children who expect an inheritance that doesn’t materialise may be inclined to overspend and undersave during their peak earning years. And by the time their parents pass away and don’t leave them a windfall – or leave them much less than they expected – it could be too late to make up for the shortfall.
What to Do Instead: Don’t rely on unknown unknowns. If you’re incorporating an expected inheritance into your retirement plan, it’s wise to begin communicating about that topic as soon as possible. Alternatively, if you don’t want or need an inheritance but suspect that your parents are forgoing their own consumption to give you one, you can have that conversation, too.
Reserve Bank (RBA) Governor Philip Lowe fired the starter’s gun for the journey to interest rate normalisation on Tuesday. Ahead lies a steeplechase course not an obstacle-free runway. Sensibly, the official cash rate was raised by 25-basis points to 0.35%, but the RBA is still way behind the curve, after admitting to “embarrassing” forecast mistakes.
Importantly, the bank reinforced its independence by raising rates during an election campaign. But despite Lowe reiterating the bank’s actions are non-political, you can bet the decision will not be perceived that way in the current circumstances. The inflation currently affecting the cost of living is due to the clash of supply chain disruptions with overstimulated demand from necessary accommodative monetary policy and supportive fiscal policy. Neither was political and both were in the national interest.
The clear message in Lowe’s statement was the increase is the start of the process of normalising monetary policy in response to improving economic conditions, particularly in the labour market. The emergency settings of the past two years are no longer required. Normalisation suggests the official cash rate could rise to 2.5%, but the timing will depend on how conditions evolve.
Bond traders reacted swiftly to the statement and the more hawkish press conference, with yields rising sharply. The 5-year yield jumped 20 points to 3.20%, joining the 10 and 15-year yields well into 3% plus territory. At the start of the year, the 5-year yield was 1.30%. The yield curve continued to flatten. The A$/US$ cross rate firmed back above 0.71.
Mea culpa, mea culpa
There has been a significant change in the bank’s central forecasts. In February, the central scenario was headline CPI of 3.75% for the year ended June and 3.25% for the year ended December 2022. Trimmed mean was expected to hit 3.25% for year ended June and 2.75% for the year ended December.
Now, the central forecast for 2022 is for “headline inflation of around 6 per cent and underlying inflation of around 4 3/4 per cent; by mid-2024, headline and underlying inflation are forecast to have moderated to around 3 per cent. These forecasts are based on an assumption of further increases in interest rates.” At the press conference, Lowe said the assumption was that the official cash rate would be between 1.5% and 1.75% at year-end 2022 and 2.5% year-end 2023.
While admitting inflation “has picked up significantly and by more than expected” and that previous forecasts were wrong, “the Board is committed to doing what is necessary to ensure that inflation in Australia returns to target over time. This will require a further lift in interest rates over the period ahead. The Board will continue to closely monitor the incoming information and evolving balance of risks as it determines the timing and extent of future interest rate increases.”
The RBA’s balance sheet will be allowed to run off. Proceeds from maturing government bonds will not be reinvested and the repayment of the $188bn Term Funding Facility, $80bn by 30 September 2023 and $108bn by 30 June 2024, will see the balance sheet decline significantly. “The Board is not currently planning to sell the government bonds that the Bank purchased during the pandemic.” That certainly is the case with the $27bn purchased under the Yield Curve Control program at yields between 0.10% and 0.25%, which currently sit between 2.75-2.90%.
The first increase in the official cash rate in over 11 years will likely have an adverse impact on consumer sentiment. At Lowe’s press conference, much was made of the $240bn in household savings over and above pre-pandemic levels. He noted how the average owner-occupier with a mortgage is more than two years ahead of their mortgage repayment schedule. But averages are dangerous and these savings will not be evenly distributed across households. It is likely there is a meaningful bias toward households without mortgages and therefore with little or no interest rate exposure. The household savings ratio was 13.6% in 4Q21 and is likely to fall in 1Q22 and beyond as spending options increase with the easing of restrictions and borders reopening.
Forecasters are now plotting their course to a normalised cash rate of 2.5%. Westpac’s chief economist Bill Evans predicts a 40-basis point increase on 7 June lifting the rate to 0.75%. He said the surprise 25-point increase “emphasises the Board believes it has a daunting task to bring underlying inflation back from its forecast 4.75% to the top of the 2-3% band by mid-2024.”
Lowe indicated the choice of a 25-point increase was to show it was a return to “business as usual” perhaps signaling future increments of 25-points could be the base case. Evans is not convinced, hence his prediction.
Banks as quick as Usain Bolt off the mark
All four major banks have wasted no time after hearing Lowe’s gunshot, lifting the standard variable rate by 25-basis points. The ANZ and National Australia Bank (NAB) will implement the change on 13 May, Westpac on the 17th and Commonwealth Bank (CBA) on the 20th. I hope deposit rates rise with the same urgency, and pigs might fly over the fairies at the bottom of my garden!
The big four banks were the beneficiaries of $133bn in the RBA’s $188bn Term Funding Facility providing low-cost fixed rate funding for three years, including some $63bn at 0.25% and $70bn at 0.10%. CBA was the largest beneficiary of $51bn, NAB $32bn, Westpac $30bn and ANZ $20bn. The miserly rates paid to depositors over the past two years have enabled them to fund competitive pricing in the mortgage market to protect market share. Despite their importance to overall bank funding, depositors have been roadkill. Is loyalty a one-way street or just pricing power gone mad?
The Fed moves as Powell comments propel markets
As expected, the US Federal Reserve’s Open Market Committee (FOMC) raised the target range for the federal funds rate by 50-basis points to 0.75%-1.0%, while anticipating “that ongoing increases in the target range will be appropriate.” The 50-point increase was the largest since 2000.
But it is not always what the committee does, but what the chairman says that gets financial markets attention. At the press conference, the Fed chairman Jerome Powell provided commentary that ignited market interest.
“I think we have a good chance to have a soft or softish landing or outcome, if you will. So, a 75-basis point increase is not something the Committee is actively considering. I think expectations are that we will start to see inflation flattening out.”
The market bet Powell would deliver, and a strong relief rally ensued, continuing the extreme volatility of recent weeks. Bond yields fell in the short and middle of the curve. The US$ slumped. The Dow Jones, S&P 500 and Nasdaq recorded gains of 2.8%, 3.0% and 3.2%, respectively.
It is stating the obvious that inflation will flatten out. Prices will not continue to rise at current rates, but the damage has already been done. Spending power has been meaningfully reduced and prices are likely to remain high, without necessarily continuing to rise at past rates. But interest rates are set to rise as the tightening cycle is in its infancy. This will impact consumer spending behaviour as disposable income is eroded. The US personal savings rate is already below pre-pandemic levels at 6.2%.
Powell’s “soft or softish landing” is predicated on the belief “households and businesses are in very strong financial shape”. Households usually spend income and wages growth, while strong, is still uncomfortably below headline and core inflation.
While the market jumped on Powell’s comments, the FOMC statement had some sobering lines.
“The invasion of Ukraine by Russia is causing tremendous human and economic hardship. The implications for the U.S. economy are highly uncertain. The invasion and related events are creating additional upward pressure on inflation and are likely to weigh on economic activity. In addition, COVID-related lockdowns in China are likely to exacerbate supply chain disruptions. The Committee is highly attentive to inflation risks.”
“In assessing the appropriate stance of monetary policy, the Committee will continue to monitor the implications of incoming information for the economic outlook. The Committee would be prepared to adjust the stance of monetary policy as appropriate if risks emerge that could impede the attainment of the Committee’s goals.”
Quantitative tightening (QT) will begin on 1 June at an initial monthly rate of US$47.5bn for three months. Then the Fed will allow a maximum of US$95bn to roll off the balance sheet without reinvestment of proceeds of maturing securities. The monthly roll off will comprise US$65bn of US Treasuries and US$30bn of mortgage-backed securities (MBS). While the Fed has sufficient short-dated maturities in US Treasuries to accommodate the roll off, it has no MBS maturities of less than one year. Consequently, this will necessitate selling some of the US$2.7 trillion MBS, which would have an impact on debt markets.
Exhibit 1: Maturity distribution of securities, loans, and selected other assets and liabilities, April 27, 2022
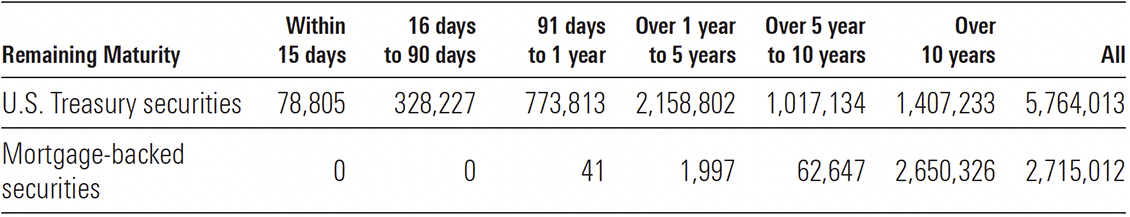
Source: www.federalreserve.gov
Fed officials have indicated any sales of MBS will only occur after the roll off program is well underway. As the minutes of the March meeting of the FOMC revealed, “An FOMC decision to implement a program of agency MBS sales would be announced well in advance.”
The balance sheet contraction will drain liquidity from money markets in a program that could take years. The FOMC has not set a target for the balance sheet which currently stands just shy of UD$9 trillion, with US$5.8 trillion in US Treasuries and US$2.7 trillion in MBS.
US economy contracts in 1Q22
The surprise 1.4% contraction in US GDP (advance estimate) in 1Q22 was met with a yawn. Consensus expectations were for a sharp slowing in growth to 1%, from a very robust 6.9%, in 4Q21 (Exhibit 2). The “second” estimate will be released on 26 May. The reason for the nonchalant market reaction is due to solid annualised growth near 3.5% in real private domestic demand, with consumer spending growing at an annualised rate of 2.7%, residential construction 2.1%, and non-residential construction 9.2%.
Exhibit 2: United States GDP growth rate (%)
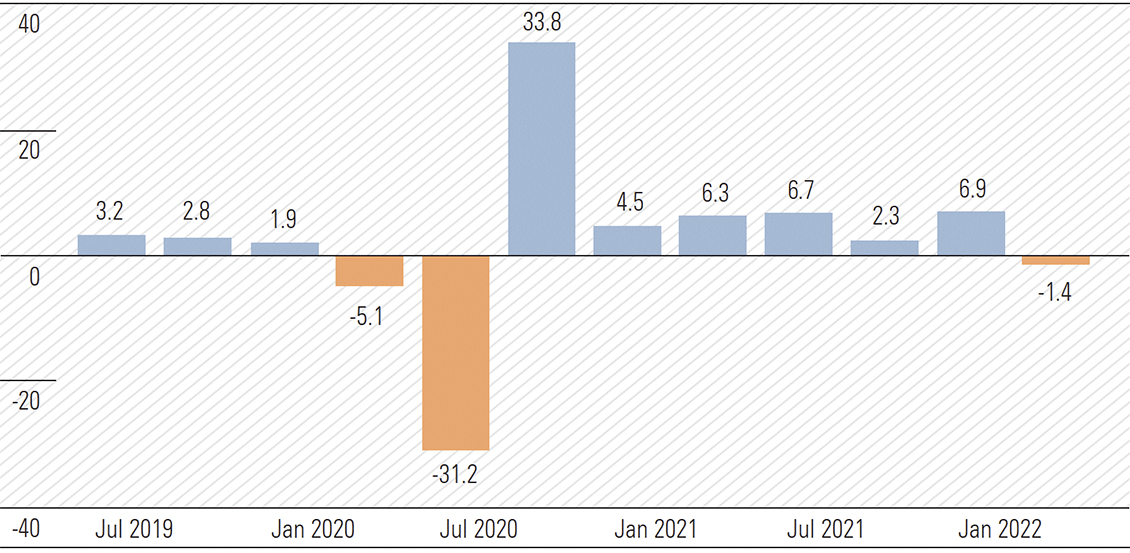
Source: tradingeconomics.com, U.S. Bureau of Economic Analysis
The major factor behind the contraction is a record goods trade deficit of US$339.2bn for the quarter, which reduced GDP by 3.2%. This is the largest quarterly drag since 3Q20 of 3.3%. The deficit widened by over 20% in the quarter. On a monthly basis, new records were set in January and March. January’s record was US$107.6bn, which narrowed to US$106.6bn in February and then exploded to US$125.3bn in March. The consensus estimate for March was US$105bn.
Both imports and exports reached record levels in March of US$294.6bn (+11.5%) and US$169.3bn (+7.2%), respectively, the former driven by sharp increases in industrial supplies, including petroleum products and consumer goods, including motor vehicles. This reflects the increase in real private domestic demand in the 1Q22 GDP data. The surge in imports occurred in the face of global supply chain disruption and was up almost 27% on March 2021 levels. Will excess inventory be an issue for the 2Q22 GDP read?
Other detractors to 1Q22 GDP were inventories 0.8% and government spending 0.5%.
With US imports now running at a monthly rate near US$300bn, it makes the onshoring task even more imposing. The US Secretary of the Treasury Janet Yellen has suggested US companies “friend-shore” more of their production in response to China’s ambiguous response to Russia’s invasion of Ukraine. The left-field idea is pro deglobalisation, which would see the US and its allies taking greater control over supply chains by shifting trade away from politically non-aligned competitors. In January and February, US imports from China totalled US$90bn.
GDP growth in 2Q22 is also likely to be subdued. The exit rate from 1Q22 was a negative 1% and although we may wish to ignore the impact of net exports, they are an integral part of economic activity and GDP. While private sector demand was underpinned by personal spending, the momentum is likely to wane as the personal savings rate continues to decline.
Where to now for the markets?
As mentioned in Overview of YMW 14, the Australian market is not a slave to its US counterpart due to the big mismatches in tech and resources weightings, respectively. Both markets face monetary policy tightening and the cycle to interest rate normalisation has just begun. Hopes a hard landing can be avoided are just that and the quantitative tightening path has only once been trodden. Printing presses have stopped and the liquidity they provided was the oxygen that buoyed risk asset prices over the past two years. Prices could become oxygen starved as alternative opportunities, once snuffed out by zero-bound interest rate policy, present.
Inflation will be corralled but there will be a price to pay. Global supply chains are far from being fully repaired. Geopolitical tensions remain elevated. The economies of both China and the eurozone are struggling for different reasons. These are the second and third largest of the global economies and the largest recorded a negative GDP reading in 1Q22. This is the reality.
I would be very careful adding new money to the market at present. I believe there will be better opportunities toward the end of the year. The next six months is likely to be fraught with volatility and continued uncertainty on several fronts. Be patient, prudent and vigilant. I remain comfortable with an overweight exposure to energy.
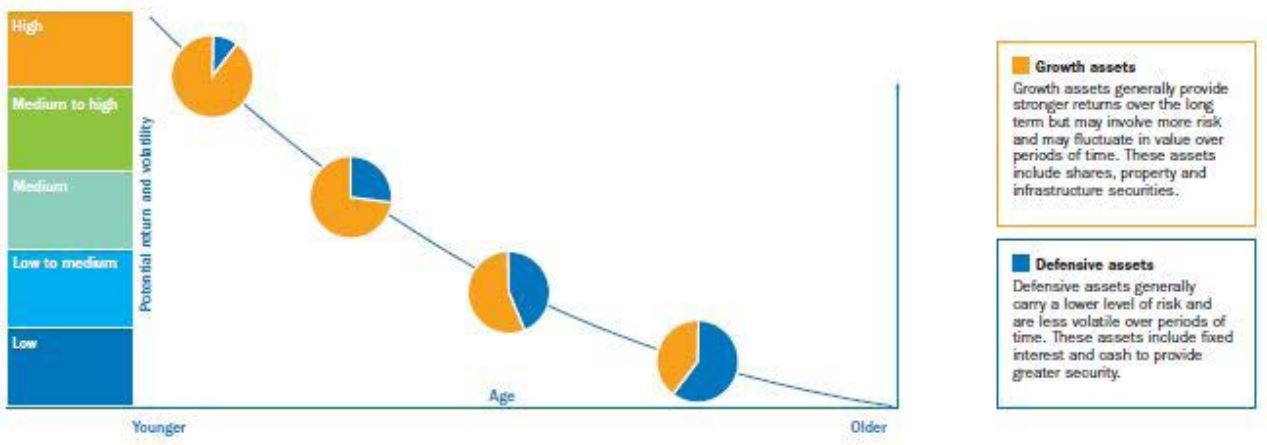
Most Australians hold their superannuation in a balanced fund, often 60 per cent growth/40 per cent defensive or 70 per cent/30 per cent. Lifecycle funds are also popular, where the amount in defensive assets increases with age. Employees who are not engaged with their super (and that’s most people when they start full-time work) simply tick a box for the default fund selected on their behalf by the employer.
For example, UniSuper, the fund for the higher education sector with 450,000 members holding $90 billion, says:
“Our Balanced investment option returned almost 6 per cent in 2020. This is an important result because it’s our default investment option and most of our members invest in it.”
Of course, 2020 was no ordinary year, and UniSuper also reports:
“The difference between our best- and worst-performing investment options was about 60 per cent. The reason for this is that our best performer, the Global Environmental Opportunities option, focuses on technology and decarbonisation. Our worst performer, the Listed Property option, is heavily invested in shopping centres, which have suffered during the pandemic.”
What an amazing difference for simply ticking the correct box in an application form from a major superannuation institution. That 60 perr cent variation in money to live on can make a massive difference in retirement standards, and it shows the importance of asset allocation and fund selection.
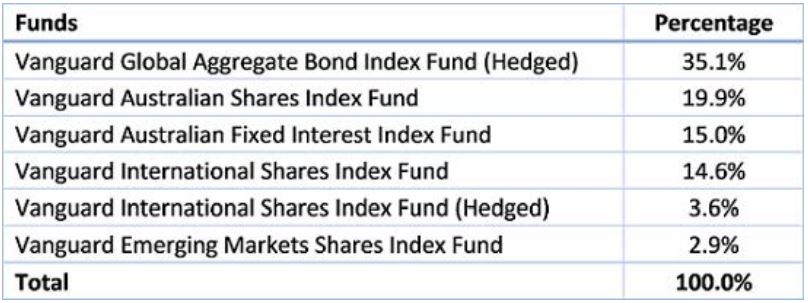
Here is the strategic asset allocation of the UniSuper Balanced option.
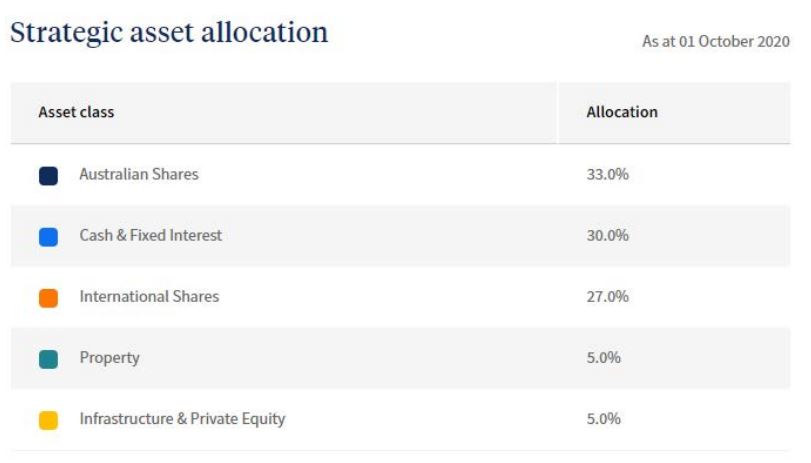
It is common for a balanced option to hold 30 per cent to 50 per cent in cash and fixed interest, but with high-quality bonds and term deposits earning 1 per cent or less, the composition of the ‘defensive’ assets increasingly varies between funds. We have previously discussed how Hostplus uses infrastructure assets rather than bonds in its defensive allocation.
Take another example, Vanguard’s Diversified Balanced ETF. Sounds perfect for superannuation, as ‘diversified and balanced’ is a recommended long-term savings strategy. This is more a 50/50 fund and gains its exposure by investing in the following Vanguard sector ETFs.
It’s a solid retirement solution for many people, but let’s delve deeper into the Global Aggregate Bond Index Fund, typical of where many super funds hold their fixed interest allocation:
- Number of issuers: 2,488, average credit quality AA-
- Number of holdings: 9,795 (That’s what you call diversification. Negligible credit exposure to any one name, absolutely rock solid credit risk).
- Yield to maturity: 0.92 per cent
- Effective duration: 7.5 years
- Weighted average maturity: 9.2 years
With a duration of 7.5, if interest rates rose 1 per cent across the rate curve, the bond fund would lose 7.5 per cent. Or make 7.5 per cent if rates fell 1 per cent. Investors should know that a 1 per cent rate move could wipe out 8 years of 0.92 per cent. How many people in such a balanced fund realise half their allocation is earning less than 1 per cent?
This is not a criticism of the product. It is typical and a reflection of current market circumstances. Anyone who wants returns needs to take risk.
Elsewhere, Colonial First State (CFS) offers lifecycle funds rather than a single balanced fund, and here are the five asset allocations in their FirstChoice Employer Super or Commonwealth Essential Super. More defensive assets with age.
At the moment at CFS, the defensive allocation for the older cohorts is a mix of multi asset, alternatives, credit, emerging markets debt, and ‘total return’ fixed interest in addition to regular duration Australian bonds plus cash. It’s worth checking with your super fund what is in the defensive bucket.
Many people use the rule-of-thumb of ‘your age in bonds’. That is, at age of 70, hold 70 per cent in bonds. But low interest rates means income is insufficient for the lifestyle many retirees want, and hence the debate about spending capital that Firstlinks has covered in detail. The challenge is to find assets that deliver returns with acceptable risk, or adopt other strategies such as working longer or part-time.
The Reserve Bank’s Head of Financial Stability, Jonathan Kearns admitted a few weeks ago that the values of all investments are vulnerable to a rise in interest rates, and bonds may not provide the traditional hedge for other parts of a portfolio:
“Because risk-free sovereign rates effectively underpin the pricing of all sorts of assets, if you have a rise in yields because of risk premia then that can affect the pricing of a broad range of assets simultaneously. Investors who thought they perhaps had a hedge through owning bonds and equities can find that all of their assets fall simultaneously and then that can have negative feedback for the economy through wealth effects.”
The market downturn caused by the covid-19 pandemic was one of the most severe in recent history, but it also proved to be one of the fastest recoveries. This episode reinforces two important lessons for long-term investors:
1. Don’t panic and sell stocks when the market crashes.
2. It’s very hard to predict how long the stock market recovery will take.
During the downturn, I made these points in an article about the history of market crashes. I showed that the 150-year record of US market returns is littered with bear markets (downturns of 20 per cent or more)—and in each case, the market eventually recovered and then went on to new heights.
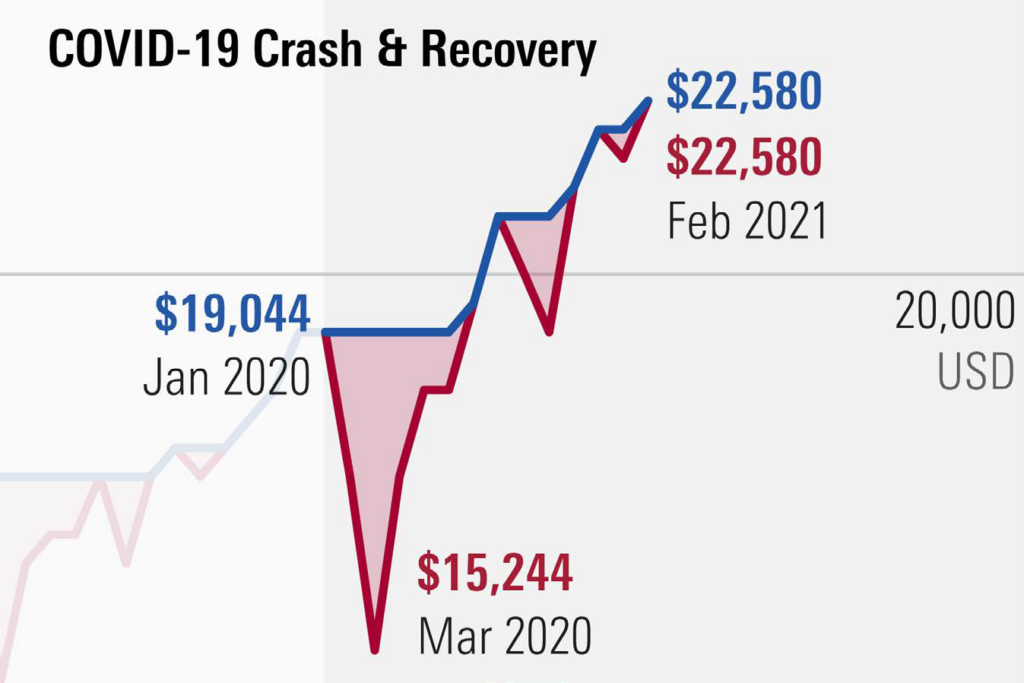
Indeed, this also proved to be the case in 2020. After a decline of 20 per cent (in real terms) from December 2019 to March 2020, the US equity market fully recovered in just four
months and was back to its precrash level by July, soon pushing higher. This market recovery is evidence of the second lesson: One can never predict how fast a recovery will be.
But the last year has also been a stark reminder that the stock market is not the economy. Though the market has recovered, the US economy is still suffering due to the covid-19 restrictions on economic activities. As of January 2021, the employment rate was down 5.4 per cent from pre-pandemic levels, particularly in consumer services like restaurants and hotels.
As the rate of vaccinations increases and herd immunity is eventually reached, the economy will open up and activities will resume. But no one can know how this will affect the stock market.
The latest in a long history of market crashes
To put the covid-19 downturn and stock market recovery into context, I updated the chart that shows the history of market crashes. The chart, which is based on a series of returns I created to form a hypothetical US stock market index, displays US real inflation-adjusted equity returns going back to 1871.
In this exhibit, the red cumulative wealth line shows the growth of the US $1 (starting in 1870), with dividends reinvested, in the stock market index. In blue is the peak-to-recovery line, which traces the growth of $1 until the start of a decline, and then stays at that same peak value until the market recovers to that level. The gap created, shaded in the chart, shows the depth and length of each decline.

This exhibit illustrates two important aspects of US market return history:
Despite numerous severe drops, the cumulative wealth line shows that $1 grows to $22,580 over this period of 150 years. In other words, staying in the market and weathering the storms have paid off for investors. (However, this could be a case of survivorship bias.)
The range in shaded areas shows that some declines are worse than others—and how long each lasts is unpredictable.
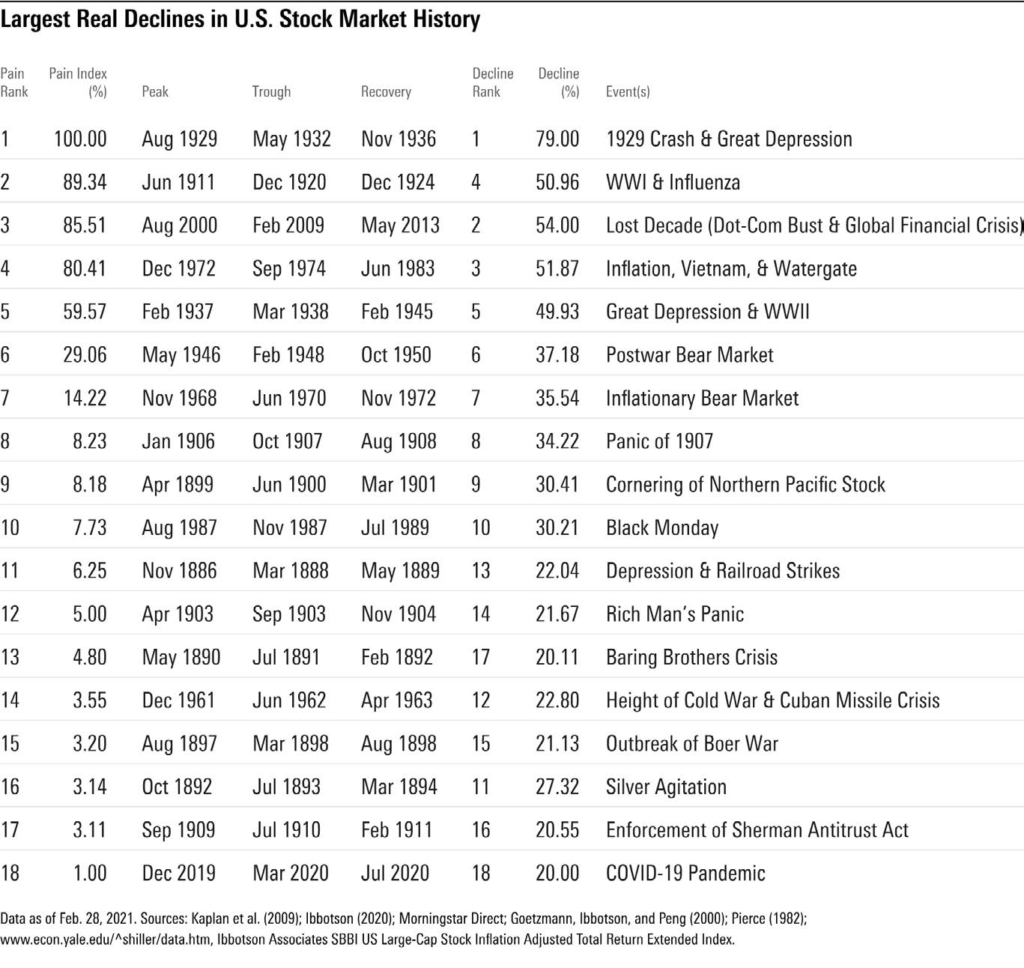
Including the covid-19 crash, there are a total of 18 bear markets over this period of 150 years, suggesting that on average they occur about once every eight years. The worst one was the Crash of 1929, along with the first part of the Great Depression, which saw a 79 per cent loss. It took the market a little more than four years to recover from that trough. The second-worst drop is the 54 per cent decline over the Lost Decade (the period from August 2000 to February 2009). The market index did not fully recover until May 2013, almost 12 and a half years after that decline began.
It can be helpful to consider the covid-19 crash through the lens of these other bear markets. You can see in the magnified part of the chart that the downturn—while sudden and sharp—was a relatively minor blip in this larger picture of market gains and declines.
The history of market crashes is long—they’ve been occurring regularly since the late 19th century—and being able to recognise their regularity in the data can offer us a better understanding of the risks of equity investing.
Not all market crashes and recoveries feel the same
In last year’s article, I developed the “Pain Index” to measure how bad each episode of decline and eventual recovery was. There’s more detail on the methodology there, but essentially, the index compares each crash with the worst crash in the data, the Crash of 1929 and the beginning of the Great Depression. It accounts for both the magnitude of a crash and how long the decline and its subsequent recovery took.
Below, I have updated the table that sorts these market crashes by how painful they were so that it includes the covid-19 crash.
You can see that in terms of its impact on the stock market, the covid-19 crash was the least painful of the 18 crashes, due to its quick recovery. With a Pain Index of only 1 per cent, it was a tiny fraction as severe as the major crashes of the time period.
Lessons learned from the history of market crashes
At the time of the crash, of course, we couldn’t have known that would prove to be the case—which is why some investors panicked and sold off their stock holdings.
It just goes to show the unpredictability of markets. Not all crashes are alike in their severity and duration and naming the market’s peak or bottom is tough. Therefore, the best bet is to prepare now for the next crash by owning a well-diversified portfolio that fits one’s time horizon and risk tolerance.
What I wrote at this time last year rings truer than ever: “Market risk is about more than volatility. Market risk also includes the possibility of depressed markets and extreme events. These events can be frightening in the short term, but this analysis shows that for investors who can stay in the market for the long run, equity markets still continue to provide rewards for taking these risks.”
Having a future-proof investment strategy is not only legally compulsory, but also one of the best ways to enhance retirement savings. Amid volatile markets, how can self-managed super funds get the right settings in place?
Recent market volatility suggests a review of investment strategy is advisable, particularly ahead of the approaching new financial year. The Australian Taxation Office says the strategy must be reviewed at least annually, and when “significant events” occur including a market correction.
The strategy should be in writing and must be tailored to the specific circumstances of each fund, “rather than a document which just repeats the words in the legislation,” the ATO says. Relevant circumstances include member ages, employment and retirement goals, including risk appetite, with the strategy required to explain how investments meet each member’s objectives.
What to keep in mind
Key factors to consider include:
- Risks and likely returns from the fund’s investments regarding its objectives and cash flow needs
- Composition of the fund’s investments, including the extent of diversification
- Liquidity of the fund’s assets
- The fund’s ability to pay benefits when members retire, as well as other costs
- Insurance cover for members—while not essential, it must be considered.
The ATO says it is not enough just to specify investment ranges of zero to 100 per cent for each class of investment. Instead, the strategy should state how the percentage or dollar allocation in each class supports stated retirement goals.
For example, a balanced SMSF could construct a portfolio targeting a return 2 to 3 per cent above inflation.
The growth allocation could include:
- Australian equities (10 to 25 per cent)
- property (5 to 10 per cent)
- and international equities (10 to 25 per cent)
The defensive allocation might comprise:
- domestic fixed interest (15 to 25 per cent)
- international fixed interest (15 to 25 per cent)
- and cash (3 to 10 per cent)
SMSF investments are restricted to those permitted by the fund’s trust deed and must meet the sole purpose test as well as abiding by the super laws, such as related party rules. The ATO’s preference is for a diversified range of assets which minimise investment risk, since having the bulk of retirement savings in a single asset or asset class (whether property or equities) can result in “concentration” risk as well as liquidity risk.
For example, a single asset SMSF with a business property would not be the desired strategy for a retiree paying a pension, while blue chip stocks have lower liquidity risk than small-cap stocks or residential property.
It is important to document how cash flow and liquidity risk will be managed, should dividends be lowered or tenants vacate an investment property.
The strategy is also required for the fund’s annual audit, with the auditor required to determine whether the fund has delivered on its investment strategy. Should the worst case scenario occur and the auditor lodge an auditor contravention report, penalties of up to $4,200 can be applied on each individual or corporate trustee for breaching strategy requirements.
Fortunately, SMSFs needing assistance with their investment strategy can seek help from an SMSF adviser or licensed financial adviser. Although standard templates are available, the ATO warns that they must be tailored to each fund’s circumstances.
Increased scrutiny
The ATO has increased its compliance activity recently regarding SMSF investment strategy, amid concerns of a lack of diversification and an overreliance on basic templates.
In 2019, letters were sent to nearly 18,000 trustees asking whether their investment strategy satisfied diversification requirements. The ATO also warned certain trustees regarding property investments, particularly where the property was purchased under a limited recourse borrowing arrangement.
In February 2020, the ATO followed up with further guidance, stating that the investment strategy needed to be tailored and specific to fund circumstances.
These moves may have served as a wake-up call to trustees and auditors, according to SMSF specialist adviser Liam Shorte.
“Auditors are now scrutinising the SMSF investment strategy in greater detail, whereas previously it was often a template left with blank spaces and just signed off by trustees without consideration,” says Shorte, director at Verante Financial Planning.
“As an adviser I find it a great and simple tool for highlighting to trustees their duties to consider liquidity, risk and diversification. Often many trustees get caught up on one type of asset or sector that they are knowledgeable or interested in and fail to consider the true risk and need for diversification.
“The SMSF investment strategy ensures they look at the broader picture to ensure they think about and put in place a well-reasoned and researched portfolio for their fund and if they are focusing on one asset or sector that they address the pros and cons of doing so and the additional risk that raises.”
Shorte adds: “Because of past attitudes to the document it is a steep learning curve for many trustees, and they get a jolt when the auditor who has often been the fund’s auditor for many years suddenly asks for a much more in-depth investment strategy.
“However, the ATO has now given clear guidelines on what is expected to be considered and included and that forms the new baseline for the strategies. Anything that encourages trustees to be more considered in their investment decisions is a positive move.
“Nothing is locked in and if the trustees wish to explore other investment opportunities not covered in their current strategy they can simply meet and review the strategy and alter it to accommodate the new investment, but at least they are reminded to consider the new investment in terms or risks, diversification, liquidity needs and ability to pay benefits as well as any need to review insurances on them personally or the proposed assets.”
With stock market volatility seemingly set to continue, reviewing investment strategy could prove worthwhile for trustees, particularly as rising bond yields spark fears of a broader market correction.
Adding to the jargon that fills the superannuation industry and confuses most people, two common words have taken on new meanings. They sound innocent, but when a Morrison Government minister uses the words ‘efficiency’ and ‘flexibility’ in the super debate, they now have particular definitions. And in neither case is it the way we previously understood superannuation.
Let’s find out what these words really mean.
Government draws on Retirement Income Review for changes
It’s unlikely to make it on to commercial television or trend on social media, but last week’s 2021 Policy Forum hosted by the Council on the Ageing (COTA) was a surprisingly lively affair. While both Treasurer Josh Frydenberg and Minister for Superannuation, Financial Services and the Digital Economy, Senator Jane Hume, have hinted at changes to superannuation before, they stepped up the rhetoric to another level. Some principles that have underpinned superannuation since the introduction of the Superannuation Guarantee in 1992 are under challenge.
The Policy Forum was also the first time that the three members of the Retirement Income Review appeared in public to explain their work. Chair Mike Callaghan did not hold back, saying that the industry trades off the public’s fear of running out of money in retirement, and he audaciously cited former Prime Minister Paul Keating as an example of the scare tactics.
Committee members Carolyn Kaye and Deborah Ralston talked about the need for better communication and for retirees to understand a wide range of support measures other than superannuation, such as health, pensions and aged care.
So there was much deflection from the importance of super, and as we have previously written about, the Review encourages retirees to live off their capital and raises the profile of the family home as a retirement asset.
This momentum is reducing the role of income from super investments as the way to fund a retirement, and it’s no surprise that Paul Keating comes out regularly to defend the system he feels is under attack. Two weeks before the COTA Forum, he told the ASFA Conference that it is essential to stick to the legislated increases in SG due to the rapid reduction in the number of workers paying taxes to finance welfare dependants such as age pensioners. He said ‘self provision’ must grow because:
“You are never going to get retirement adequacy off the back of the budget when there are only three taxpayers supporting each retiree.”
Back to Frydenberg and Hume, here are some telling extracts from their COTA speeches, and words on the hymn sheet which have new meanings.
All we need are flexibility and efficiency
The Treasurer and Superannuation Minister are reframing the retirement debate in key ways:
× Retirees should not have a better standard of living than they did when they were working.
× Retirees should spend their superannuation savings before they die.
× Workers should not be forced to place excessive amounts into superannuation.
Previously, and especially under Keating, the public was encouraged to save as much as possible for retirement to reduce dependency on the age pension. Now, the Government repeatedly uses the words efficiency (or efficiently) and flexible (or flexibility) to justify a new approach.

Let’s check the two speeches for clues. Jane Hume said at the start of her speech (bolding is my emphasis):
“The Review found that ‘more efficient use of savings in retirement can have a bigger impact on improving retirement income than increasing the SG’.”
For ‘more efficient’, read not leaving it behind for the kids. There is less need for SG when retirees learn to live off their capital. She said that retirees on average live on the income generated by super assets and die with 90 per cent of their savings still intact. That is not what superannuation is for.
“Indeed the Review found if people currently in their working lives and currently contributing to super via the SG were able to use their superannuation more efficiently when they get to retirement in the future, they would have higher replacement rates and better retirement outcomes than if the SG was lifted to 12 per cent.”
Come on, folks, it’s obvious. BE MORE EFFICENT.
And what about the other gem, flexible. Here it comes, complete with another ‘efficient’:
“This is why as a government and as an industry more broadly we must turn our minds to more flexible and more efficient products that allow retirees to use their super for a higher standard of living in retirement.”
How is it possible to make people feel more secure about spending when they may run out of money and worry about paying for aged care? Greater efficiency of course:
“But there is also this all-important issue how superannuation is being used. How do we help people have confidence to use their superannuation more efficiently to focus their planning on income streams as opposed to balances?”
So what is this magic pudding of products which funds retirement regardless of how long people live, the so-called CIPRs that are proving elusive for the private sector to develop?
All we need is flexibility:
“We all have roles to play here. The private sector can better innovate and develop flexible products.”
There was also much focus on the Retirement Income Covenant:
“At its core it will require trustees to have a strategy to generate higher retirement incomes for their members. The Covenant allows super funds the flexibility to tailor their retirement income strategy to their specific membership base.”
Ah, thank goodness. It will be a flexible product to solve the retirement needs of members, but whether anyone wants it is another matter.
Surely the Treasurer would not be left out of the buzz word talkfest. First, he eases in by quoting the Retirement Income Review:
“… a key finding of the Review with respect to superannuation, which is that “If people efficiently use their assets, then with the SG rate remaining at 9.5%, most could achieve adequate retirement incomes when combined with the Age Pension. They could achieve a better balance between their working life and retirement incomes.”
OK, so we only need 9.5%. But he’s the Treasurer, he was never going to allow a humble Super Minister to outdo him on ‘flexibility’. Let’s sneak in five f-words in consecutive sentences in case anyone misses it:
“The Review also identified the trade-off between flexibility and compulsion. The Review noted that our system has considerable flexibility if you want to save more for your retirement. But there is very limited flexibility if a person needs to save less to maintain their quality of life today. The COVID-19 early release of superannuation scheme was an example of how greater flexibility can benefit those that need it. Recognising the trade-offs, we gave Australians the choice of increased flexibility, allowing them to access their savings when they needed them most.”
Josh has not made it to Treasurer by half measures. In fact, far from undermining superannuation by giving people flexibility, the system is improved if personal preferences are met:
“While compulsion will remain an important part of our system, providing Australians with more flexibility should not be seen as an attempt to undermine the system overall. Far from it … More flexibility also means better accommodating the many different circumstances Australians finds themselves (in) over the course of their lives … we have introduced several changes over recent years to provide greater flexibility.”
But let’s not be outdone on efficiently either, which by now, we all know what it means – drawing down on capital:
“Treasury has estimated that at the current superannuation guarantee rate, using superannuation efficiently could increase the median person’s income in retirement by over $100,000 compared to how people typically draw down on their superannuation now.”
And there are many times when the Treasurer uses the word ‘effective’ to give the same meaning as ‘efficient’, so chalk that one up too.
What about the increase in the SG?
Besides influencing behaviour with this ‘efficient’ and ‘flexible’ babble, more tangible action by the Government will come soon in the form of a decision on the legislated increase in the SG from 9.5 per cent to 12 per cent, starting 1 July 2021. They they find support in the Review to remain at 9.5 per cent. Said Jane Hume:
“In measuring adequacy, the Review used a benchmark of 65-75 per cent of working life disposable income and found most people who start work today would be at or above the benchmark once they retire – even if the SG rate were to remain at 9.5 per cent.”
“Ever increasing amounts of superannuation contributions for your future retirement savings come at the expense of slower wage rises in your working life.”
“In the context of the SG … we must consider the implications of compelling people to sacrifice more during their working lives – by forgoing the wages they could be taking home today – that they could spend today – that they could use to pay off a home today – they forgo all that so that their balances are larger at retirement.”

There is the home coming into play. Superannuation prevents some people owning a home, a point influential Liberal, Tim Wilson, repeatedly pushes. Let’s ignore the possibility that releasing billions into an already overheated property market would push up prices and make home ownership even more elusive for many younger people.
Is Hume supported by Frydenberg on the 9.5 per cent sufficiency? Repeatedly.
“The retirement income system is, by definition, designed to provide retirement incomes. But the system cannot solely be about maximising income in retirement. Were it to seek to do so, it would clearly come at considerable expense to individuals during their working lives.”
“For a median earner, increasing the superannuation guarantee could increase their retirement income by $33,000, but lower their working-life income by around $32,000.”
“We must rightly carefully consider the implications of the legislated increase to the superannuation guarantee before 1 July this year – even more so at a time when our economy is recovering from the largest economic shock since the Great Depression.”
“The Review shows that if nothing changes, by 2060, one in every three dollars paid out of superannuation will be part of a bequest. This raises the question as to whether the answer to lifting the retirement incomes of Australians is more superannuation savings or better guidance about how to maximise their superannuation savings during their retirement.”
Let me guess … by using superannuation more efficiently with greater flexibility.
The meaning of efficiency and flexibility
So we now know what efficiency and flexibility mean, and it’s simpler than the jargon that makes superannuation such a complex system.
Flexibility is the choice to meet current needs and wants by putting less into superannuation for retirement. There’s a hint of not moving to 10 per cent or 12 per cent or alternatively, making it optional.
Efficiency (and its close cousin, effectiveness) is drawing down retirement capital instead of relying on income from super assets.
After all, as Senator Hume likes to remind us, “It’s your money.”
Expect to hear these buzz words a whole lot more as superannuation remains a political battleground.
Graham Hand was a media guest at the 2021 COTA Policy Forum.
The actions of central banks around the world are well known—they are undertaking substantial quantitative-easing programs to support their economies. While they have control of cash rates and their bond purchases at the shorter end have been more effective at keeping rates low, further out the curve, they have not. And even in the face of central bank purchases, investors have sold longer-dated bonds and quickly driven up rates in early 2021. Unsurprisingly, this has had flow-on effects in other markets, too, particularly equities. This article explores what is going on in the bond markets now, how our fixed-interest managers have fared, and what it means for equity markets.
Key Takeaways
× Central bank yield-curve intervention globally has been across maturities, but it has been most effective at holding rates lower at the shorter end. As expectations of inflation have risen, long-end bonds have been routed.
× This environment is a turbulent time for fixed-interest managers but has allowed some active managers to show their skill, while passive managers have typically suffered.
× The sharp move in rates is spilling over into the various parts of the equity market, and investors should be vigilant about their equity style exposure to avoid being run over should the current conditions continue.
Bond Market Moves
The free market price discovery of government bonds has been distorted by central bank interventions via various quantitative-easing programs. It is an intentional outcome to manage cash rates and the shape of yield curves to support economies around the world. Much of the focus has been at the short end, but longer-dated bonds are being bought in some regions, such as Japan, too. However, as economic conditions are in the early stages of improving, investors are starting to expect rising inflation, and this is materialising in the pricing of longer-dated bonds—for example, government bonds with a duration of at least 5 years and longer. They do that by selling those bonds, which drives yields higher. This has resulted in the Australian 10-year Government Bond yield more than doubling—it has risen to above 1.60% as at the end of February 2021 from 0.80% in October 2020. Over the same period, US 10-year bonds have moved to 1.34% from 0.65%. These are eye-catching sell-offs by historic standards.
Fixed-Interest Fund Returns
Such market moves create significant headwinds for bond managers to deliver positive returns, particularly for those strategies that are benchmark-aware. The commonly used benchmarks illustrate this—the Bloomberg Barclays Global Aggregate Index has fallen 1.35% and the Bloomberg AusBond Composite 0+Y Index dropped 4.08% from 1 October to 28 February 2021. For the funds under coverage, the average bond manager in the Australian, Global, or Global/Australia categories has fallen 2.06%—in an environment where running yields are at or near all-time lows, this a meaningful loss. Relatedly, the duration of the major benchmarks has lengthened over recent years, meaning they are now more price-sensitive to changes in interest rates.
Breaking Down Performance
Those managers who stick mostly to government bonds, like CC JCB Active Bond 41406 and Vanguard Australian Government Bond Index 16868, have borne the brunt of this market environment. But those who run more-flexible strategies, like Janus Henderson Tactical Income 17406, or those who run much lower-duration strategies, like Pimco Australia Short Term Bond 17158, have held up relatively well. See Exhibit 1 for a full list of returns from our bonds Australia Morningstar Category. At the bottom of the table are those that have had more exposure to long-dated government bonds—for example, CC JCB Active Bond 41406 and Pendal Fixed Interest 2950. Passive strategies have a persistent exposure to long-end bonds (it is the same across all the bond categories), so it is no surprise that Vanguard Australian Government Bond delivered a negative return. Note the average manager in this group delivered a negative 3.44% return.
Exhibit 1 Bonds – Australia Category Returns
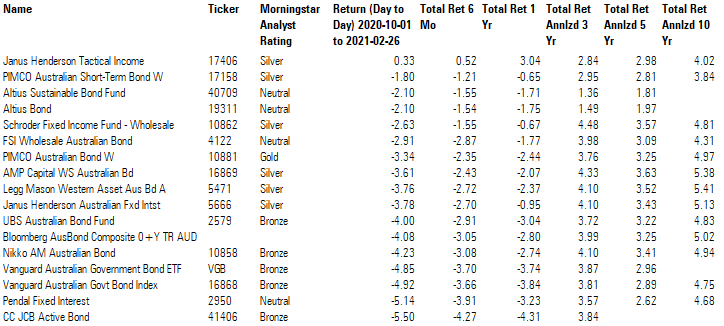
Source: Morningstar Direct. Data as of 26 February 2021.
Conditions have been slightly better in the bonds-global category, as the sell-off there hasn’t been quite as aggressive compared with the local market. From an economic recovery standpoint, Australia is further down the track than most other developed nations. The average fund under coverage here fell by 0.84% only, though the numbers are skewed by a standout performance from the highly flexible Legg Mason Brandywine Global Opportunities Fixed Income Fund 16192. Exclude that fund, and the average is negative 1.26%. Other relatively strong performances have come from strategies holding significant credit exposure and consequently little exposure to long-dated government bonds—for instance, Pimco Global Bond W 10883 and Legg Mason Western Asset Global Bond A 41551. Like the Australian category, those with a heavy allocation to global government bonds have fared the worst—again, passive strategies have been a victim of the bond market rout. See Exhibit 2 for a list of global bond fund returns.
Exhibit 2 Bonds – Global Category Returns
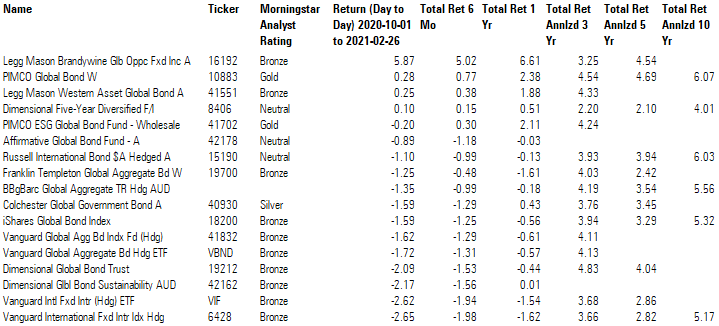
Source: Morningstar Direct. Data as of 26 February 2021.
The story is obviously the same for those that have both a global and Australian remit, as shown in Exhibit 3. Macquarie Dynamic Bond 9839 and Pimco Diversified Fixed Interest 10882 have low duration portfolios with higher allocation to corporate credit, which has helped them outperform peers. UBS Diversified Fixed Income 4866 and FSI Wholesale Diversified Fixed Interest 4712 have had an overweight duration and a lower exposure to corporate bonds, which explains their underperformance.
Exhibit 3 Bonds – Global/Australia Category Returns
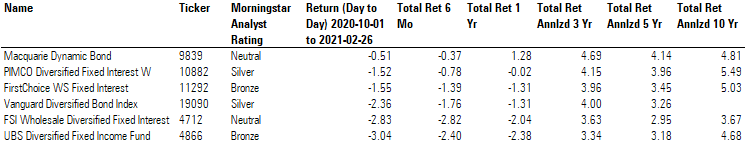
Source: Morningstar Direct. Data as of 26 February 2021.
Should Duration Be Shunned?
Some bond-fund investors may be concerned about returns of the defensive parts of their portfolios over this period and, if the 10-year yields continue to shoot higher, then further losses may be suffered. But we believe this may not be a permanent condition for the bond market, and in fact, there are several reasons to stay the course. First, long-end rates rising is a sign of good economic health. As the coronavirus vaccine rolls out, investors are forecasting a vast improvement in business conditions. This should also mean equities will benefit (more on this below), and so a well-balanced portfolio has some positive return contributors. Second, there is a well-reasoned argument that should long-end rates continue to rise, central bankers will have to step in and buy those bonds, too. Third, it is important to remember that a bond portfolio has to reinvest its assets whenever its holdings mature, often at higher interest rates. It is analogous to a continuous process of dollar-cost averaging when buying stocks. So, unless there is a sustained increase in yields, then the possibility of losing money on your bond portfolio over a three- to five-year time frame is fairly remote. See Exhibit 4 for returns of the primary global index since 1992.
Exhibit 4 Bloomberg Barclays Global Aggregate Total Return Hdg AUD – Rolling Three-Year Returns
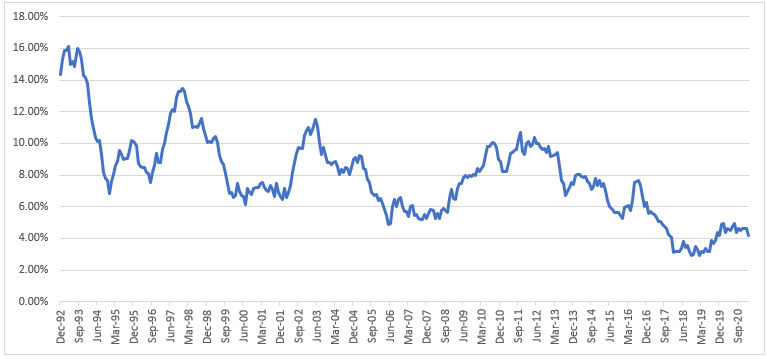
Source: Morningstar Direct. Data from 1 January 1990 to 26 February 2021.
The Implications for Other Markets
Bond market moves are watched by investors in all asset classes. The price of debt can change the valuation of virtually any security. So, when stocks started to fall at the same time that long-end bond yields started to rise, it was of little surprise. Valuations are determined by the discounting of future cash flows by an interest rate. Simplistically, if that rate is very low, then the valuation outcome is very high—and vice versa. The nuance here is that for growth companies that have high long-term expected cash flows compared with near-term cash flows, the sensitivity to a rise in interest rates is dramatic. Now consider those ‘super-growth’ companies that are reinvesting in their businesses such that they are not producing any free cash flow—their debt funding now becomes more expensive. So, it is a double whammy for them: Future earnings are discounted by a high rate, and their business costs have gone up.
Investors have noted this fact, as value (MSCI World Value NR USD) outperformed growth (MSCI World Growth NR USD) by 8.06 percentage points over the five-month period from 1 October to 28 February 2021. This was a significant change after many years of growth outperforming value. This coincided with the return of Morningstar US 10+Yr Treasury Bond TR Hedged AUD falling by 13.21%. But if we focus on February 2021, where bond yields moved rapidly higher, the growth index was virtually flat, while the value index was up 4.70%. See Exhibit 5 for details of the period.
Exhibit 5 Global Equity Style Returns
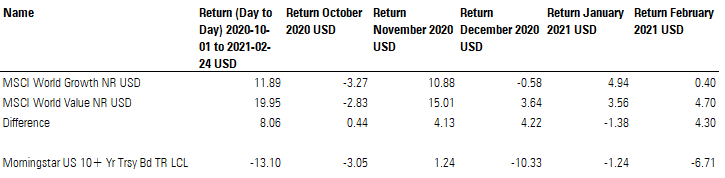
Source: Morningstar Direct. Data as of 26 February 2021.
We acknowledge the above is a very short time period, but if long-end rates continue to climb, it could be a turning point for the growth-value dispersion that has moved ever wider since 2010. For those investors positioned in growth-oriented equity portfolios, we would encourage a more balanced approach across equity styles.
Portfolio Construction
We recommend investors not completely shun duration in their bond portfolios. Good portfolio construction uses the typically zero or negative correlation that equities have with bonds. Furthermore, long-end rates will provide the best protection should equity markets wobble. For those wishing to avoid the risk of rising rates, combining an active strategy (that is benchmark-aware) with a highly rated flexible-bond manager can be a prudent approach.
On the other side of the portfolio, equity returns have been very strong in recent months, and it may have pushed investor portfolios’ growth/defensive asset splits away from targets. In this case, a portfolio rebalance might be in order. As mentioned above, see which equity funds have moved the most and ensure there is appropriate balance across the equity investment styles.
The recovery of US stocks and the profusion of new trading platforms drew huge numbers of novice traders.
Did you start investing during the pandemic? You’re not alone. New data from research firm Investment Trends shows over 400,000 Australians placed their first trade in the Australian securities market over the last 12 months.
Newer investors are young and flocking to international markets. One in six first-time investors is under the age of 25, the Investment Trends survey finds. Participation in international equities trading doubled from 54,000 to 109,000 in the 12 months to December 2020.
Irene Guiamatsia, head of research at Investment Trends, attributes the historic growth to the strong recovery of US stocks in the months after the pandemic-induced market crash and growth of investment platforms offering access to global markets – many at zero commission.
“The spectacular recovery witnessed by US stocks in the second half of 2020 has captured the attention of a global audience, prompting many Australians to consider investing beyond local equities,” she says.
“A greater choice of investment platforms has been a key driver for uptake, with recent new entrants giving investors more choice than ever.”
Morningstar data shows the market downturn caused by the covid-19 pandemic was one of the most severe in recent history, but it also proved to be one of the fastest recoveries. After a decline of 20 per cent (in real terms) from December 2019 to March 2020, the US equity market fully recovered in just four months and was back to its pre-crash level by July, soon pushing higher.
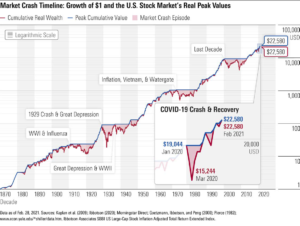
Platforms, social drive growth
Angel Zhong, a senior lecturer in finance in the school of economics, finance and marketing at RMIT University, says the growth in new investors is driven by several factors including low interest rates, dramatic volatility in the share markets around the world, and the emergence of low-cost trading platforms like SuperHero, Stake and eToro.
“Retail investors are shown by research to prefer low-priced stocks,” Zhong says. “The fear-of-missing-out and get-rich-quick are general behavioural biases observed in retail investors.
“Low-cost trading platforms further fuelled and lured young and novice investors’ entrance to the share market for the very first time,” she added.
Data released by Commonwealth Bank reveals more than 230,000 new accounts were opened on its CommSec platform or through its Pocket accounts over the last half year. The number of first-time traders has more than doubled since February 2020. The majority of these new CommSec customers (83 per cent) were under 44 years of age – a 17 per cent increase compared with pre-covid trends.
Meanwhile, Australian-born trading platform Stake saw a surge on sign-ups and an increase in trading volumes in the first half of 2020. The online broker has amassed over 100,000 users since launching three years ago. New users jumped 129 per cent in the six months to June 2020, compared with the previous half-year. Zip and Afterpay-backed trading platform SuperHero, which launched last year, told investors it had attracted 35,000 customers at the end of January.
Zhong also points to the growth of unmoderated financial and investing advice on social media platforms like YouTube, Facebook, TikTok and Reddit, which she says is driving social trading. Social trading refers to investors acting on investment advice they receive online, often unlicensed. It can also refer to a feature offered by several brokers that allows investors to copy the trades of others on the platform.
“Both are at play here, although the former is more prevalent in Australia,” she says.

Zhong says external economic factors like government stimulus payments are associated with larger increase in retail trading volume. “Countries with larger gambling revenue prior to COVID-19 were associated with a greater increase in retail trading last year, since investors see the stock market as a substitute for gambling.”
The new cohort means Australia’s active retail online investor population stands at 1.25 million, Investment Trends estimates.
Education rethink
Both Zhong and Investment Trends say the entrance of new, inexperienced investors must be met by financial and investing education.
“Too many times we’ve heard stories of investors getting caught up in FOMO, making rash short-sighted investing decisions. But our research highlights that investors are hungry for knowledge, resources and tools to help them build long-term wealth,” Guiamatsia says.
CommSec launched their new Learn program last month which “arms investors with knowledge to make informed investment decisions”. The broker reports a 200 per cent increase in investors seeking executional information via the website, such as “how to place a trade”, over the past 12 months.
“There was a thirst for learning; however, it was interestingly leaning towards more executional topics with fewer clicks on the important basics such as planning or
strategizing,” CommSec executive general manager Richard Burns says.
Zhong believes investors who lack financial literacy are vulnerable to social trading and could incur losses in the share market.
The Investment Trends 2020 2H Australia Online Investing Report was based on a survey of 18,731 investors and traders.
Mentioned: AMP Ltd (AMP), Commonwealth Bank of Australia (CBA), Challenger Ltd (CGF), Dexus (DXS), Insurance Australia Group Ltd (IAG), Mirvac Group (MGR), Macquarie Group Ltd (MQG), Newcrest Mining Ltd (NCM), Suncorp Group Ltd (SUN), Transurban Group (TCL), Telstra Corp Ltd (TLS)
The second week of earnings season typically features financial heavyweights, property firms and the major telecoms player. In other words, sectors that have felt the impact of the pandemic harder than others. But surprisingly, the news this week has been heartening.
As results during the reporting season indicated, the second half of 2020 didn’t prove to be a drag on ASX-listed companies. This week’s announcements have built further on that theme. What the numbers clearly show is that corporate Australia has put the worst effects of the pandemic behind. Investors are in line for much better returns.
“There was little to rave about in the first-half earnings release, though the future holds the prospect of stronger earnings growth,” Morningstar analyst Shaun Ler said about the Challenger Financial (ASX: CGF) results, but his words would hold true for most of the large companies that reported this week.
Eyes on CBA and Telstra
Commonwealth Bank (ASX: CBA) and Telstra (ASX: TLS)—the dominant players in their respective sectors, were the most watched stocks for the week.
Australia’s biggest bank posted a 10.8 per cent drop in half-year cash profit, after coronavirus-related lockdowns pushed up its expected loan losses. But chief executive Matt Comyn on Thursday signalled a rebound in investment and hirings as the economy recovers.
He underlined that positive outlook by lifting the interim dividend 50 per cent to $1.50 a share, and also flagged the prospect of higher payments later in the year.
Morningstar equity analyst Nathan Zaia called the results “stronger than expected”.
“Lower loan losses in the medium term, expectations of stronger business lending growth, and the time value of money,” were the reasons Zaia assigned for increasing his fair value estimate of CBA shares by 8 per cent to $77 each. Zaia expects the bank will begin to return excess capital to shareholders within the next 12 months.

Australia’s biggest bank posted a 10.8pc drop in half-year cash profit, after coronavirus-related lockdowns pushed up its expected loan losses. But chief executive Matt Comyn on Thursday signalled a rebound in investment and hirings as the economy recovers
Telstra’s half-year income also dropped—down more than 10 per cent due to hits from COVID-19 and the NBN, while revenue was down 9.7 per cent. Still, the telco maintained its 8 cents-a-share dividend.
Senior equity analyst Brian Han says the preliminary impact of COVID-19 on Telstra demonstrated the relative resilience of its earnings and the comfort of its balance sheet.
“Critically, the guidance for another 8 cents a share (dividend) in the second half sends a positive signal on management’s line of sight to near-term cash flow trajectory,” he added. Shares in the narrow-moat-rated Telstra are trading below Morningstar’s $3.80 fair value estimate.
Mixed results for financials
Other financial heavyweights reported a mixed bag of results but most forecast improved prospects.
Macquarie Group (ASX: MQG) signalled a rebound in its third quarter trading update, helped by increased commodities trading amid the pandemic. It now expects full-year profit to only be “slightly down” on the previous year, eclipsing analysts fears of a sharp decline.
Investment manager Challenger Financial also benefited from strong inflows in its funds management unit and rising momentum in its life business. It reiterated full-year earnings guidance of $390 million to $440 million.
“Challenger is in much better shape since last year’s COVID-19 scare. A strong capital position saw dividends resume, product sales are improving and cash operating earnings margins and returns on equity will likely improve in the medium term,” Morningstar’s Ler said, while lifting his fair value estimate slightly to $ 7.50 per share.
Beleaguered wealth manager AMP Ltd (ASX: AMP) also swung to a full-year profit of $177 million, compared to a $2.5 billion loss in 2019, but its shares lost ground after US suitor Ares Management dropped a $6 billion-plus bid for the 172-year-old group.
General insurance firms have been hard pressed to deal with adverse court rulings related to COVID in their business interruption policies, as well as rising natural hazard costs. But that doesn’t seem to have affected their core earnings.
The higher provisioning caused Insurance Australia Group (ASX: IAG) to post a $460 million loss, but its half-year cash earnings jumped 22 per cent to $462 million. Rival Suncorp (ASX: SUN) also saw higher earnings across all business lines in the six months through December, pushing its cash profit higher.
Shares in the two companies jumped on the news, but both stocks remain undervalued to Morningstar’s fair value estimates.
Return to offices
Meanwhile, the country’s largest listed office owner reported half-year earnings this week, just as corporate Australia is returning to offices. Contrary to expectations, the working from home (WFH) trend has not weighed heavily on its books.
Dexus (ASX: DXS) reported a 55 per cent decline in first-half profit but much of this was because of asset revaluation gains being lower from a year ago.
Despite the pandemic, Dexus managed to lease over 100,000 square metres of office space
—a 24 per cent jump from the previous year—as multinational tenants looked through near-term uncertainty to sign long-term leases. It expects to maintain full-year distribution per security.

Despite the pandemic, Dexus managed to lease over 100,000sq m of office space —a 24pc jump from the previous year—as multinational tenants looked through near-term uncertainty to sign long-term leases
On the other hand, developer Mirvac (ASX: MGR), which has a significant residential housing presence, posted a 35 per cent fall in first-half profit on Friday. It still declared an interim distribution of 4.8 cents per share.
Transurban’s lonely road
Among other major companies, Australia’s biggest toll road operator Transurban Group (ASX: TCL) plunged to a $448 million half-year net loss, as daily traffic skidded on its road network due to the disruption caused by the pandemic.
Lower toll revenues slashed earnings by 23 per cent to $840 million, and the company cut its interim dividend to 15 cents per share. But analysts have shrugged off its rare weak results.
“Conditions should improve from here and we expect significant growth in the second half as the firm cycles the heavily virus-impacted second-half fiscal 2020,” Morningstar senior equity analyst Adrian Atkins said.
While he has trimmed Transurban’s earnings forecast slightly, Atkins says traffic volumes in Sydney and Brisbane early this year have been as good or better than pre-COVID-19 levels. Melbourne is rapidly improving and he expects US roads to recover through 2021.
Gold miner Newcrest (ASX: NCM) was among the earliest sector companies posting
half-year results this week, and it did not disappoint with net profit more than doubling to
$US553 million, and an interim dividend of 15 US cents a share.
The improvement mainly reflected a 26 per cent uplift in the gold price and a 17 per cent rise in the copper price, Morningstar director Mathew Hodge noted. Newcrest shares remain undervalued below his $28.50 fair value estimate.
Next week will be the busiest of this earnings season. Major companies that we will be watching include:
- JB Hi-Fi (ASX: JBH)
- BHP (ASX: BHP)
- Rio Tinto (ASX: RIO)
- Fortescue Metals (ASX: FMG)
- Coles Group (ASX: COL)
- Aurizon Holdings (ASX: AZJ)
- Ansell (ASX: ANN)
- Adairs (ASX: ADH)
- Breville Group (ASX:BRG)
- Dominos Pizza (ASX: DMP)
- Treasury Wine Estates (ASX: TWE)
- Super Retail Group (ASX: SUL)
- Coca Cola Amatil (ASX: CCL)
- Tabcorp (ASX: TAH)
- Santos (ASX: STO)
- Woodside Petroleum (ASX: WPH)
- QBE (ASX: QBE)
- Star Entertainment (ASX: SGR)
MORE ON THIS TOPIC: MORNINGSTAR EARNINGS SEASON CALENDAR
Mentioned: AGL Energy Ltd (AGL), Amcor PLC (AMC), BWP Trust (BWP), Janus Henderson Group PLC DR (JHG), News Corp DR (NWS), Origin Energy Ltd (ORG), REA Group Ltd (REA), ResMed Inc DR (RMD), Reliance Worldwide Corp Ltd (RWC)
The first of the company results have offered a peek into what the February earnings season has on offer for investors. The numbers show that despite a pandemic raging across the world, the second half of 2020 wasn’t all that bad for corporate Australia.
As Morningstar’s head of equity research Peter Warnes foreshadowed in his newsletter last week, the backward-looking results reflect the height of the pandemic but also the peak of government support and stimulus.
Some businesses have certainly felt the impact of lockdowns and closed borders, but many companies have held their own and several, in fact, have managed to capitalise on new revenue streams and new ways of doing business.
That approach was best reflected in the bumper earnings detailed by plumbing fixtures manufacturer Reliance Worldwide (ASX: RWC) and packaging giant Amcor (ASX: AMC).
Reliance’s first-half sales jumped by 13 per cent to $642 million, and earnings will be at least 30 per cent higher from a year ago. The company benefited from coronavirus-related social distancing measures in its key US, UK and Australian markets driving a near-term boom in DIY home improvement and repair.
It has been a similar case with Amcor, which delivered a 6 per cent lift in half-year profit, as lockdowns in North America and Europe lifted demand for readymade meals, juices, coffee and pet food products that use Amcor packaging.
The strength in consumer categories helped offset weakness in Amcor’s healthcare franchise which has suffered from dramatically reduced elective surgeries and pharmacy visits amid the pandemic, Morningstar senior equity analyst Grant Slade said.
As a result, Slade has raised Amcor’s FY2021 earnings per share forecast by 6 per cent, but still retains the $16.30 a share fair value estimate on the undervalued stock.
Streaming subscriptions boost News
Coronavirus hasn’t just bolstered growth in retail or home improvement-related sectors; media consumption has jumped too.
Media giant News Corp (ASX: NWS) more than doubled its December quarter net profit to $198.4 million, helped by a surge in subscriptions and advertising across its digital platforms.
While revenue has continued to fall at its Australian print mastheads, its Foxtel joint venture with Telstra reported a large increase in paying subscribers due to the growth of streaming services Kayo Sports and Binge.
On Friday, News Corp shares on the ASX surged more than 12 per cent to $28.24 each, and still screen as overvalued above Morningstar’s fair value estimate of $19.50. Senior analyst Brian Han had lifted the fair value by 6 per cent in November following strong first quarter results.
News Corp’s real estate listing arm REA Group (ASX: REA) also delivered a 17 per cent jump in net profit for the December quarter, although revenue fell 2 per cent to $430 million. The news helped push up the stock price by 3.5 per cent $159.60 a share, far exceeding Morningstar’s fair value estimate of $80.
Analyst reports for the two stocks will follow in the coming days.
Meanwhile, medical device maker ResMed (ASX: RMD) is confident it can take advantage of the growing focus on remote or at-home healthcare.
It posted a 12 per cent jump in profit and a 7 per cent rise in revenues for the December quarter, helped by continuing hospital demand for its ventilator products and some recovery for its core sleep apnea solutions.
“While ResMed stands to benefit from structural trends in respiratory and digital health, we still expect sleep apnea diagnosis rates to remain under pressure near-term due to the pandemic,” Morningstar analyst Johannes Faul said.
Nevertheless, Faul has raised his fair value estimate for the company by 5 per cent to $US 145 to reflect the strong results. For the ASX-listed stock, however, the fair value was down by 3 per cent to $19 a share to account for the stronger Australian currency.
Duller picture for power operators
Not all earnings news was positive in this first week. Australia’s two biggest electricity operators outlined hefty write downs due to weaker power prices.
Origin Energy (ASX: ORG) cut its full-year earnings guidance by 8.6 per cent, citing subdued energy demand due to a combination of coronavirus and a milder summer, and higher costs in its gas business.
Rival AGL (ASX: AGL) said it will write down charges of $2.69 billion in its half-year results, reflecting the recent deterioration in long-term wholesale energy prices and challenging macro-economic conditions.
“The core issue is low wholesale electricity prices and government policies aimed at keeping them suppressed for an extended period,” Morningstar senior analyst Adrian Atkins says. He has toned down his medium-term electricity price assumptions and trimmed earnings forecasts for the two utilities.
He now expects AGL and Origin’s earnings before interest tax depreciation and amortisations (EBITDA) to fall at average annual rates of 6.2 per cent and 1.8 per cent respectively for the next five years. Over the longer-term, however, electricity prices and earnings will recover, he said.
Real estate insights
Among other key companies reporting this week, BWP Trust (ASX: BWP) provided an insight into prospects of the highly defensive real estate sector.
BWP, which gets the bulk of its rent from Bunnings Warehouse outlets, reported nearly unchanged revenue for the half-year result. Rent abatements to smaller tenants affected by virus lockdowns pared back some profit but this was more than offset by gains in the value of its investment properties.
Morningstar analyst Adrian Atkins maintained his $3.60 a share fair value estimate, although the stock trades 19 per cent above his valuation.
Janus Henderson (ASX: JHG) posted a 12 per cent rise in assets under management for the December quarter, while outflows of $US1.1 billion were the lowest since it was established. The fund manager also announced that its largest shareholder—Japan’s
Dai-ichi Life Holdings, which holds a 17 per cent stake, would sell-off its holdings.
Morningstar analyst Gregory Warren has kept unchanged his $US28 ($36) per share fair value estimate for the narrow-moat company.
Looking forward, the earnings season will really kick into gear next week with financial heavyweights, Telstra and some miners among the companies reporting.
They include:
- Challenger Financial (ASX: CGF)
- Commonwealth Bank (ASX: CBA)
- Suncorp (ASX: SUN)
- Insurance Australia Group (ASX: IAG)
- AMP Ltd (ASX: AMP)
- ASX Ltd (ASX: ASX)
- Telstra (ASX: TLS)
- Transurban Group (ASX: TCL)
- Newcrest Mining (ASX: NCM)
MORE ON THIS TOPIC: MORNINGSTAR EARNINGS SEASON CALENDAR
The Reserve Bank of Australia (RBA) and Amazon have a lot in common in 2021. They have both positioned themselves as the premier high volume, low price, low margin product provider. They are redefining logistics in their distribution channels. Their current market position on price competition and sheer scale of influence unleashes factors of productivity improvement and makes it difficult for others to compete on traditional business models.
The message of ‘lower for longer’ interest rates has been heard loud and clear from a cheerful and optimistic Governor of the RBA, Philip Lowe, including an unrelenting expansion of its balance sheet. Last week alone it grew by another $10 billion to $344 billion. This is $66 billion higher since 30 June 2020 and deposits from Australian banks (in the form of Exchange Settlement balances) have risen by $94 billion.
The banking system is literally awash with cash and banks are turning away deposits while rapidly reducing the rates paid to savers. A cash flow optimisation strategy by the Government to stimulate activity is the current modus operandi, and it’s creating favourable conditions for risk assets.
RBA lavishes the funding
At the start of 2020, before COVID-19 struck, the RBA balance sheet was worth about 9% of Australia’s GDP, down from a peak of about 13% during the GFC. Following a year of bond purchases to hold down the three-year rate and fund government expenditure, the balance sheet has doubled to 18% of GDP.
But the RBA’s control of the supply and price of funds comes not only from the way it sets targets for low bond rates, but also its Term Funding Facility (TFF). It offers three-year funding to banks (actually, authorised deposit-taking institutions or ADIs) to reduce funding costs which are then passed on to borrowers. It is specifically aimed at ADIs if they expand their lending to businesses, notably small and medium-sized enterprises (SMEs).
The Reserve Bank largesse with loans and liquidity is changing the bank deposit market. The amounts involved are extraordinary, as explained by the RBA, with the funds available being:
“five times the dollar increase in SME Credit Outstanding from the three months ending 31 January 2020 through to the three months ending 30 April 2021”
Five times! And here’s why retail deposit rates have fallen. The interest rate for the TFF for three years is only 0.1%.
There is so much liquidity in the banking system that the bank bill rate, the benchmark against which many other facilities and securities are priced including bank term deposits and hybrids, is only 0.01%. That’s right … one basis point. Easy monetary policy has reduced the burden for borrowers and is now driving up residential house prices, but it has not helped the millions of savers and retirees who live on deposit income. As recently as a decade ago, term deposits offered a reasonable 4-5%.
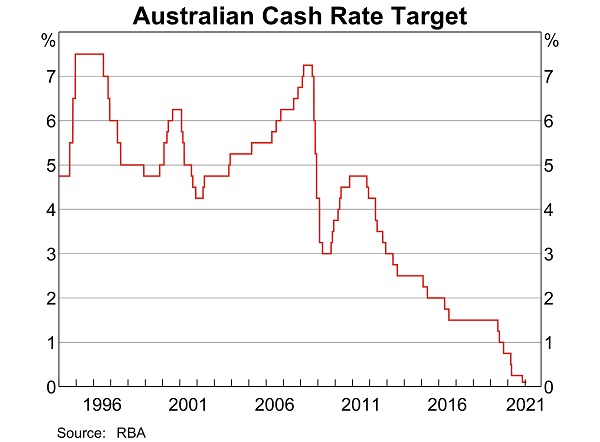
An example of a big winner is Judo Bank, which made a pre-tax loss of $50 million in 2020. Judo Bank will draw on $2 billion of the TFF from an allocated allowance of $6 billion. Judo’s substantial growth of $1.3 billion in SME lending in the year ending 31 January 2021 has been multiplied by the factor of five and a supporting internal securitisation framework acceptable to the regulators has been reached. Judo is a startup bank but it will not have any funding problems for years.
Reducing Judo’s cost of funds will materially improve its profit as it has been competing aggressively for retail deposits, previously its main source of funding. It is currently paying up to 1.2% for retail deposits and attracting strong inflows as deposits up to $250,000 are protected under the Australian Government Guarantee (the Financial Claims Scheme).
Joseph Healy, CEO of Judo Bank, told Banking Day on 3 February 2021:
“Our focus on marketing term deposits of more than 12 months duration will continue but accessing the TFF will reduce our appetite for deposits of shorter duration.”
Judo Bank has a real economic advantage now to reduce its cost of funds and recalibrate its wholesale and retail pricing, probably to the disadvantage of current investors. However, actions will be tempered by the desire to build long-term relationships on both sides of the balance sheet to prepare for the day when the RBA is not as benevolent.
Banking system awash with cash
One reason the major banks have not tapped into the TFF in a bigger way is they are flooded with cheap retail deposits. The banks are literally saturated with deposits and are turning away institutional money so they can provide some capacity to their retail customers. As the chart below on bank funding shows, domestic deposits are now satisfying more of the funding needs of Australian banks than ever before.
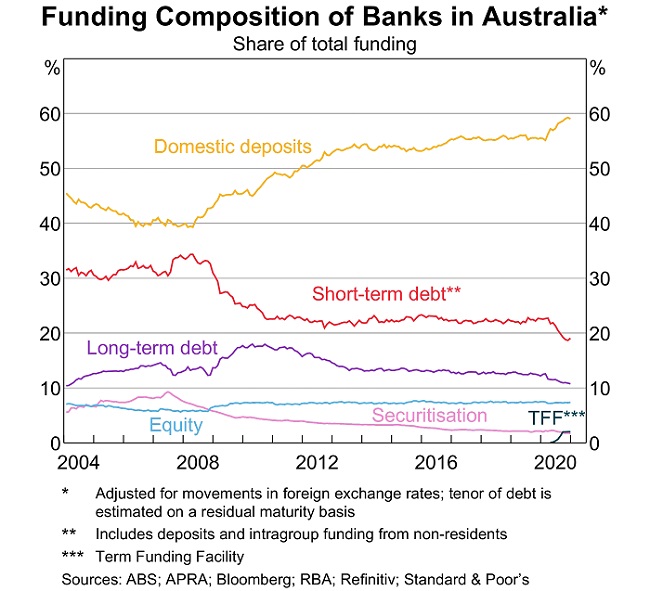
What do banks do with their surplus cash, since they cannot lend it quickly enough? They deposit with the RBA at 0%. Funds on deposit at the RBA at 0% are $160 billion and rising rapidly, and we estimate they could rise to $360 billion by 1 October 2021. The RBA balance sheet is set to grow from $344 billion to a forecast $500 billion over the same time.
Traditional lenders to banks such as councils are finding it difficult to place their money. Each bank is travelling a slow, last kilometre in heavy congestion to position their middle market and retail pricing at the ‘what we can get away with’ level. The correct pricing and allocations of quotas to identified ‘customers of the future’ take up most of the strategic decision-making of bank treasurers and liability management committees at the moment.
Price discouragement strategies are the new playbook.
On the asset side, expect marketing campaigns on credit availability and price to be sweetened with loyalty recognition in many forms. St George’s “Switch banks, get a $4k thanks” campaign is the latest one.
Plenty of money to finance asset price surge
Cash investors realise they have no pricing power these days and they are evaluating their alternatives. Watching the billions of dollars of cash looking for a home each day leads to the view that the current debate raging around speculative asset bubbles is far too early in the investment cycle. We are now only emerging from a pessimistic phase and are in the early stages of an optimistic mindset. The euphoric phase is much further into the future.
Those wary of inflated prices should be more worried at the end of Governor Lowe’s three-year timeframe. The real economy will be the major beneficiary of all this liquidity and lending capacity over the next few years, until 2024 at least.
The post COVID-19 recovery period could parallel two key economic periods in our past: the ‘Roaring Twenties’ of a century ago and more recently, the post-WWII recovery period of the 1950s to early 1970s. Financial markets were heavily regulated and the real economy was the powerhouse of the global economy. In the latter stages inflation surged with the oil price shock of 1972 and interest rates violently adjusted to dizzying heights over a span of nearly two decades, but the inflationary consequences of central bank expansion are not on the short-term radar at the moment.
Retirees planning for spending in retirement who once believed the bond or term deposit part of their asset allocation would deliver income to live on now need to go up the risk curve, or draw down their capital. Banks will be awash with liquidity for years and will not compete for the retiree dollar.
Even the new banks who once paid up for deposits now have retirees in a judo hold with the RBA providing another source of cheaper funds. The RBA has become the equivalent of an online retailer who undercuts all other prices in the market.
A perfect storm is brewing for active managers. Magellan’s transformation of its three global equity funds into a single unit structure, accessible on and off the ASX, simplified the process of bringing an unlisted fund to the exchange. Meanwhile, ASIC’s lifting of its six-month suspension of non-transparent actively managed ETFs removed uncertainty surrounding the use of internal market makers. This has cleared the way for active managers to grab a bigger piece of the $80 billion ETF pie.
“This new listed/unlisted structure will see a wave of managers looking to list actively managed products,” Chi-X director, product, sales and data, Shane Miller says.
“For a manager, it’s just a simpler process to add exchange distribution rather than duplicating everything. Plus, they get to leverage their fund’s existing ratings and performance history.”
Magellan’s restructure of its global fund last year from an open-end fund, an ETF and a closed-end fund into two classes of units; an open-end (MGOC) and a closed-end fund, brought a new find of active ETF to the exchange. It essentially combines the feature of a traditional unlisted managed fund and an active ETF. Previously managers were forced to create a copy of their existing fund for the purpose of listing.
Miller expects an incredible 30 ETFs will be quoted on Chi-X by mid-2021, adding to the 11 trading today. “The majority of those listing to come are actively managed ETFs,” he says. As the junior rival, Chi-X’s activity gives you an idea of what could be happening at the ASX.
“We’ve taken a lot of phone calls from managers who are looking to add exchange distribution to their existing products,” Chi-X head of product development Ross Pullen says.
“They’re looking at how much is flowing into passive ETFs and thinking there’s a whole distribution area we’re not accessing – particularly SMSFs.”
Active ETFs are still a small piece of the Australian ETF industry
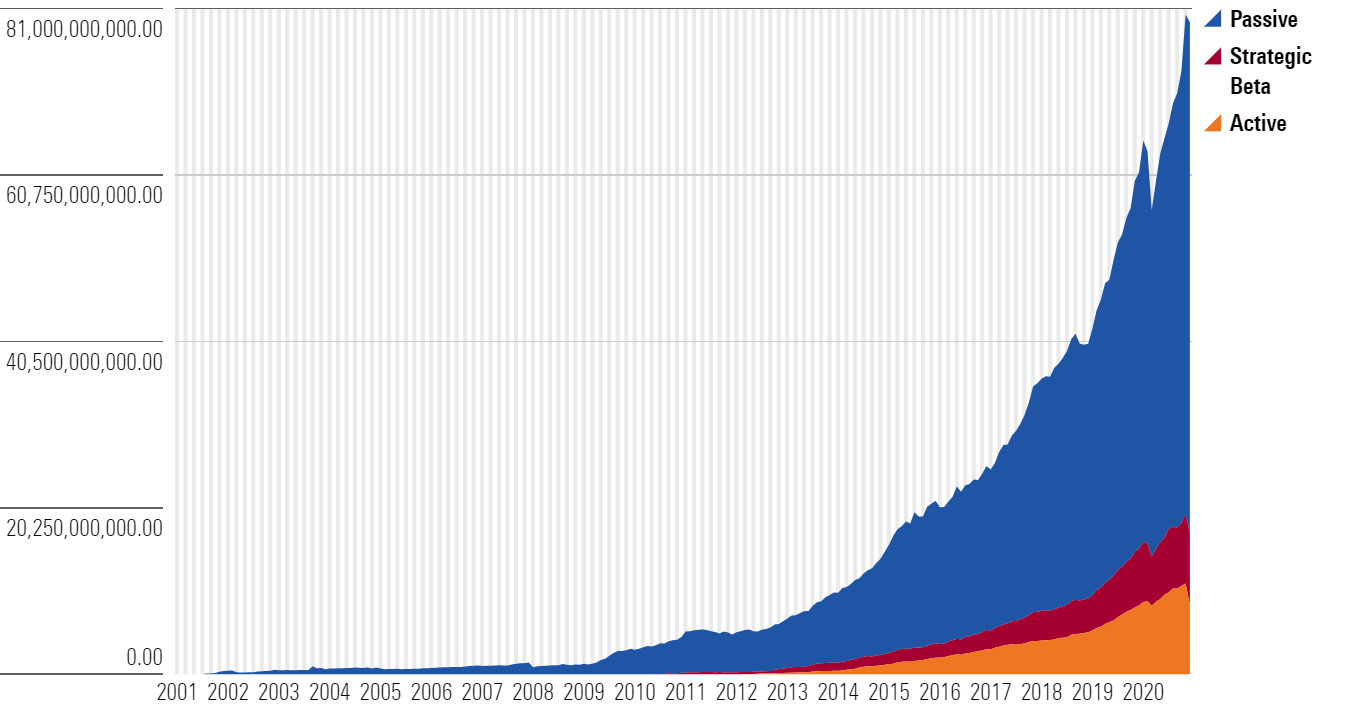
Source: Morningstar Direct
Active ETFs aren’t new to the Australian market, but most product providers have failed to attract significant attention. In 2020, passive products pulled in over $17 billion to active’s $2 billion. Retail investors are far more likely to use passive ETFs to build their portfolios citing historic underperformance, fees and simplicity.
Active ETFs combine the benefits of active fund management with the convenience of share trading. They are managed by a team of portfolio managers who make decisions on the underlying portfolio allocation and aim to outperform an index or benchmark.
Chris Meyer, director, listed products at Pinnacle Investment, cites several reasons for underwhelming flows, including a lack of branding, marketing and awareness for retail investors, and the industries’ inability to break into the advice/broker market.
Retail assets in Australian unlisted funds have grown steady over the last decade thanks in part to strong relationships between managers and the advice community, but it’s clear firms can see the train coming. In the US, the scale has tipped in the opposite direction, with investors accessing more listed products than unlisted in 2020. ETFs took in a record $502 billion in 2020, while investors pulled $289 billion from open-end mutual funds, Morningstar data shows. While mutual funds total assets still dwarf those in ETFs, Morningstar’s John Rekenthaler believes ETFs are positioned to take over.
“ETFs offer several advantages that managed funds cannot match,” he says. “Eventually, assets will be on their side.”
The wild success of the ARK Innovation ETF in the US also shows the market for active products is there. But there are other good reasons for managers to diversify their distribution strategy, chief among them the shifting advice landscape.
Ark’s red-hot actively-managed ETF is one of the fastest growing funds in the US
.jpg)
ARK Innovation ETF (ARKK) estimated flows and returns. Source: Morningstar Direct
“Advisers are looking for ways to simplify the business operations, with some moving towards separately managed accounts,” he says referring to a professionally managed investment product where investors directly own the underlying securities (rather than having their funds pooled with other investors).
“Listed products fit quite nicely inside managed accounts. As that trend takes hold, I think it stands to reason that listed funds inside these SMAs will gain more traction.”
Secondary reasons include access to a wider market and future proofing. Several roadblocks have locked unadvised retail investors out of the unlisted fund market, including high minimum entry amounts, long hand-written application forms and a general industry lack of interest in retail communication. Some managers have got it right. Magellan packed a convention centre in Sydney last year with retail investors, all of whom walked out with a promotional umbrella. The manager pioneered active ETFs in Australia.
New faces
So, who will be the next to list? Boutique growth manager Hyperion Asset Management will expand the footprint of its top performing global equity fund with an actively listed version on the ASX next month. Portfolio managers Mark Arnold and Jason Orthman say the product was born off the back of strong demand from advisers who are “wanting more and more listed products” and brokers. The new Magellan-style structure also appealed.
“The drumbeat has just gotten louder and louder to list, particularly from advisers” Orthman says. “And this new structure means we can have an quoted version of the same fund. You can inherit all the same research ratings, platforms, performance track record and unit prices. Plus, the fund already has over $1 billion in it, so fund size isn’t a worry.”
New research by Morningstar’s Matthew Wilkinson shows some, particularly smaller ETFs, have run into considerable liquidity problems during times of extreme market volatility, as was seen in March 2020. Investors faced wide spreads, very thin market depth and instances of no bids or offers.
Meyer says the option of listing an existing fund, which carries the same analysts’ rating, shouldn’t be underestimated. “Funds, whether they’re listed or unlisted, still need good research ratings, still need to be in the approved product lists of advisers and brokers, and therefore still need a good track record. It’s not like listed funds is a magic silver bullet for access to new capital.”
Arnold and Orthman say they’re hoping the listed structure will appeal to both advisers and retail investors who prefer listed funds. “That’s a segment of the market we haven’t been able to access historically,” Arnold says.
The listing comes after a strong decade for the fund, outperforming the MSCI World Ex Australia NR index over the 1, 3, and 5-year period. Stock picking success across the firm’s three funds has helped it double funds under management, from $1.71 billion in 2019 to $3.5 billion today.
But Hyperion is just the beginning. Asset-class diversification is coming too. Miller says the 30 ETFs he anticipates will list on Chi-X will represent a range of asset classes including fixed income, Australian equity, international equities and liquid alternatives.
Meyer expects a lot of the action will be among fixed-income and global equity issuers due to the concentration of investor portfolios in Australian equities and the difficulty in accessing those asset classes.
The exchanges added 10 active products in 2020, including five from Magellan. Other issuers include Fidelity Australia, Antipodes, Intelligent Investor, K2, eInvest, Montgomery, Schroders and Platinum.
Active listings have grown since 2015
.jpg)
Number of ETFs listing on Australian exchanges, by year. Source: Morningstar Direct
If we build it, will they come?
There are thousands of unlisted funds domiciled in Australia. Does this mean the floodgates will open? Unlikely. While interest is increasing, there are still several hurdles.
It’s one thing to list a product. It’s another to attract flows. Meyer says he believes managers will seek to establish a name for themselves in the unlisted world first before using the exchange.
“We advised Hyperion to wait for strong performance and inflows in their unlisted fund before they listed,” he says. “I believe the formula for a successful ETF listing should happen off the back of a successful unlisted managed fund, and not the other way around. At least until there is a wholesale move by advisers off platforms and onto the exchange.”
Miller agrees, saying issuers will begin by tapping into their existing relationships with full-service brokers and platforms, before building out a brand marketing campaign for direct investors.
“If no one knows to look for your product, it’s not going to sell,” he says. “If you’ve got a brand name, we can offer a mechanism to access it, but that just listing isn’t enough in itself to draw in investors.”
Setting up an active product is also easier said than done. Issuers must meet exchange criteria, link with a market maker, build out an internal infrastructure etc. Miller says, however, that once managers go through the complexity of listing one fund, it’s easier to list a second, and so on.
Morningstar senior analyst Christopher Franz has questioned whether the same research house ratings will flow between distribution models. He says at Morningstar, active ETFs are rated the same as open-end funds from an operational standpoint, meaning an analyst could adjust their view of a fund based on possible risks or difference in fee level.
Analysts have long warned about the pitfalls of trading less-liquid ETFs particularly on volatile trading days. Platinum’s Asia fund (unlisted) and Asia ETF PAXX (listed) held two different ratings, gold the former, silver the latter, due in part to trading costs and wide spreads during periods of market volatility.
The active management industry will also need to repair its relationship with retail investors, and frankly, in many cases, introduce themselves. Former Morningstar senior analyst Andrew Miles says retail investors are within their rights to question the value of global equity active management, in particular, after decades of underperformance.
Investors can be forgiven for their disbelief. Issuers have trotted out the same message for the past few years – this is the year for active ETFs, everything is just right. But whether they take-off this year or the next, increased activity signals that exchanges are continuing to democratise access to investment products. Active joining the party will only amplify that trend.
Mentioned: Ansell Ltd (ANN), Australia and New Zealand Banking Group Ltd (ANZ), BHP Group Ltd (BHP), Breville Group Ltd (BRG), Cochlear Ltd (COH), Crown Resorts Ltd (CWN), Domino’s Pizza Enterprises Ltd (DMP), Fortescue Metals Group Ltd (FMG), JB Hi Fi Ltd (JBH), National Australia Bank Ltd (NAB), Rio Tinto Ltd (RIO), South32 Ltd (S32), The Star Entertainment Group Ltd (SGR), Treasury Wine Estates Ltd (TWE), Westpac Banking Corp (WBC)
The busiest week of this earnings season has proven to be the best one for investors so far. Not only have the numbers been on the mend, most companies are back to handing out pots of cash to shareholders and promising better times to come.
As was already apparent from the results in the first two weeks, corporate Australia is firmly scrubbing off the effects of the coronavirus pandemic. A number of companies have now offered to return the JobKeeper wage assistance to the government as trading conditions improve substantially.
The third week of earnings has featured three of the big four banks, the three major miners, two casino operators and a number of market favourites such as Treasury Wine Estates (ASX: TWE) and Cochlear (ASX: COH).
JB Hi-Fi (ASX: JBH) kicked off proceedings for the week, proving again that serving consumers during the pandemic has proven extremely lucrative for the retail chains.
Half-year sales at the consumer electronics giant jumped nearly a quarter and net profit surged 86 per cent to $317.70 million, in part reflecting the online shopping boom through the pandemic. It nearly doubled interim dividend to $1.80 a share, becoming the latest retailer to ramp up payments to shareholders.
Morningstar director Johannes Faul, though, has stayed cautious on the no-moat company, and is forecasting negative sales growth from March.
“The market is likely expecting sales and profits to remain at abnormally high levels for longer than we expect,” he said. “We forecast earnings to come off the pandemic- induced cyclical high and expect dividends to fall back to $1.64 per share in fiscal 2022.”

JB HiFi’s performance showed that serving consumers during the pandemic has proven extremely lucrative for the retail chains
Faul also remained watchful on Domino’s Pizza (ASX: DMP) despite a lift in shares of the fast food giant following strong first-half results. It reported a 33 per cent increase in profit and a 16.5 per cent rise in sales to $1.84 billion, with outlets in Europe and Japan among the best performers.
“Shares in Domino’s are baking in more much sales growth than we expect, potentially underestimating the cyclicality of same-store sales growth or overstating the global runway for new stores,” he noted, despite raising his fair value estimate by 7 per cent to $60 a share.
Appliance maker Breville (ASX: BRG) was the other retailer posting a hefty 29 per cent rise in half-year net profit this week, backed by a similar increase in revenue.
BHP (ASX: BHP) set the tone for the big miners with a massive $6.5 billion first-half payout to shareholders on the back of surging iron ore prices, which have been trading at well above $US100 a tonne since June 2020.
The mining giant declared a 15.4 per cent jump in underlying net profit to $US6 billion, helping it declare a record half-year dividend of $US1.01 per share, up from 65 US cents a year ago.
It was a similar story for rival Rio Tinto (ASX: RIO), which declared a $US4.02 a share dividend on the back of a $US 9.77 billion annual profit. Most of the earnings were delivered by Rio’s iron ore division.
Fortescue Metals Group (ASX: FMG) also nearly doubled the size of its half-year dividend, declaring a $1.47 a share payout following net profit of $US4.1 billion for the six months to December. Revenue for the period jumped 44 per cent to $US9.34 billion.
Morningstar director Mathew Hodge believes the iron ore miners are overvalued, given that the supply challenges in the iron ore market and strong demand from China will both eventually fade away.
“We still see meaningful downside for commodity prices from current levels, particularly for iron ore, but acknowledge that tighter markets will take time to normalise as the effects of China’s fiscal and monetary stimulus wane,” he said.
Diversified miner South32 (ASX: S32) has also declared an improved 1.4 US cents a share dividend, despite half-year profits sliding 46 per cent.
Banks’ boost reflects improving economy
Trading updates from three of the big banks this week underlined the improving economic conditions and the positive impact on the sector.
National Australia Bank (ASX: NAB) reported a 1 per cent improvement in its December quarter cash profit to $1.65 billion. Revenue declined 3 per cent, but the bank actually saw higher fees and commissions from an increased level of business activity. Credit impairment charges for the quarter also plunged to just $15 million, the lowest since 2008.
The encouraging numbers prompted Morningstar equity analyst Nathan Zaia to lift his fair value estimate on the stock by 4 per cent to $26 a share.
“With the bank’s large loan loss provisions taken when the economic outlook was weaker, and the bank commenting that customers exiting deferrals are performing better than expected so far, we believe the loan loss outlook has improved,” he said.
Zaia also lifted fair value estimate for rival Westpac (ASX: WBC) by 8 per cent to $27 per share on lower medium-term loan impairment expectations. Westpac’s core earnings for the December quarter climbed 28 per cent to $2.4 billion while cash earnings also more than doubled to $1.97 billion.
“We thought market concerns were overstated, with the wide-moat bank’s cost advantages and customer switching costs to drive a return to much higher profits and returns on equity,” he noted.
ANZ (ASX: ANZ) also announced a jump in quarterly cash profit to $1.81 billion, with the result buoyed by lower loan loss provisions due to increased confidence in the bank’s institutional customer base. Zaia lifted his fair value estimate by 8 per cent to $27 per share and also expects the bank to return excess capital to shareholders over time.

Trading updates from three of the big banks this week underlined the improving economic conditions and the positive impact on the sector.
Ansell’s figures risk being rubbery
Meanwhile, protective clothing maker Ansell (ASX: ANN) delivered a 25 per cent jump in half-year sales and a 62 per cent surge in net profit to $US 106.5 million led by demand for its health division products during the pandemic. That helped it lift its dividend payout to 33.2 US cents a share.
Morningstar senior equity analyst Mark Taylor maintained his $33 a share fair value estimate and said the market was overvaluing the stock.
“Ansell’s profitability improved in the first half, but we don’t think this is sustainable. We continue to expect pricing and volumes to normalise as supply eventually catches up with demand,” Taylor said.
Hearing implant maker Cochlear (ASX: COH) also reinstated its dividend to $1.15 per share on Friday despite a 6 per cent fall in underlying half-year profit and total revenue easing to
$743 million but said it expected full year profitability to improve. Cochlear also announced it would repay $24.6 million received in coronavirus-related government support.
TWE’s wine turns to water
Not all results this week were positive, with Treasury Wine Estates (ASX: TWE) reporting a 43 per cent slide in half-year net profit after the punishing weight of Chinese tariffs imposed in November.
That has prompted chief executive Tim Ford to pursue a split of the winemaker into three new divisions to give better focus to his luxury portfolio.
Morningstar regional director Adam Fleck maintained his fair value estimate of $11 per share and said he expects the company will prove successful in transitioning previously China-bound exports to other geographies.
Beleaguered casino operator Crown Resorts (ASX: CWN) also booked a huge first-half loss as Crown Melbourne—its largest revenue generator—remained closed for most of the period due to COVID lockdowns. Revenue plunged 62 per cent to $581 million but was held up by better than expected trading conditions at its Perth property.
Rival Star Entertainment (ASX: SGR) also posted a 33 per cent fall in net profit to $51 million given the impact of COVID restrictions and the lack of international tourists. Star’s VIP revenue was hardest hit, sliding 95 per cent during the half year.
Next week will be the last of this earnings season. Major companies we will be watching include:
- NIB Ltd (ASX: NHF)
- Costa Group (ASX: CGC)
- Lend Lease Group (ASX: LLC)
- Oil Search (ASX: OSH)
- AdBri Ltd (ASX: ABC)
- Woolworths (ASX: WOW)
- Sydney Airport (ASX: SYD)
- Qantas (ASX: QAN)
- Seek Ltd (ASX: SEK)
- Evolution Mining (ASX: EVN)
- Zip Co Ltd (ASX: Z1P)
- Harvey Norman (ASX: HVN)
More on this topic: Morningstar Earnings Season Calendar
The cryptocurrency has soared, so it’s no wonder investors want a piece of the action. Should you invest? Maybe—but keep it to a minimum.
Bitcoin investors have been on a wild ride lately. After dropping about 74 per cent in 2018, the digital currency nearly doubled in price in 2019, and then nearly quadrupled during 2020. Trading volumes have also skyrocketed as individual investors have embraced cryptocurrencies through commission-free trading platforms such as Robinhood.
Originally conceived as a digital, encrypted alternative to traditional currencies controlled by central banks, bitcoin has also been attracting more interest from mainstream investors. For example, BlackRock recently added prospectus language giving three of its mutual funds the flexibility to invest in bitcoin futures. In late 2020, insurance provider MassMutual purchased $100 million in bitcoin in late 2020 for its investment portfolio.
And in recent months, several high-profile institutional investors—including Miller Value Partners’ Bill Miller, BlackRock’s Rick Rieder, and Tudor Investment’s Paul Tudor Jones– have touted bitcoin as long-term investment with significant upside potential, even after its previous surge.
There are some arguments in favor of bitcoin as an investment, but there are also reasons to be skeptical. Overall, it has enough negatives that I would hesitate to carve out more than a small fraction of a portfolio for bitcoin.
The case for bitcoin
Bitcoin has been hailed as a transformative technology that promises to revolutionise the entire landscape of money and payments. In fact, the enthusiasm surrounding bitcoin is so intense that it borders on religious fervor. Bitcoin itself has even been compared with a religion, with its own set of doctrines, sacred texts, acolytes, and rituals.
Bitcoin proponents often argue that because only 21 million bitcoins can ever be mined, a permanently limited supply should support its value. It’s often viewed as an alternative to gold, which also has a limited supply but has a more definable intrinsic worth because it’s used for jewelry, industrial applications, and as a tangible store of value. Cryptocurrencies like bitcoin could potentially benefit from increased demand for secure international transactions, low-cost banking, and anonymous micro payments or general-purpose payments. The network effect also comes into play with bitcoin, as growth in usage should (theoretically) increase its value at an exponential rate.
Exhibit 1 CMBI Bitcoin Index Over Time
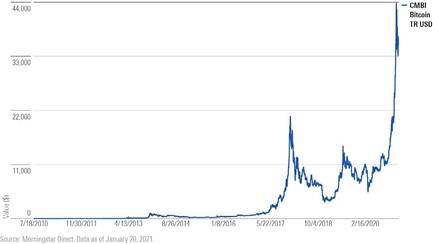
Bitcoin’s limited supply also makes it a potential hedge against long-term inflationary pressures. With the Federal Reserve printing money at an unprecedented rate, the market is currently pricing in a five-year breakeven inflation rate of 2.18 per cent, which would be higher than the unusually benign inflation we’ve seen in recent years. Bitcoin has often (though not always) historically had a negative correlation with the US dollar, which started losing ground in March 2020 after a generally strong upward trend over the previous decade. Bitcoin’s future value partly depends on widespread acceptance and usage as an alternative currency. Unlike traditional currencies, it’s not controlled by central governments. In that sense, it’s the ultimate insurance policy against weakness in the US dollar or a collapse in mainstream financial systems.
The case against bitcoin
But there are reasons to be skeptical. As a virtual asset that doesn’t generate cash flows, bitcoin has no intrinsic value. Its value depends largely on what people are willing to pay. When Guggenheim’s Scott Minerd was quoted in December 2020 claiming bitcoin could be worth as much as $400,000, bitcoin prices quickly escalated. But without a strong foundation to support an underlying value, asset prices can rapidly drop.
That’s exactly what happened in 2018, when the CMBI Bitcoin TR index dropped 74 per cent. More recently, bitcoin’s price shed nearly 30 per cent from its peak on Jan 8 until briefly dropping below $30,000 on Jan 27, 2021. Even intra-day pricing tends toward the extreme, with prices often swinging by double-digit percentages within the same trading day. These sharp price moves mean bitcoin owners must be prepared to “HODL”—hold on for dear life.
Bitcoin is often described as digital gold, but it hasn’t held up particularly well during periods of market crisis. In the fourth quarter of 2018, for example, bitcoin lost about 44 per cent of its value, compared with about 14 per cent for the broader market. When the novel coronavirus roiled the market from Feb 19 through March 23, 2020, bitcoin lost about 38 per cent, compared with 34.5 per cent for Morningstar’s US Market index. During weeks when the overall equity market posted negative total returns (over the period from August 2010 through the end of 2020), bitcoin notched positive results only about half of the time.
As mentioned above, bitcoin proponents often argue that limited supply should create a floor for bitcoin’s value. But while the supply of bitcoin itself is limited, there’s nothing preventing competing cryptocurrencies from emerging. There are already numerous bitcoin alternatives available, including Ethereum, Litecoin, Cardano, Bitcoin Cash, and Lumens, to name a few.
Fees and transaction costs are another negative. Coinbase, one of the most popular platforms for buying bitcoin, charges a spread of 0.5 per cent plus a fixed or variable fee (whichever is greater) based on the investor’s location and method of payment. Fees for small-dollar purchases can be considerably higher. However, Coinbase doesn’t charge additional fees for the hosting and storage required to keep bitcoin assets protected from digital theft or other losses.
Accredited investors can also buy bitcoin through Grayscale Bitcoin Trust, an exchange- traded fund structured as a grantor trust. The fund, which has been operating since 2014, charges a 2 per cent annual fee, which also covers storage costs. It has limitations on redemptions, making it impractical for investors who may need to make withdrawals. The fund also typically sells at a premium to bitcoin prices and doesn’t track the currency perfectly. Over the past five years, for example, the trust has posted an annualised market return of 115.3 per cent, compared with 135.3 per cent for the underlying index.
A competing firm recently started operating Osprey Bitcoin Trust, which will be available as a private placement for accredited investors with a lower management fee of about 0.5 per cent. However, it will initially have 12-month lockup period, compared with six months for the Grayscale offering.
Role in portfolio
Bitcoin can play a role in diversifying a portfolio, but the impact of adding various weightings varies depending on the time period. To quantify this, I looked at the impact of adding different percentages of bitcoin to an all-equity portfolio.
Over the trailing three-year period ended in 2020, bitcoin’s meteoric rise could lead to a simple conclusion: The more, the better. Bitcoin showed more than four times as much volatility (as measured by standard deviation) as equity market indexes over the period. But because of its low correlation with the equity market, adding bitcoin didn’t increase volatility all that much. Even a 10 per cent bitcoin weighting would have increased the portfolio’s standard deviation by a fairly moderate amount, as shown in the table below.
From a portfolio perspective, higher returns more than offset the added volatility; Sharpe ratios increased in tandem with higher weightings in bitcoin.
Exhibit 2: Testing Bitcoin Weightings: Past 3 Years
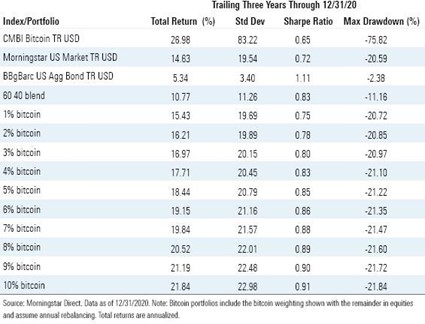
The picture looks less favorable over the trailing 10-year period, though. Bitcoin’s standard deviation was more than 15 times that of the equity market, making it among the most- volatile assets in Morningstar’s database of 35,000-plus market indexes. As a result, both risk and returns increased with larger bitcoin weightings. Even a 1 per cent weighting would have led to a sharp increase in standard deviation compared with an all-equity portfolio, as well as significantly worse drawdowns. Monthly rebalancing would have led to better risk-adjusted returns, but that approach might be impractical for many investors in light of bitcoin’s transaction costs.
Exhibit 3: Testing Bitcoin Weightings: Past 10 Years
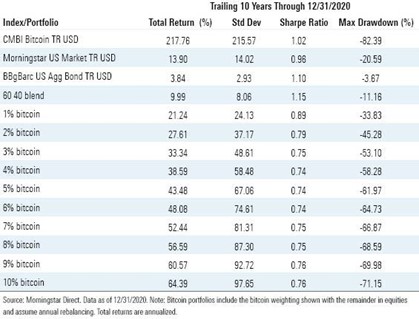
Given the divergence in results over different time periods, deciding on an appropriate bitcoin weighting partly depends on whether you think the future will look more like the recent past, or more like the trailing 10-year period. Much of bitcoin’s eye-popping 10-year record owes to an off-the-charts runup from 2011 through 2013, when the CMBI Bitcoin TR index posted annualised returns of more than 1,000 per cent per year, including a gain of more than 5,300 per cent in 2013 alone. These gains may not be repeatable, partly because trading volumes in bitcoin have increased nearly 3,000-fold since 2014. On the positive side, volatility has significantly decreased, although bitcoin’s standard deviation remains more than four times higher than that of the broader equity market.
It’s also worth noting that as bitcoin moves to the mainstream, it’s becoming less valuable as a portfolio diversifier. As shown in the chart below, bitcoin has had fairly low correlations with most major asset classes over the past three years. Correlations have been trending up, though. In 2020, for example, bitcoin had a correlation coefficient of 0.68 versus the S&P 500, compared with 0.32 for the trailing three-year period. However, its negative correlation with the US dollar has grown even more pronounced, making it a potentially valuable hedge against continued softness in the greenback.
Exhibit 4: Trailing 3-Year Correlations With Other Major Asset Classes
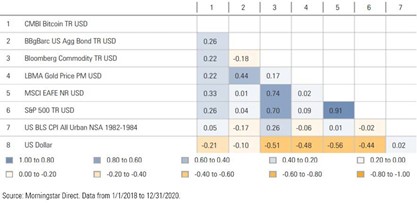
Exhibit 5: Correlations: Trending Higher Except Against US Dollar
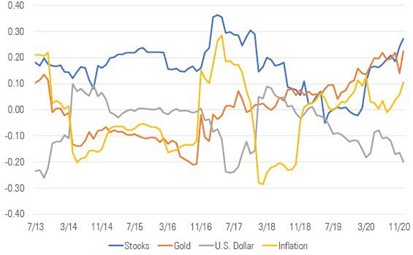
Source: Morningstar Direct. Data as of 12/31/20. Note: Graph shows trailing 36-month correlations for bitcoin versus the other asset classes shown.
Overall, I’m skeptical about the case for bitcoin as an investment asset. Its popularity with momentum investors and speculative buyers makes it prone to pricing bubbles that will eventually burst. It’s also nearly impossible to pin down what its underlying value should be. As mainstream investors increasingly embrace bitcoin, its value as a diversification tool is diminishing; as a result, there’s no guarantee that adding bitcoin will improve a portfolio’s risk-adjusted returns, especially to the same extent it did in the past. However, there are some compelling arguments in favor of bitcoin as an alternative currency and as a commodity that can help support new technologies, such as smart contracts and more- efficient financial transactions with built-in encryption. For that reason, bitcoin is probably best used in (very) small doses as a hedge against weakness in the dollar and major disruptions in the global financial system.
After a year of massive changes sometimes its ok not to make changes.
Google released its Year in Search report last month. The most popular Google search item in Australia in 2020 was unsurprisingly “US election”, followed by “Coronavirus”, “NBA” and naturally, “Zoom”. Sadly, “Fires near me” made the top 10, making it two years in a row that search team has featured.
In this spirit, we’re also sharing “most popular” content. We’re looking at the most frequently viewed securities – equities, funds, and ETFs – on Adviser Research Centre over 2020.
Based on previous years there were no real surprises, the pandemic didn’t alter the way Advisers thought about Investments, continually looking at quality and value for their clients.
On the Equities front, not much changed from 2019, with the Banks, BHP and Telstra all featuring. The list continues to feature high-quality, large-cap companies, many of which have carved out economic moats.
Interesting to note that two stocks in the top 10 in 2019, Coles and Woolworths didn’t make the cut in 2020 even though there was panic buying and toilet paper shortages around the country.
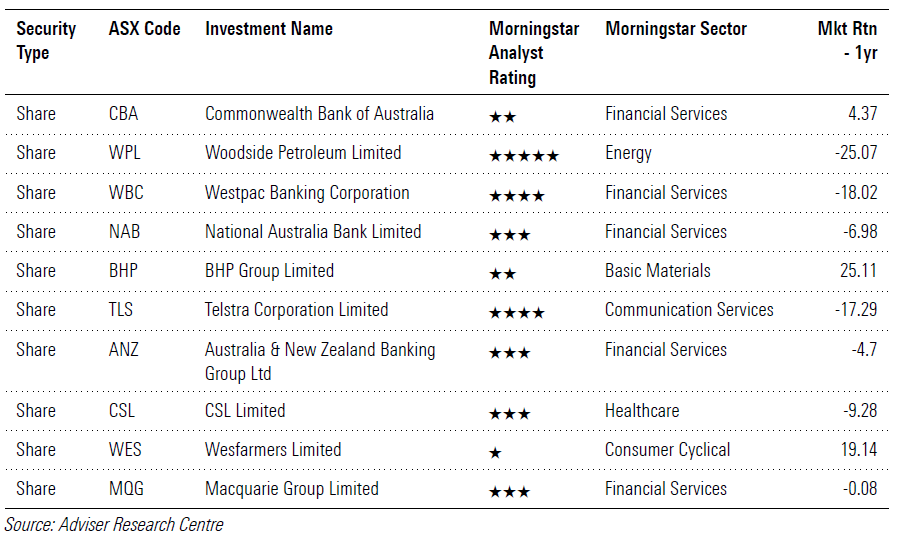
Little change in the Funds accessed by Advisers with the top 10 exactly the same as last year bar one. 2020 again dominated by the global fund managers Magellan Global, sitting on top for the 3rd year running and Platinum International sitting second. The only noticeable fund to drop out of this years top 10 was the Janus Henderson Tactical Income Fund, with Hyperion Australian Growth Companies coming in.
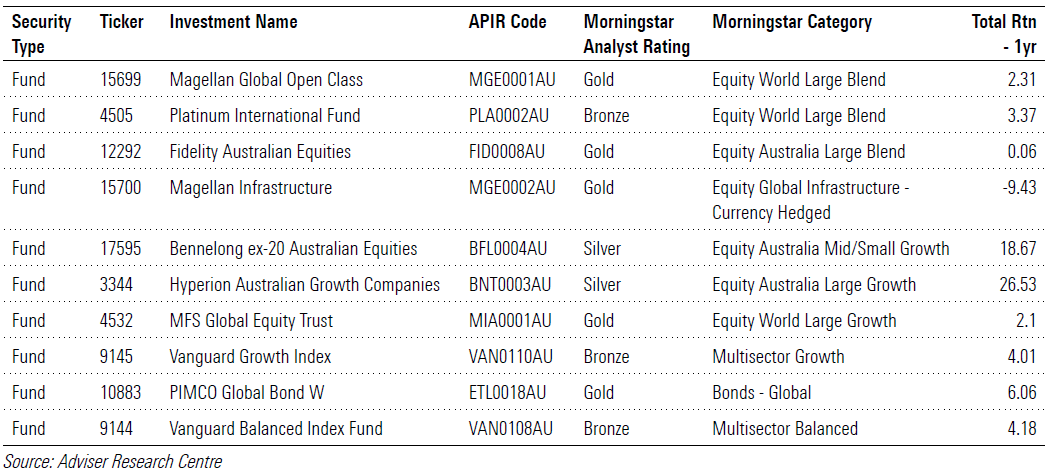
Exchange Traded Funds were again dominated by Vanguard, with Vanguard’s Australian Shares ETF (ASX: VAS) topping the list for a second year running. Magellan’s actively managed Global Equities ETF (ASX: MGE) was the favoured globally exposed ETF.
iShares and VanEck also made the top 10 as Advisers continued to seek broad international exposure from passive-ETFs.
One noticeable absentee that has been in the top 10 in the past is the SPDR S&P/ASX 200 ETF (ASX: STW) which passively tracks the S&P/ASX 200 Index.
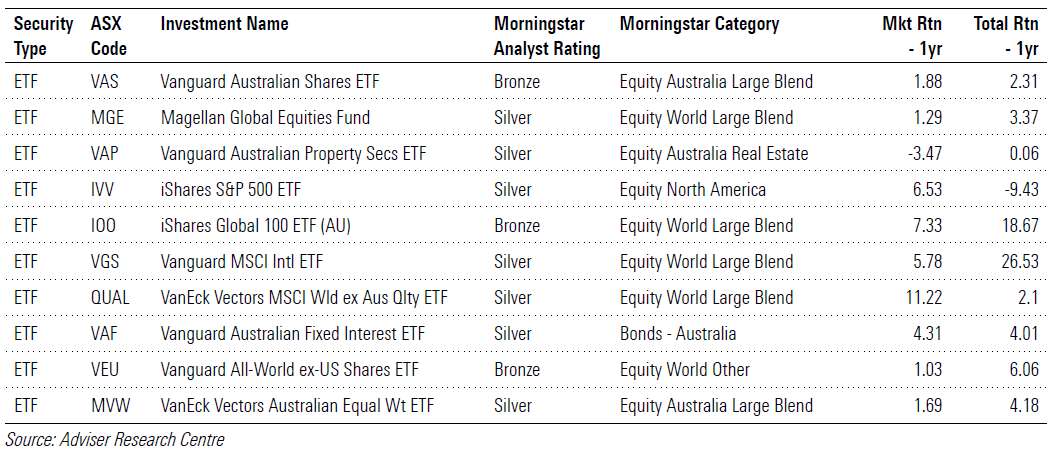
Morningstar provided over 300 articles to Advisers during 2020, helping you to keep informed on the current market activity, supporting you with client communication for Investors concerned about the market volatility, and our best thinking’s from some of Morningstar’s great minds and thought leaders.
Plus keeping you up to date on all the great improvements made to Adviser Research Centre over the course of the year. If you missed any of the product updates please find the two main recap documents here:
1st Half 2020 Product Release Note
2nd Half 2020 Product Release Note
While our Best Stock Ideas document that comes out at the start of each month is our most widely read document, here are the top 5 thought leadership articles that were most read in case you missed them.
Coronavirus market selloff ‘a gross overreaction’
29 quality stocks at great prices
Opportune Entry Point for Quality Healthcare Names
What Experts Say Coronavirus Means for Investors
Coronavirus effect: 11 Aussie stocks to watch
Videos are a great way to get a quick update from the team whether it be product feature updates, Webinar and training recordings or interviews with Morningstar or external thought leaders.
Here are your top 5 Videos watched in 2020:


Any Morningstar ratings/recommendations contained in this report are based on the full research report available from Morningstar or your adviser. © 2021 Morningstar, Inc. All rights reserved. Neither Morningstar, its affiliates, nor the content providers guarantee the data or content contained herein to be accurate, complete or timely nor will they have any liability for its use or distribution. Any general advice or ‘class service’ have been prepared by Morningstar Australasia Pty Ltd (ABN: 95 090 665 544, AFSL: 240892) and/or Morningstar Research Ltd, subsidiaries of Morningstar, Inc, without reference to your objectives, financial situation or needs. Refer to our Financial Services Guide (FSG) for more information at www.morningstar.com.au/s/fsg.pdf. You should consider the advice in light of these matters and if applicable, the relevant Product Disclosure Statement before making any decision to invest. Our publications, ratings and products should be viewed as an additional investment resource, not as your sole source of information. Past performance does not necessarily indicate a financial product’s future performance. To obtain advice tailored to your situation, contact a professional financial adviser. Some material is copyright and published under licence from ASX Operations Pty Ltd ACN 004 523 782.