
The US economy is proving unexpectedly resistant to interest rate hikes. On a run of stronger economic data, the market now prices less than two US interest rate cuts in 2024. Our Chief US Economist, whose work we will leverage this week, expects the Federal Reserve to make more meaningful cuts over 2024 and 2025. This view is based on a multitude of factors weighing on economic growth, including delayed effects of tight monetary policy, the depletion of excess savings which were built up during the COVID crisis, and a slowdown in government stimulus as state and local surpluses are spent. But if consensus prevails and rates stay higher for longer, a recession in the US is possible.
Conventional wisdom says a weakening US economy portends a shock in Australia. But experience in recent decades suggests we may not need to accept this as given. Australia’s fiscal capacity, the Reserve Bank’s flexibility to cut rates before the Fed, and the possibility of stimulus from China may provide our economy with some insulation from global turbulence. The US matters greatly for global financial flows, but for direct trade, not so much, particularly in Australia where China is far more important.
Understanding the US interest-rate paradox
Not so long ago, many in the market were calling a US recession in 2023. From March 2022 to July 2023, the US Federal Reserve increased the federal funds rate by 5.25 percentage points, the largest and fastest rate hike cycle in 40 years. Given the Fed’s track record of ‘hard landings’, particularly during the inflation wars of the 1970s and 1980s, it seemed reasonable to assume rates would again be pushed too far, culminating in a sharp economic contraction.
But we wound up with the opposite problem. Unexpectedly, US real gross domestic product growth accelerated to 2.5% in 2023 from 1.9% in 2022. And at the start of 2024, a stronger-than-expected run of economic data has unsettled markets. The concern is if inflation proves stickier than expected, near-term interest rate cuts will be delayed and shallower. (Exhibit 1) And if markets have optimistically priced in larger cuts sooner, there’s a risk asset prices will fall, particularly for interest rate sensitive industries.
Exhibit 1: Market’s US rate forecast revised up on stronger economic data (%)
Source: Westpac, Morningstar
Our Chief US Economist identifies four factors driving the paradoxical immunity to higher rates:
- Households accumulated excess savings during the pandemic and businesses boosted cash holdings, which are now being spent.
- Many borrowers are locked into low rates, including fixed rate mortgages and corporate bonds. The interest burden remains low for the private nonfinancial sector. (Exhibit 2)
- Risky asset prices held firm, causing risk premia to compress. Resilient asset prices have supported consumption through the wealth effect.
- The reduction of risky shadow banking activities has rendered the financial system less vulnerable to shocks.
Exhibit 2: Household interest burden not overwhelming by historical standards (%)
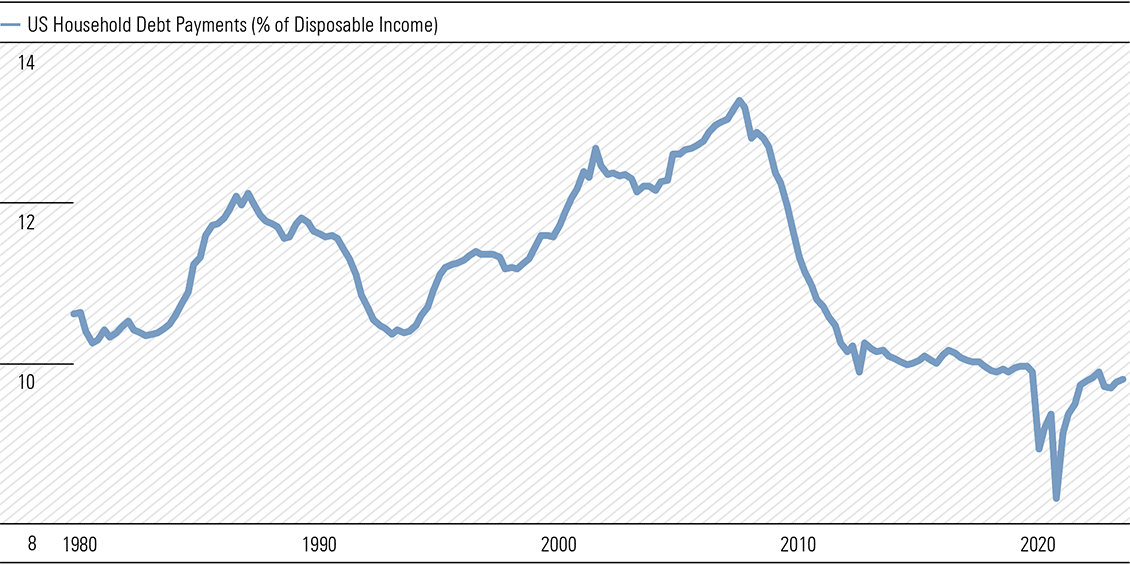
Source: Board of Governors of the Federal Reserve System, Morningstar.
It’s also hard to overlook the immense fiscal stimulus, with the US government running a deficit close to 6% of GDP, around twice the pre-pandemic average.
What does the paradox mean for US interest rates?
Our central case for the US economy could be characterised as a ‘soft landing’. We think growth will weaken and inflation will return to target in the near- to medium-term, providing scope for greater rate cuts than the market expects.
But if Fed cuts are very modest over the next two years, as some forecasters expect, we think the risk of a US recession increases. We think private sector finances will struggle to withstand a material and permanent increase in rates above pre-pandemic levels. Balance sheets are too large and asset prices too high to be compatible with a new normal of higher rates. If the Fed holds rates high for too long, a recession could be on the cards.
While it’s not our central case, it is worth considering what might happen in Australia if the ‘higher for longer’ scenario prevails, and a US recession ensues.
How might a US recession affect Australia?
From the start of the post-war period to the end of the 20th Century, Australia’s economic performance closely correlated with the US business cycle. In particular, three deep recessions—in the mid-1970s, the early 1980s and early 1990s—were felt across both. When the US sneezed, we caught a cold.
But since the early 2000s, this relationship has become more tenuous. Australia ducked recession after the dotcom bubble, and again in the global financial crisis. When we look at the historical correlation between Australian and US growth, we observe a steady increase from 1970. At the peak in 2000, growth between the two economies was almost perfectly correlated. But this subsequently weakened significantly, aside from the more recent synchronised shock of the pandemic. (Exhibit 3)
Exhibit 3: Correlation between Australian and US growth weakened from early 2000s
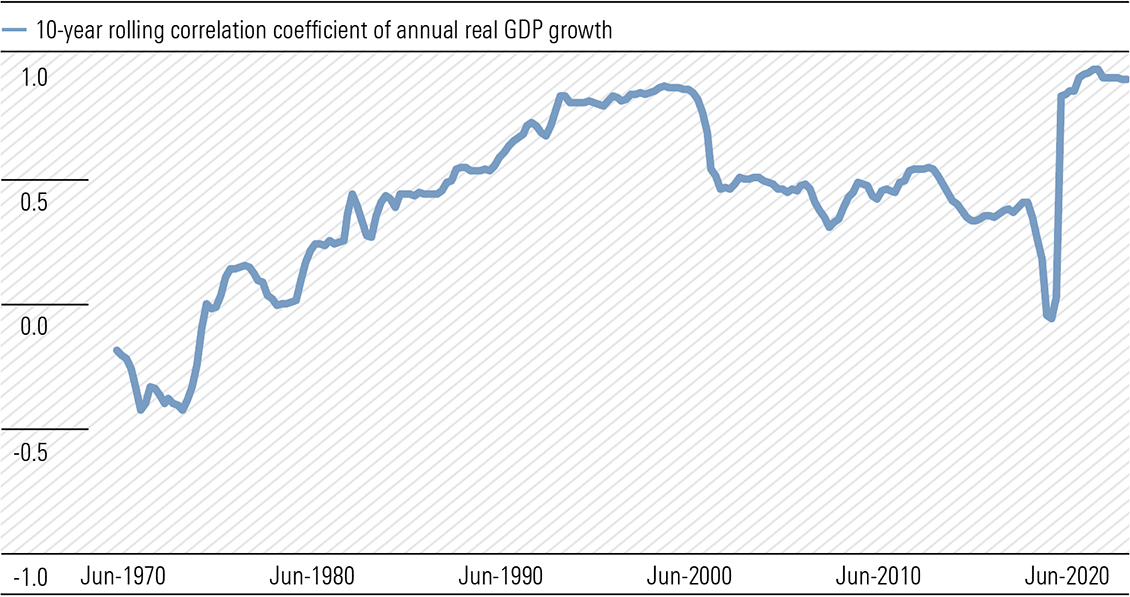
Source: Australian Bureau of Statistics, Bureau of Economic Analysis, Morningstar.
But what caused the decoupling of US and Australian growth in the 2000s? And could these forces again shield our economy from turbulence in the US?
China
The rise of China underpinned Australia’s economic prosperity in the decades leading up the pandemic. In particular, China’s immense stimulus program after the financial crisis, which saw around AUD 900 billion, or 11% of China’s annual GDP, spent on social welfare and infrastructure in 2009 and 2010, supercharged demand for Australia’s resources. Tourism and education were also significant sources of income.
China is still ambitious, targeting 5% GDP growth in 2024. But it is unclear if authorities have the appetite, or capacity, for another big round of stimulus. Further, future public spending is unlikely to be focused on resource-intensive infrastructure and housing. This means Australia might miss out on much of the indirect support created by Chinese stimulus.
Australia’s fiscal firepower
Australia’s robust fiscal position affords meaningful downside protection. While the US deficit is much higher than its long-run average, the Australian government has tightened its purse strings to repair the budget. From an AUD 134 billion cash deficit in fiscal 2020–21, more than 6% of GDP, the Commonwealth realised a surplus of AUD 22 billion in 2022–23, largely a function of higher commodity prices and income tax receipts. The treasurer has flagged we won’t see ‘big cash splashes’ in the upcoming May budget, as the government keeps its fiscal powder dry for the election year or a deteriorating global economy.
Australia’s Reserve Bank is not bound to US Federal Reserve policy
Research from the Reserve Bank suggests our historical correlation with the US business cycle was largely due to synchronised high interest rates, which triggered major recessions in the latter half of the 20th Century. But in recent years, the Reserve Bank has shown it does not necessarily follow the Federal Reserve. For example, between 2015 and 2018, the Reserve Bank cut rates while the Fed aggressively hiked. (Exhibit 4) So, if we see evidence our economy is cooling, the Reserve Bank may begin easing ahead of the Fed to manage the risk of a recession here.
Exhibit 4: Australian and US policy rates share a trend but the RBA can move independently (%)
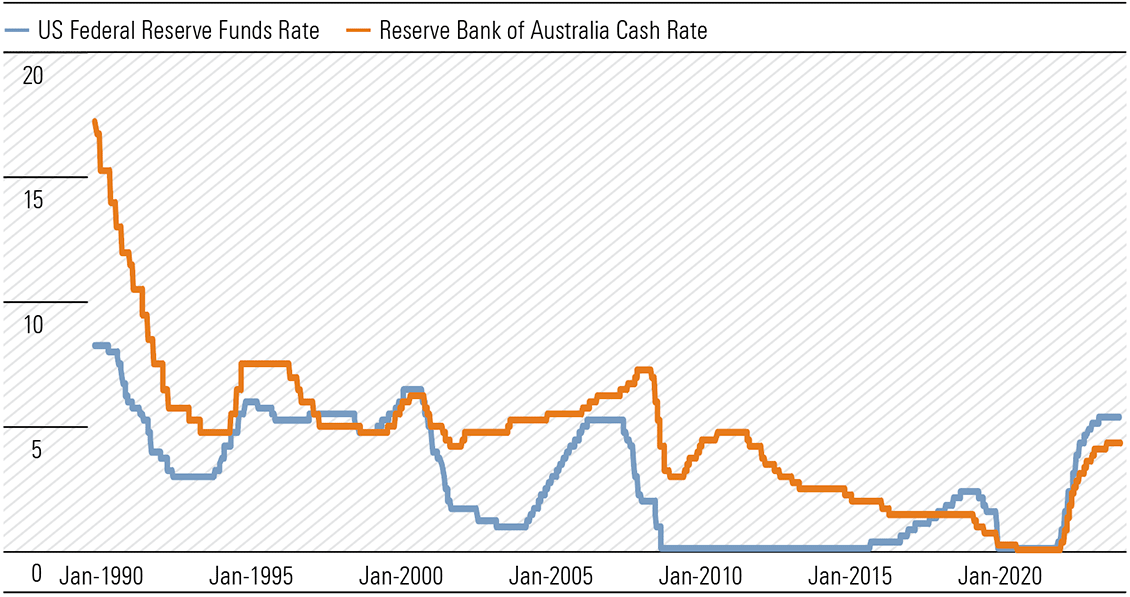
Source: Reserve Bank of Australia, Federal Open Market Committee, Morningstar.
Takeaways for Australian investors
While the outlook for some of the largest ASX-listed companies is closely tied to the US, a few of our Best Ideas stand out as being less exposed. Domestically-focused examples include AUB Group (ASX:AUB), Bapcor (ASX:BAP), PEXA Group (ASX:PXA), TPG Telecom (ASX:TPG) and Ventia (ASX:VNT). As the master franchisee of the Domino’s brand in a number of locations outside the US, including Australia, France and Japan, ASX-listed Domino’s Pizza (ASX:DMP) also looks relatively insulated from potential softness in the US. And while Aurizon (ASX:AZJ) is export-exposed, it is mostly linked to contracted volumes for coking coal. Australia is a relatively low-cost producer, so Aurizon’s revenue should prove more stable than one might think.
While the near-term economic outlook is highly uncertain, these companies, most of which have been awarded moat ratings, look attractive at current prices.
The so-called Australian public infrastructure boom probably brings to mind a raft of high-profile transport infrastructure projects around the country. Think WestConnex, Sydney Metro, West Gate Tunnel, Bruce Highway, Inland Rail to name a few. Several ASX-listed companies are exposed to Australian construction spending. Here we mean industrials and/or basic materials companies with revenue from building or construction work, the supporting services and infrastructure maintenance providers. Infrastructure owners, such as Transurban with toll roads, are not exposed to the same underlying drivers.
Many pundits think we are approaching a cliff for historically high construction spending, with the number of approved transport projects falling. But just how elevated is spending and how exposed are companies we cover to a drop? (Exhibit 1)
Exhibit 1: Trend value of Australian building and engineering construction AUD billion (real 2022)
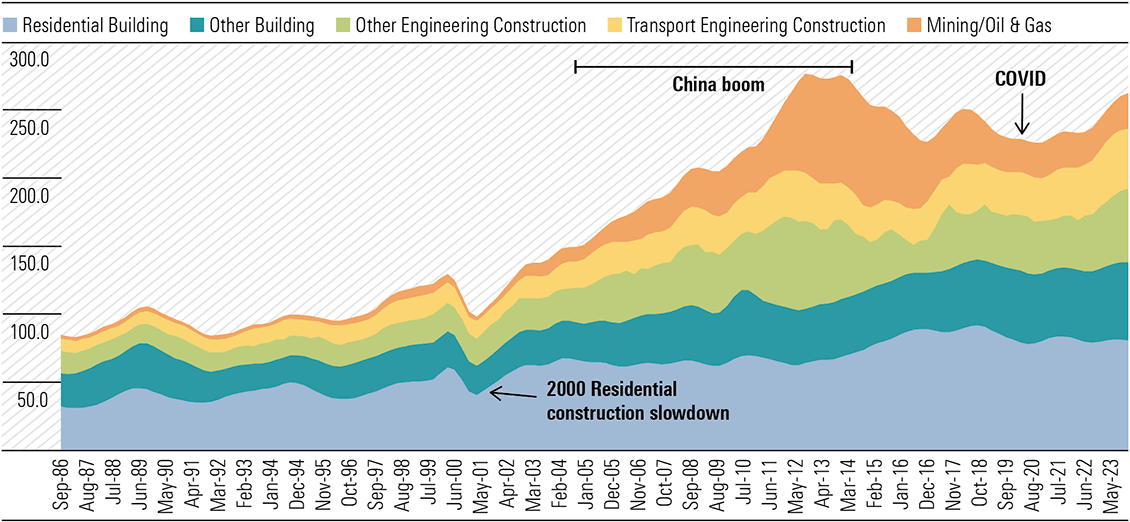
Source: ABS, Morningstar
Starting with some basics, the chief division for construction activity is between building and engineering. Building is essentially anything with a roof, chiefly residential and commercial structures. Engineering is the balance and includes roads, highways, bridges, railways, water, sewerage, electricity, pipelines, telecommunications, and oil and gas and mining infrastructure. Maintenance expenditure is of growing importance and a separate category. While cyclical, building work tends to be steadier than engineering construction.
Where are we in the cycle?
In summary, the data suggests Australian construction spending overall is not exceptional, so we think the concerns of a bust are likely overblown. In real terms, expenditure is close to long run averages, both on a per capita basis and as a function of GDP, and well below 2013/2014 peaks. Particular segments like mining, oil and gas, and transport infrastructure will boom and bust, but other categories tend to grow or contract to accommodate these moves, perhaps reflecting limits to labour and capital overall. The China driven resources boom was an exception, attracting considerable foreign capital and labour.
We can also see upside potential from the current energy transition, which could herald another period of significant expenditure growth. The Net Zero Australia 2023 Report—University of Melbourne, University of Queenland, and Princeton University—estimates over AUD 2.0 trillion investment in Australian clean energy and infrastructure is needed over the next 10 years to achieve net-zero 2050 goals. But whether it can repeat the China boom remains to be seen, and that’s not our base case. However, there’s a decent case it can at least offset any potential spending retreat in transport infrastructure, or mining or traditional energy. Many companies are expanding their energy transition credentials in anticipation of the coming wave of demand. Examples include Worley Limited (ASX:WOR), Monadelphous (ASX:MND), Ventia Services Group (ASX:VNT), and Downer EDI (ASX:DOW).
Australian annual construction spend peaked around AUD 275 billion in 2013/2014 with the China-driven resources boom, according to the ABS. And while spending again grew from 2021, it is still below the 2013/14 inflation adjusted peak despite a 13% increase in population and 22% expansion in GDP.
We think it’s reasonable to contend construction-exposed companies have already survived a larger post China-boom decline in spending than is likely to occur from now. The peak in resources infrastructure spending, the region of darkest blue in Exhibit 1, is considerably larger than the transport infrastructure spending uptick, the middle blue region, now underway.
At around AUD 45 billion, Australian transport engineering construction expenditure is at record levels, excluding the China-boom which inflated private infrastructure spending such as on iron ore railways. Spending as a portion of GDP now is nearly 30% above levels prevailing prior to the China boom. While elevated, we don’t expect a drop off soon. COVID pushed out the timelines of major transport infrastructure projects underway and the spending plateau could extend for five years or so. Important also are high rates of population growth and catch-up from considerable under-investment. But if and when spending as a portion of GDP falls to pre-boom levels, we expect the impact on exposed companies such as Seven Group (ASX:SVW), ADBRI (ASX:ABC) and Boral Limited (ASX:BLD) to be relatively muted.
As the installed base of infrastructure grows, maintenance requirements grow and are increasingly important to company earnings.
Growing population and wealth will create both demand for greater and improved infrastructure capacity.
Companies have diversified exposures to construction spending in general and in our view are relatively adept at adjusting exposures as required. (Exhibit 2 & 3)
Exhibit 2: Australian transport engineering construction expenditure, AUD billion (real 2022)
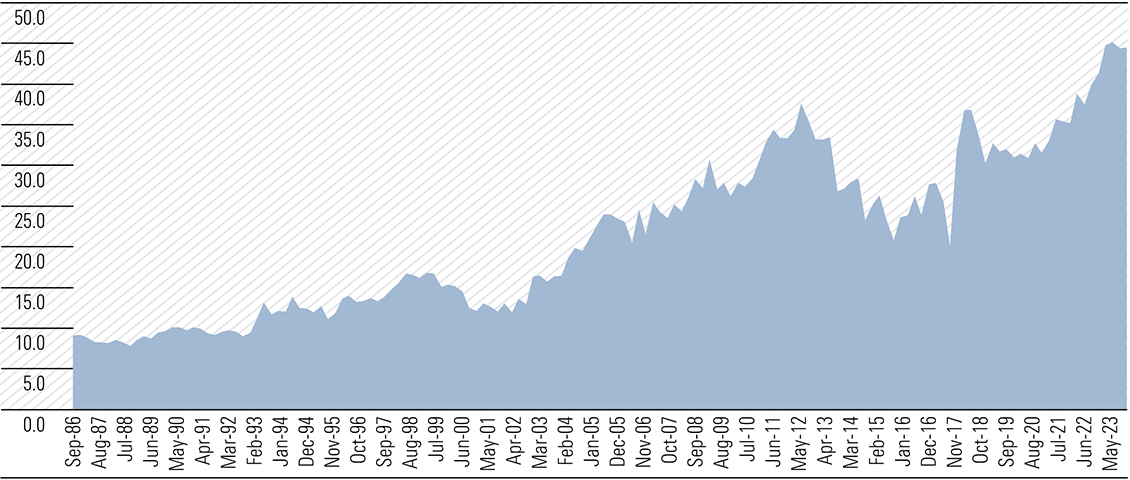
Source: ABS, Morningstar
Exhibit 3: Australian transport engineering construction expenditure as a function of GDP (Index 1986 = 1)
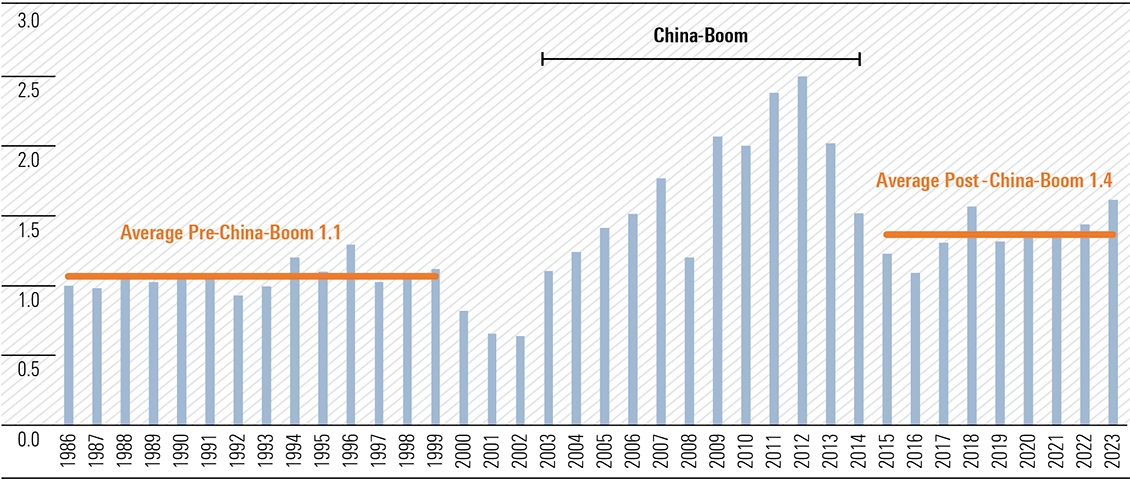
Source: ABS, Morningstar
The energy transition could be massive
The elephant in the room is the energy transition, including that estimate that over AUD 2.0 trillion investment is required over the next 10 years. A simplistically assumed approximate annual spend of AUD 200 billion, or 15% of GDP, would dwarf current total engineering construction spend of around AUD 125 billion. Just AUD 20 billion, or 16%, is for electricity generation, transmission and distribution assets. Despite growing from an average nearer AUD 15 billion since 2008 it remains a drop in the ocean.
Energy transition spending at such a rate looks impossible given funding, labour and engineering capacity, not-in-my-backyard and environmental constraints. But even a fraction of that spend could underpin robust demand for at least a decade and growing revenues for exposed companies like Worley and Ventia, even if other categories like transport decline.
Our Top Picks
Four-star rated Ventia and Downer are our top picks of infrastructure exposed companies, albeit now solely as maintenance services providers. They benefit from the growing installed infrastructure base off the back of engineering and building construction expenditures, but don’t participate meaningfully at the construction stage. Downer recently sold out of the last of its mining businesses and similarly exited engineering construction activity. It derives around 55% of revenues from transport including roading maintenance/paving and manufacturing of rail rolling stock, 18% from services to the technology and communications sectors and 26% from facilities including for defence. Ventia was spun out of CIMIC and derives 42% of revenue from services to defence and social infrastructure, 24% from infrastructure services, 24% from telecommunications and 11% from transport. Ventia sees its maintenance services addressable market size increasing by almost 20% to AUD 88 billion in the next three years. Drivers are the size and growth of the installed asset base, population growth, increasing outsourcing rates, and the energy transition.
In addition to benefitting from growth in the installed infrastructure base, Ventia and Downer gain from the increasing rates of outsourcing of maintenance services activity. Maintenance markets are less exposed to inflationary pressures seen across construction markets and capital intensity is low. Most contracts favourably contain some form of embedded price escalation. Ventia has the highest forward yield of companies in our list, supported by repeat income and the low capital intensity associated with maintenance services.
Engineering construction and maintenance services provider Monadelphous is next on our list with a 3-star rating. It is the only company on our list which still participates directly in engineering construction activity with 27% revenue exposure. The 63% balance pertains to maintenance services chiefly to the resources industry. Maintenance work increases reliably as the installed base of infrastructure grows. Monadelphous’ exposure is chiefly to mining and oil and gas segments where value of maintenance work has nearly doubled over the last decade. This is separate/additional to engineering construction and building activity. (Exhibit 4)
Exhibit 4: Companies with material exposure to Australian construction
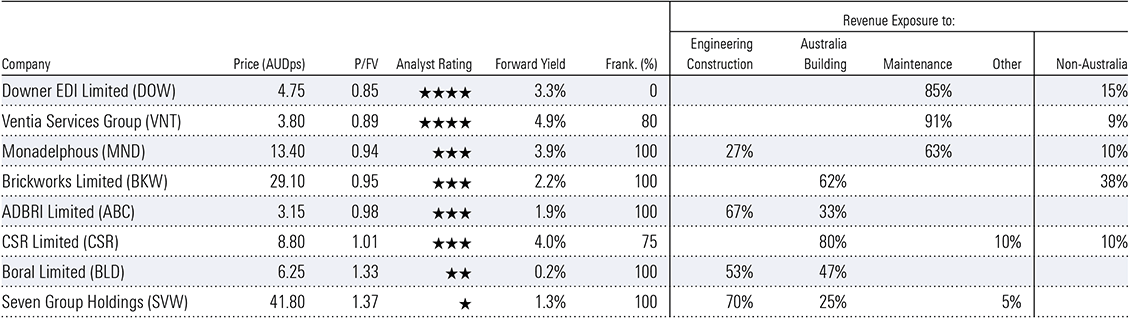
Source: Morningstar
Construction-exposed but expensive at present
There are a number of other construction-exposed companies where a better entry price would be welcome. Industrial conglomerate Seven Group has the highest revenue exposure of all but is a fan-favourite and we think too expensive. Its WesTrac business sells and services Caterpillar heavy equipment to the mining and construction sectors, Coates Hire rents construction equipment, and its 72% owned construction materials specialist Boral supplies aggregates, cement and asphalt. Seven Group has a live takeover offer underway for the balance of Boral it doesn’t already own.
There are also a number of predominantly building exposed companies. Cement, lime, concrete and aggregates comprise around 90% of revenue for ADBRI, currently under takeover offer from CRH PLC (NYSE:CRH) and Barro Group. Not on our list given 90% of revenue derives from offshore, 2-star rated Worley is ideally placed to provide high value services to the energy transition but is expensive.
It’s hard to think of a segment of the market that is more hated by retail investors than Listed Investment Companies (LICs). Hate may be too strong a word as LICs were hated a year or two ago, but now they’re mainly ignored.
Yet, institutions are getting increasingly busy in the sector, including:
- VGI Partners Global Investments’ (ASX:VG1) trading volume has recently shot up as speculation mounts that Regal may consider merging the $561 million LIC with the $826 million PM Capital Global Opportunities Fund (ASX:PGF). That comes after Regal acquiring both PM Capital and VGI Partners.
- Saba Capital, a US$4.4 billion global hedge fund known for pressuring funds to act to close discounts to asset values, has taken an almost 10% stake in Hearts and Minds Investments (ASX:HM1), the charity investment vehicle. Saba owns shares in several other LICs including MFF Capital Investments (ASX:MFF), Platinum Capital (ASX:PMC), and WAM Global (ASX:WGB).
- Wilson Asset Management has entered into a scheme of arrangement to merge with QV Equities (ASX:QVE) to create an almost $2 billion vehicle.
- Early this year, the board of small caps LIC, Spheria Emerging Companies (ASX:SEC), gave the manager a deadline of one year to close its discount to net tangible assets (NTA), or the LIC will be delisted.
- The lack of liquidity led to the fund trading at an NTA discount about 90% of the time.
- Unitholders had continued to give negative feedback on the discount and pushed the company to address it.
- Buy-backs were an unlikely panacea as while they might boost the share price in the near-term, they were unlikely to in the longer term.
- A change to an open-ended unit trust structure would give investors to ability to realise an investment at NTA and also give Partners Group the opportunity to increase the fund’s size.
A $51 billion pool of money
LICs are ‘close-ended’ as there are a fixed number of shares on issue. ETFs are ‘open-ended’, meaning they can issue new shares, or retire them.
LICs struggling with large discounts
Reasons for the discounts
LICs may offer value in a valueless world
Warren Buffett’s annual letters to Berkshire Hathaway (NYS:BRK.A) shareholders are always invaluable. They contain some of the most insightful, timeless and entertaining investment wisdom money can buy, yet you don’t need to pay any to read them. The 2023 edition was particularly profound, published on February 24, 2024, three months after the passing of Buffett’s lifetime investment partner, Charlie Munger. In likely the first annual letter since 1977, penned without his curmudgeon sounding board, Buffett paid Munger the ultimate tribute.
He credited Munger as the “architect” of the present-day Berkshire and thanked him for fundamentally changing Buffett’s investment mentality, from one scouring for so-so companies trading at dirty-cheap prices, to one obsessed with “wonderful businesses purchased at fair prices”.
Buffett, of course, was being modest. He did pretty well by himself before Munger joined him in 1978, with Berkshire generating compound annual average return of 20.4% from 1965 to 1977, easily exceeding the 4.8% returned by the S&P 500 index. Even before Munger started badgering him about buying quality, Buffett appreciated the appeal of investing in “truly outstanding” businesses.
Exhibit 1: Berkshire shares outperformed market, both before and after Munger joined
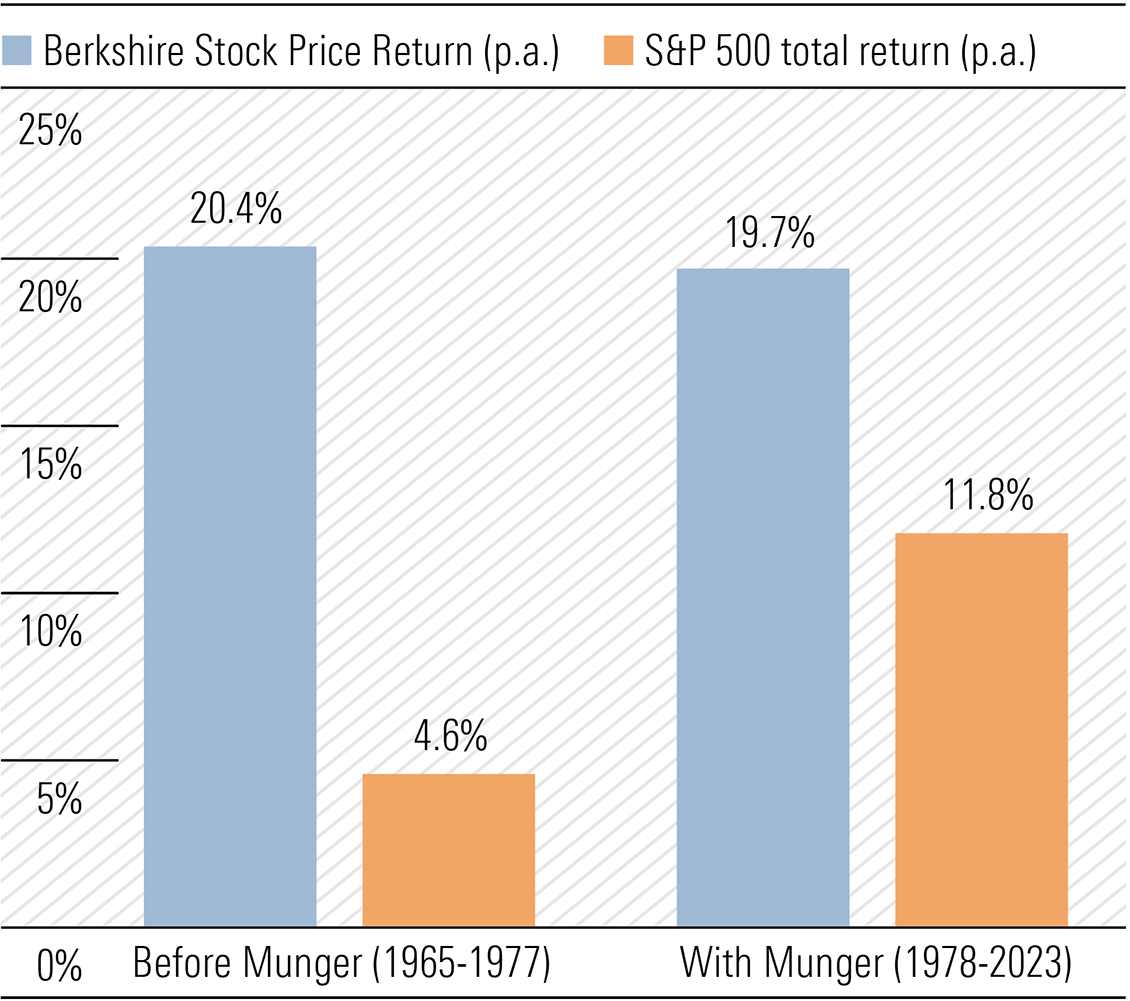
Source: Berkshire Hathaway Annual Letter 2023, Morningstar Direct
However, after Munger came into Berkshire in 1978, the annual letters increasingly emphasised the advantages of investing in businesses with attractive economics and durable competitive edge. They used Berkshire’s own purchases as real-time examples of what those qualities look like. And when those qualities kept shining through, Berkshire couldn’t get enough of them. So, it started swallowing up these companies whole (see Exhibit 2).
Exhibit 2: Decreasing percentage of Berkshire assets held in minority investments
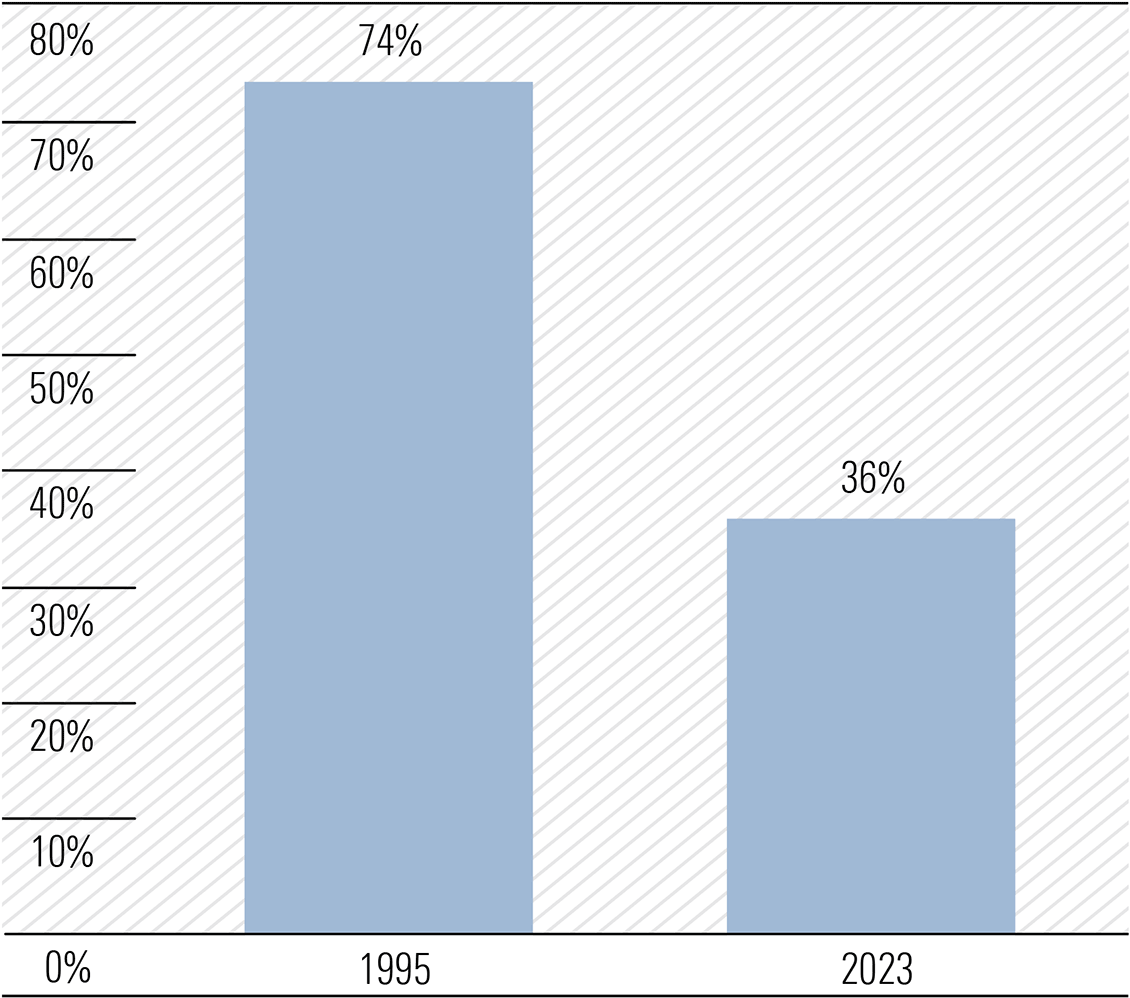
Source: Berkshire Hathaway 2023 Annual Report
The stock price performance of Berkshire since Buffett and Munger formally joined forces from 1978 speaks for itself. As Exhibit 1 shows, after Munger joined, Berkshire shares have returned 19.7% a year on average from 1977 to 2023−an amazing track record of outperformance against the market, especially with the company’s net assets ballooning from USD 142 million to USD 561 billion. Exhibit 3 shows the entirety of Berkshire’s stock price performance since 1965.
Exhibit 3: Value of USD 100 invested in Berkshire in 1965 reached almost USD 4.4 million by end of 2023
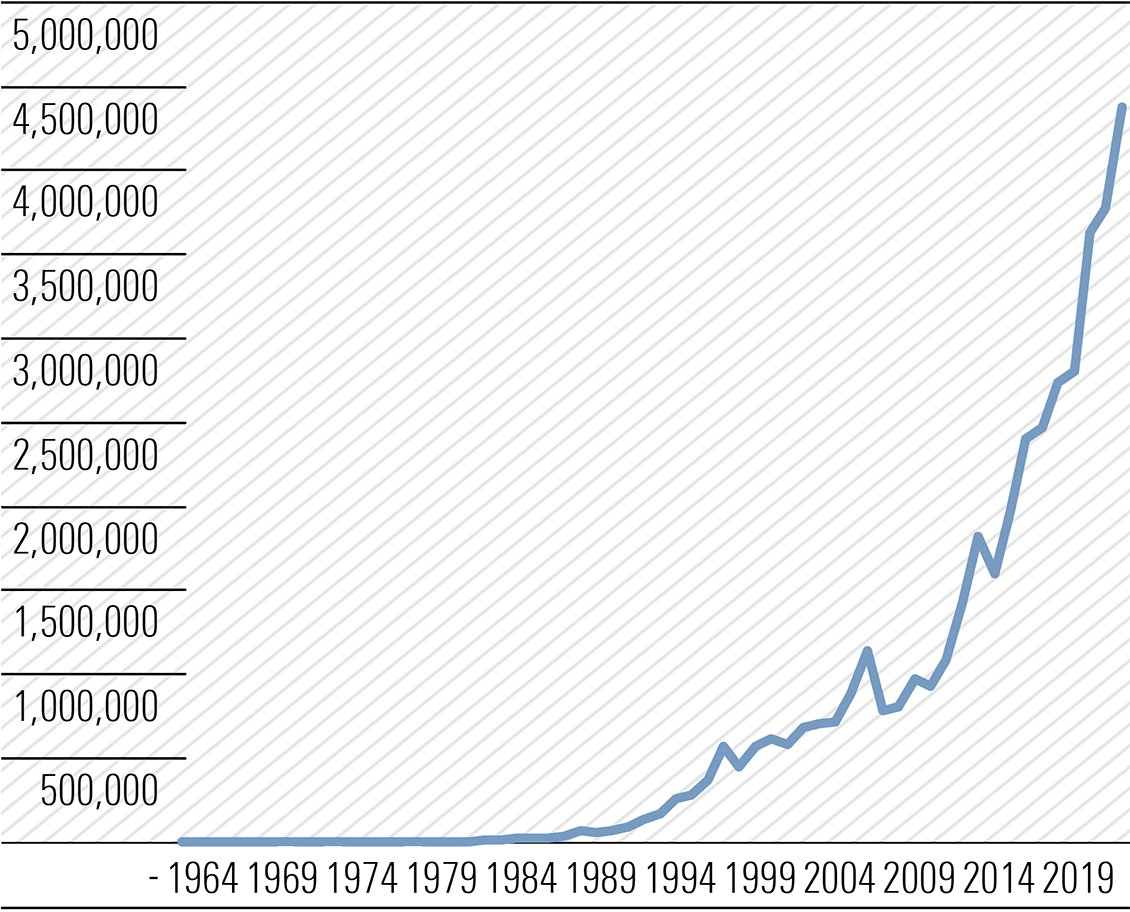
Source: Berkshire Hathaway Annual Letter 2023, Morningstar Direct
We make three observations about Berkshire’s performance track record.
Firstly, it has had its ups and downs. Notably, it was down 49% in 1974, 23% in 1990, 20% in 1999, 32% in 2008 and 13% in 2015. Relative to the S&P 500 index, Berkshire shares also underperformed in a number of years, as can be seen in Exhibit 4.
Exhibit 4: Years where Berkshire underperformed market
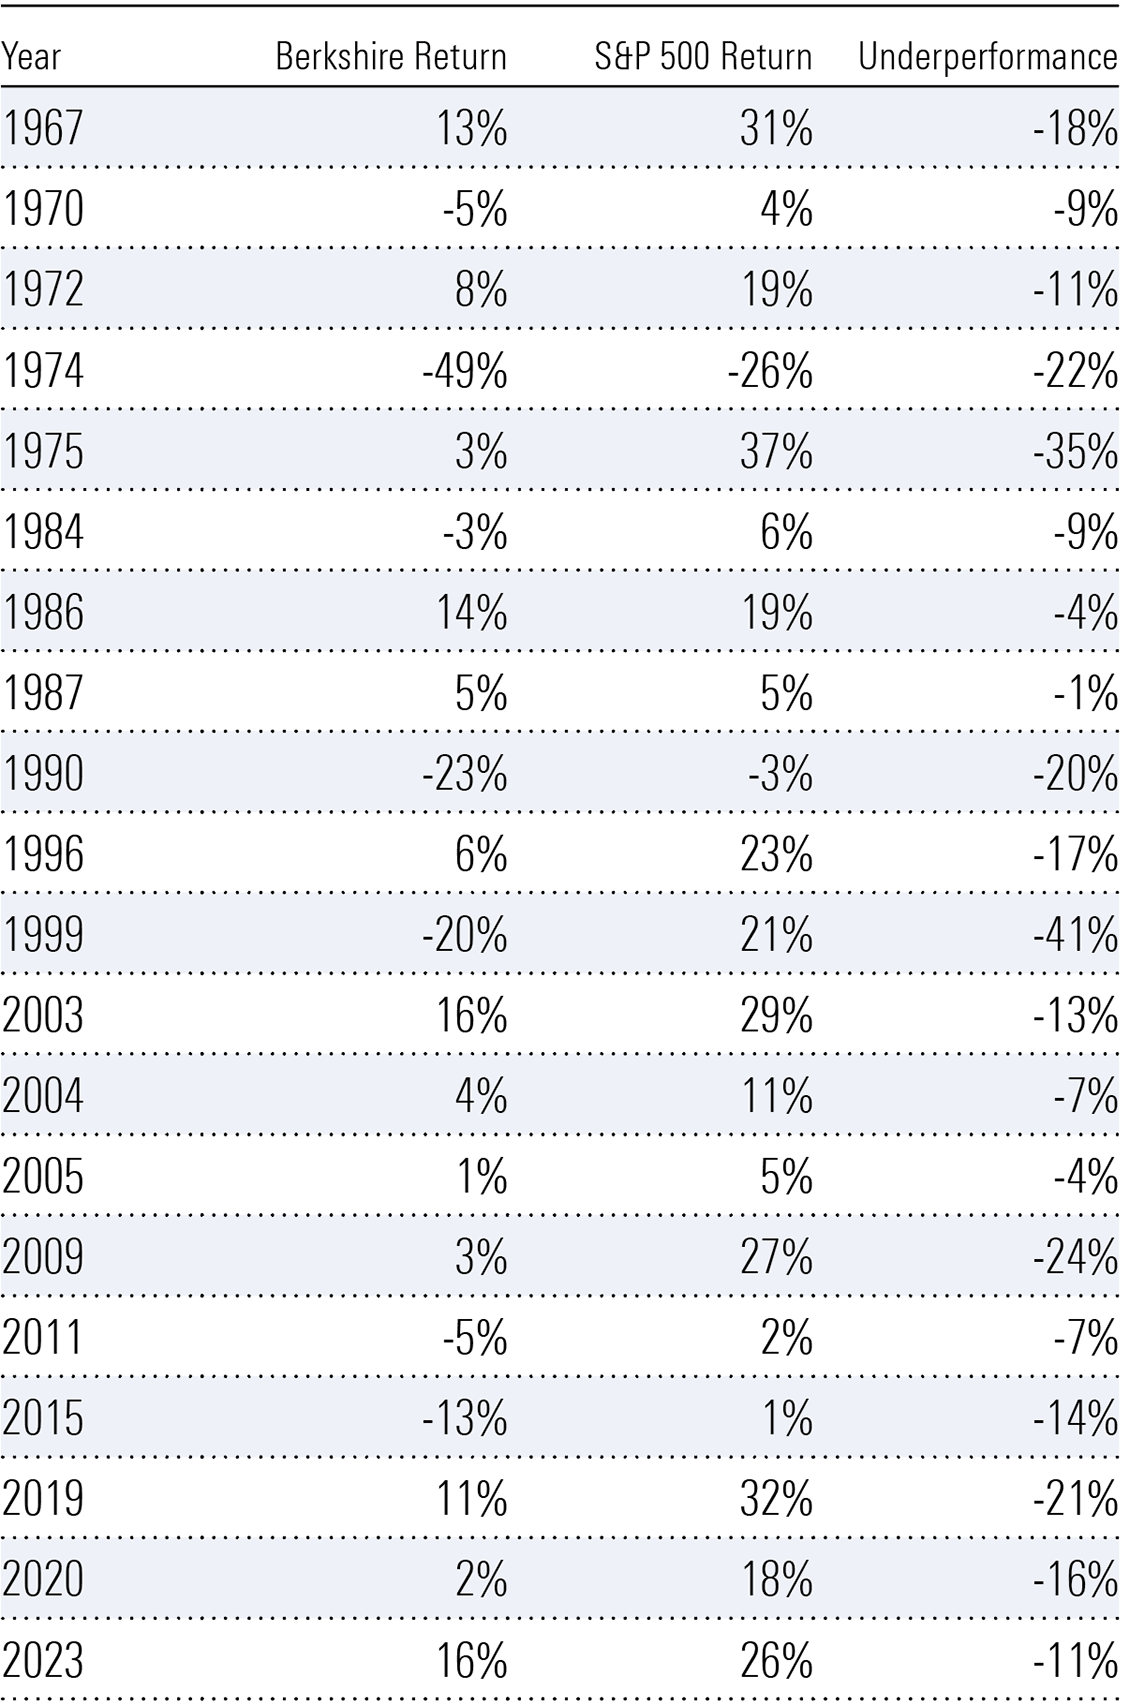
Source: Berkshire Hathaway Annual Letter 2023, Morningstar Direct
During these lean years, there was no shortage of doomsday prophesies about Buffett/Munger’s investing prowess. Impatient investors, influenced by the negative noise and criticism, likely pulled out of Berkshire.
For instance, I still remember the schadenfreude permeating the market when Berkshire shares dropped 20% in 1999 while the S&P 500 was up 21%. Market commentators and “smart money” questioned whether the ageing Berkshire duo had lost its touch amid a technological and dotcom revolution. Since then, Berkshire shares have returned 10% a year on average compared to 7% for the S&P 500 index.
Even now, there is a plethora of articles pointing to the underperformance of Berkshire shares since the start of 2019, up just 12% versus S&P 500’s 16% gain. However, since all the way back to 1965, Berkshire shares have returned a compound annual growth rate of 20% versus S&P 500’s 10% over the same period. It means USD 1 invested in Berkshire in 1965 is now worth USD 43,749, considerably more than the USD 309 that would have been if the same dollar had been invested in the S&P 500.
The magic of compounding is such that, even from 2019 when Berkshire has been underperforming, your USD 1 investment in 1965 would have begun 2019 at USD 24,660 and ended up USD 43,749 at the end of 2023—a gain of USD 19,088 at the “inferior” 16% average annual return. In contrast, your USD 1 investment in S&P 500 in 1965 would have begun 2019 at USD 149 and ended up USD 309 at the end of 2023—a gain of USD 160, even at the “superior” 16% average annual return. I know which one I would prefer.
Our second observation is exercising patience and letting the magic of compounding snowball our savings to prosperity is easier said than done. Emotions get in the way and there are infinite temptations in the market, forcing us to “don’t just sit there, do something!” Indeed, the primary function of the gazillion pieces of information, news, rumours, musings and analysis propagated every day is to compel financial market participants to act, react and create transactions. But patience has paid handsomely for long-term Berkshire shareholders.
Buffett’s younger sister, Bertie, certainly tried to be an active participant in the market in her early days. According to Warren, it wasn’t until 1980, when Bertie was 46, that she decided to stop mucking about and just passively watched her money in a mutual fund and Berkshire shares grow. If she invested USD 100,000 (purely my guess) in her brother’s company in 1980, that would have grown to … wait for it … over USD 100 million by the end of 2021. No wonder Bertie was able to donate “nine-figure” philanthropic gifts. And I bet she has never listened to any self-proclaimed “super investors” on twitter, flogging the next great investment trade!
Our third observation circles back to the investment tenet Buffett credited Munger for instilling in the Berkshire Hathaway Way—invest in companies with “mouth-watering” economics. It is this tenet that has turbo-charged the magic of compounding for Berkshire shareholders.
In layman’s terms, “mouth-watering” economics mean quality companies. But “quality” can be such a broad and nebulous attribute. We at Morningstar have tried to define this tenet in our economic moat framework, one that guides and governs the way we look at all the companies under our coverage. And, of course, we are indebted to Buffett for coming up with this allegoric principle, as he was really the first investor to coin the term, economic moat, during the 1995 Berkshire annual shareholders meeting.
In essence, we see a quality company as one that can generate returns on their capital at a sustainably higher rate than the cost of that capital. In a laissez-faire economy where capital freely flows to the best available returns, generating such excess returns is difficult. Yet, some companies have been doing so, and are likely to continue doing so, for a very long time. We at Morningstar have identified five ways or sources that can furnish an economic moat around a business, so that it can fend off competition and continue to generate excess returns. Exhibit 5 illustrates these five sources.
Exhibit 5: The five sources of Economic Moat
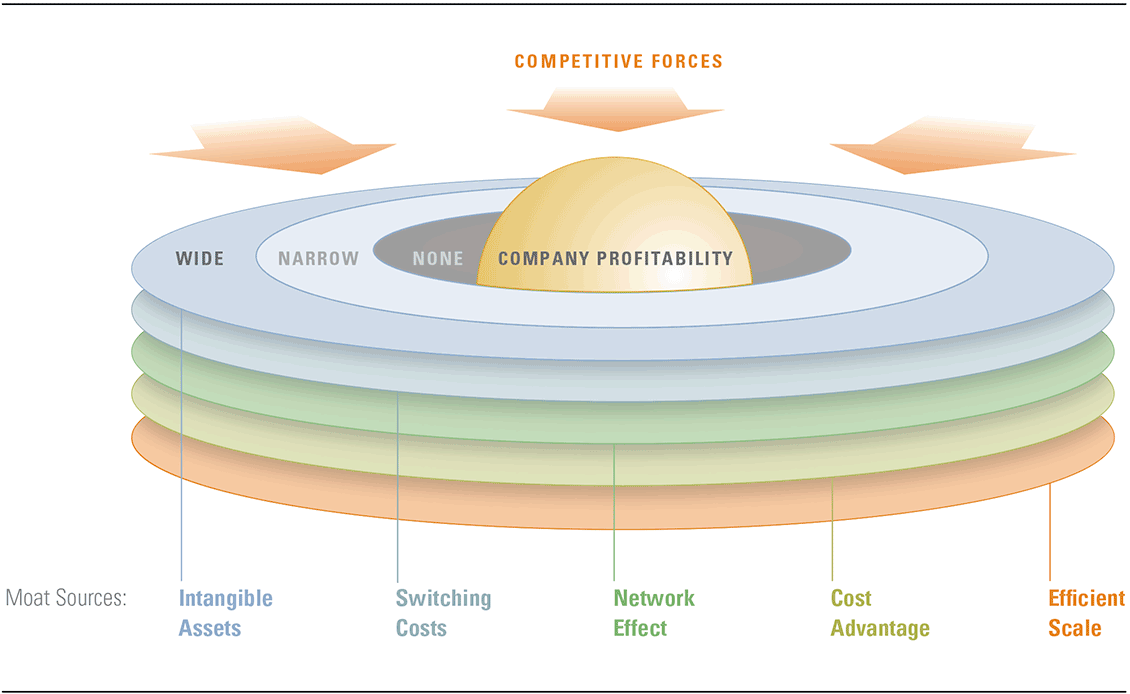
Source: Morningstar
To see a real-time application of this moat framework, take a look at Berkshire’s current top-five equity holdings, as shown in Exhibit 6. Buffett and Munger have over the years explained why they laud the economics of some of these companies. They like Coca-Cola Co (NYS:KO) because they cannot envisage the power of its brands diminishing. In fact, they are likely to increase even more in the future, as the brands are exported overseas and new markets open up for Coca-Cola’s “fun-loving” syrup. In the Morningstar framework, we view that brand power as an Intangible Assets source for an economic moat that is likely to protect Coca-Cola’s excess returns for a long time to come. For American Express (NYS:AXP), Buffett believes consumers and businesses’ “need for unquestioned financial trust” plays right into the global group’s wheelhouse. But, according to our analyst, it is not American Express’ brand reputation that is the source of its economic moat. Rather, it is the group’s closed-loop network for cardholder payments, coupled with its huge ecosystem of affluent customers and merchants keen to access those customers, that erect network effects and switching costs to maintain American Express’ excess returns.
Exhibit 6: Berkshire’s five largest equity holdings and our view of their Moat sources
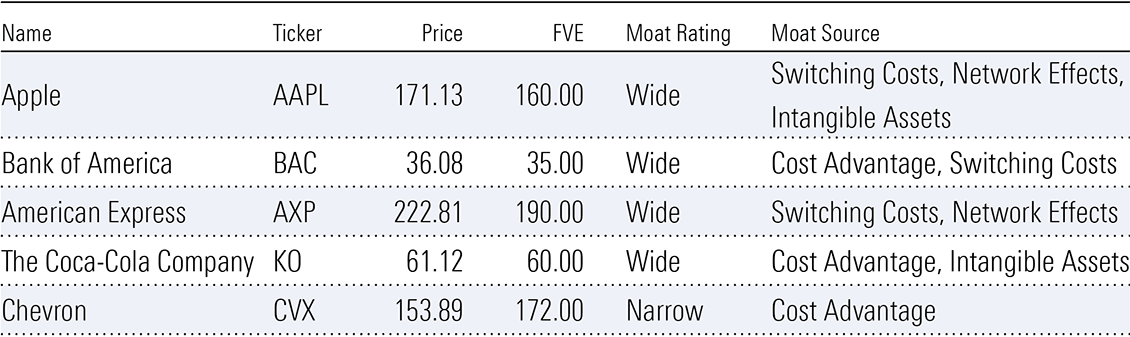
Source: Pitchbook, data as at close of market on March 13, 2024
Such are the “mouth-watering” economics of these businesses, the five stocks shown in Exhibit 6 constituted 79% of Berkshire’s equity portfolio at the end of 2023. Instead of “diworsifying”, Buffett and Munger believe when you’re on a good thing, don’t just do something—sit there and watch the few eggs in the one basket very carefully. For us mere mortals, perhaps this is taking too far and some diversification is sensible.
We are believers in the Berkshire Hathaway Way of thinking about companies. And we are believers in the magic of compounding once we are invested in these quality companies. So much so that we even have a family of Morningstar Moat index funds.
The flagship fund is the Morningstar Wide Moat Focus Index which provides investors exposure to a diversified portfolio of around 50 attractively priced US companies with durable competitive advantages according to Morningstar’s equity research team. It is a fund with almost USD 16 billion of assets under management, and has outperformed the US market by 3.3% per year since its inception in February 2007. In fact, the performance of Morningstar Wide Moat Focus Index has gone toe-to-toe with Berkshire over the past ten years to 2023, generating an average annual return of 13.5% compared to 11.8% for Berkshire (see Exhibit 7).
Exhibit 7: Morningstar Wide Moat Focus Index going toe-to-toe with Berkshire
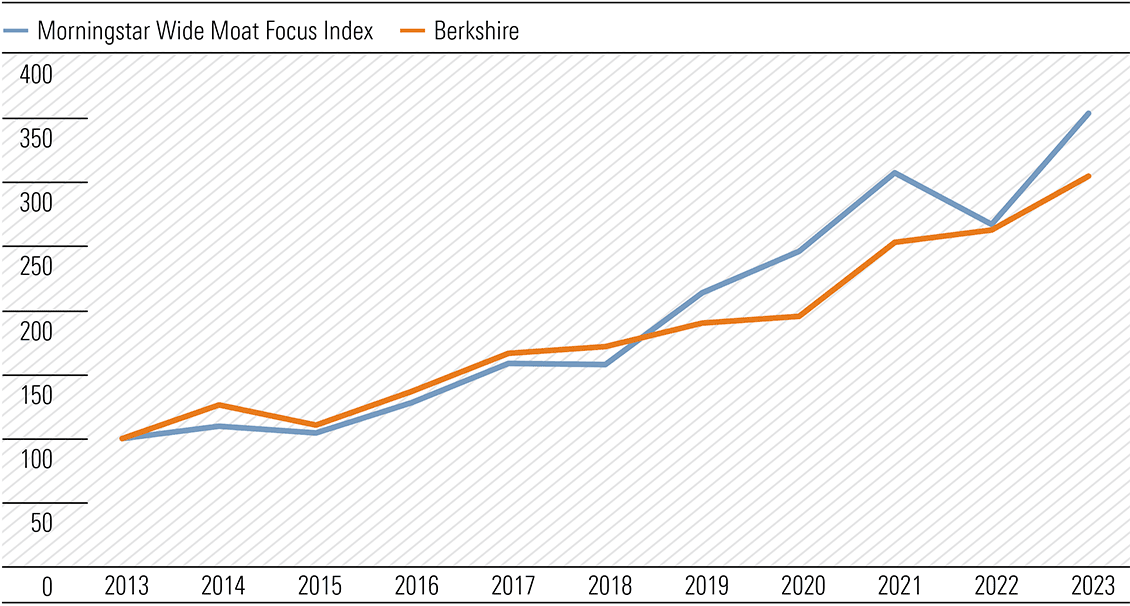
Source: Morningstar, Morningstar Direct
Buffett is indebted to Munger for influencing his way of thinking about companies, in terms of their durable competitive advantages. We at Morningstar are even more indebted to this Berkshire dynamic duo, for the way we think about the sources of durable competitive advantages.
Berkshire Hathaway annual letters and the pearls of wisdom from the subsequent annual shareholder loolapalooza in Omaha will not be the same without Munger. But his contribution to Berkshire’s performance and Buffett’s investing philosophy will live on, as will his many enduring quotes. We end with one of the Munger classics:
“It is remarkable how much long-term advantage people like us have gotten by trying to be consistently not stupid, instead of trying to be very intelligent”.
Notably, Berkshire trimmed its position in Apple AAPL during the quarter. But despite the haircut, Apple stock remains Berkshire’s top holding—by a landslide. Buffett and his team slashed their positions in HP HPQ and Paramount Global PARA. Berkshire entirely sold out of its positions in D.R. Horton DHI, Globe Life GL, Markel Group MKL, and StoneCo STNE.
4 Warren Buffett shares to buy now
- Charter Communications CHTR
- Citigroup C
- Kraft Heinz KHC
- Kroger KR
Charter Communications
- Morningstar Rating: 5 stars
- Morningstar Economic Moat Rating: Narrow
- Morningstar Capital Allocation Rating: Standard
- Industry: Telecom Services
Citigroup
- Morningstar Rating: 4 stars
- Morningstar Economic Moat Rating: None
- Morningstar Capital Allocation Rating: Standard
- Industry: Banks—Diversified
Kraft Heinz
- Morningstar Rating: 5 stars
- Morningstar Economic Moat Rating: None
- Morningstar Capital Allocation Rating: Standard
- Industry: Packaged Foods
Kroger
- Morningstar Rating: 4 stars
- Morningstar Economic Moat Rating: Narrow
- Morningstar Capital Allocation Rating: Exemplary
- Industry: Grocery Stores
More about Warren Buffett share picks
Earlier this month, famed US hedge fund investor David Einhorn gave one of the more fascinating interviews I’ve heard in recent years. For those that don’t know him, Einhorn has run Greenlight Capital since 1996 and is well-known for having shorted Lehmann Brothers prior to the 2008 bust.
In the interview with Bloomberg, Einhorn declares that passive investing has fundamentally broken markets. And that the changes wrought from passive investing have meant he’s had to change his method of value investing to stay in business.
His claim that passive investing is distorting markets isn’t new. Active managers have long complained about the issue. Yet Einhorn makes some important observations about how he thinks indexing is changing the structure of markets:
“There’s all the machine money and algorithmic money … which doesn’t have an opinion about value. It has an opinion about price. Like what is the price going to be in 15 minutes? And I want to be ahead of that or zero-day options. What is the price of the s and p or whatever stock you’re doing for today, what’s it going to be in the next half hour, two hours, three hours? Those are opinions about price. Those are not opinions about value. Passive investors have no opinion about value. They’re going to assume everybody else’s done the work, right?
And then you have all of what’s left of active management and so much of it, the value industry has gotten completely annihilated. So, if you have a situation where money is moved from active to passive, when that happens, the value managers get redeemed, the value stocks go down more, it causes more redemptions of the value managers, it causes those stocks to go down more.
… And, all of a sudden, the people who are performing are the people who own the overvalued things, that are getting the flows from the indexes, that are getting you take the money out of the value, put it in the index, they’re selling cheap stuff and they’re buying, you know whatever the highest multiple, most overvalued things … in disproportionate weight. So, then the active managers who participate in that area of the market get flows and they buy even more of that stuff. So. what happens is instead of stocks reverting toward value, they actually diverge from value. And that’s a change in the market and it’s a structure that means that almost the best way to get your stock to go up is to start by being overvalued.”
How Einhorn has adapted to the changes in markets is intriguing. Einhorn had a fantastic track record in the almost 20 years to 2015. Then, he had two awful years and three mediocre ones. Some of you may recall that news publications started to question his ability during this time, if not writing him off altogether.
How Einhorn came through this period is instructive. He analysed his period of underperformance and realised that he had continually bought cheap stocks and when these stocks handily beat earnings estimates, they weren’t being re-rated by the market. Because they were outside of indices and not included in ETFs, there were few buyers for these stocks.
This happened often enough that it made him change his investment style:
“… what we have to do now is be even more disciplined on price. So, we’re not buying things at 10 times or 11 times earnings. We’re buying things at four times earnings, five times earnings, and we’re buying them where they have huge buybacks, and we can’t count on other long only investors to buy our things after us. We’re going to have to get paid by the company. So we need 15-20% cash flow type of type of numbers. And if that cash is then being returned to us, we’re going to do pretty well over time … you’re literally counting on the companies to make that happen for you.”
Since Einhorn has made these changes, he’s gone back to handily beating the market benchmarks.
Passive a goliath in US, not so much in Australia
Einhorn’s comments raise several important questions about today’s markets.
There’s little doubt that passive investing is growing quickly and taking market share from active funds. Last month, for the first time, passively managed funds in the US controlled more assets than did their actively managed competitors.
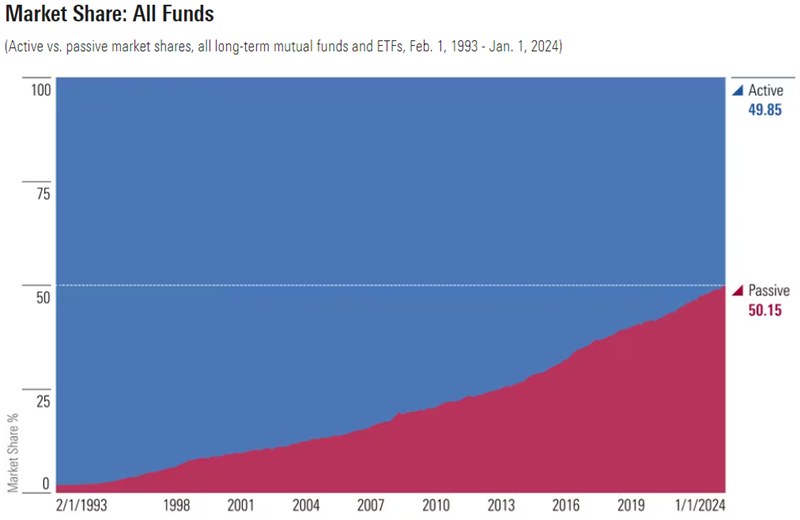
Source: Morningstar
That’s after passive US equity funds took in US$244 billion in 2023, while active funds had outflows of US$257 billion, continuing a long-running trend.
The relentless growth in passive funds has resulted in the largest ETF and index providers growing into behemoths. Blackrock now has A$14.5 trillion under management, while Vanguard has A$11 trillion.
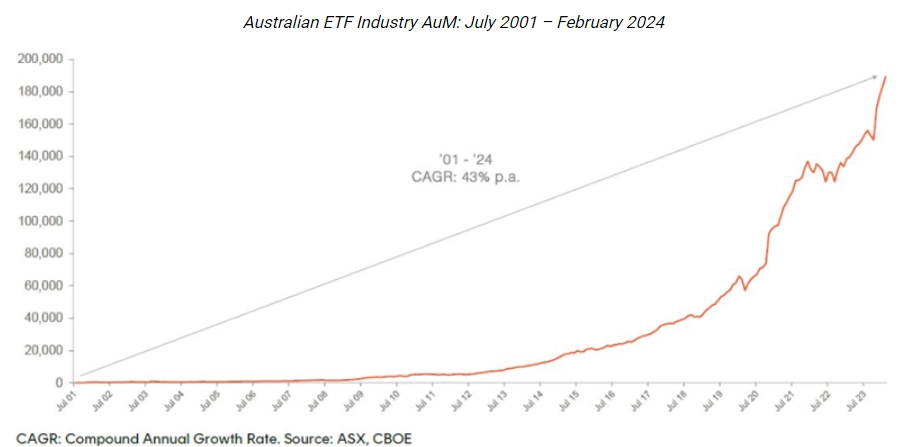
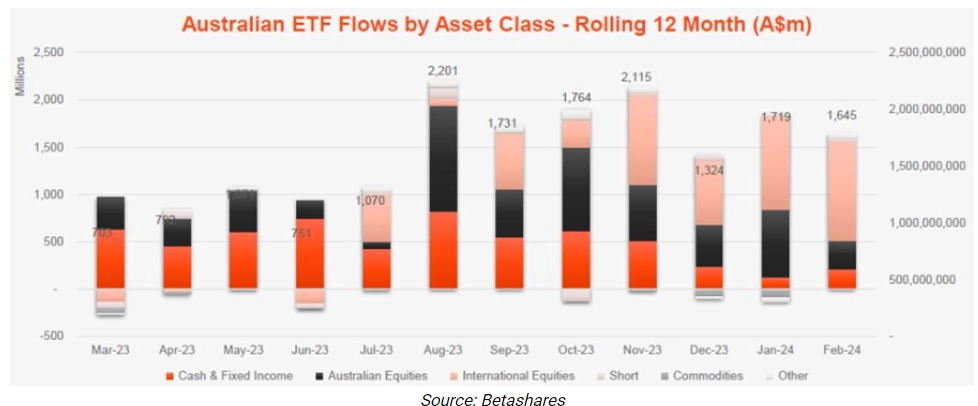
The growth in passive funds in the US has been mirrored in Australia. Last year, the ETF industry here grew 33% year-on-year to $177.4 billion in funds under management, according to BetaShares.
Yet unlike in the US, ETFs are relatively small fry still compared to active funds. The latter, which include industry funds, retail funds and other fund managers, have funds under management at close to $4.5 trillion, about 25x the size of the ETF market.
And ETF insiders suggest passive ownership of the ASX 200 is close to 10%, a far cry from the larger share it has in the US.
Yet, further growth in passive funds seems likely, with investors attracted to the simple and low-cost access that ETFs provide to markets, as well as their performance versus active funds.
The other big market trend
Along with the rise of passive funds, there’s also been an increasing institutionalisation of markets. In the US, professional money managers accounted for 10% of share ownership after the Second World War. That’s risen to close to 67% today. It means that in the 1940s and 1950s, active fund managers had far fewer direct competitors – their main competitors were individuals.
Professional fund managers are hired and fired according to how they perform compared to benchmarks. As passive funds pile into the stocks included in benchmarks, it’s likely that active managers are being forced into buying into the same stocks to keep up with these benchmarks. If they’re buying into the same stocks as passive funds, and charging higher fees to clients, it isn’t a surprise that active funds have consistently underperformed passive ones over the past 10 years.
It’s why Einhorn is complaining that passive funds are breaking markets. He’s saying individual investors are fleeing into passive funds, and these funds are buying stocks included in indices, which are principally the larger companies. And they are doing that automatically, without regard to price. Also, active funds, to keep up with benchmarks and passive funds, are buying into the same stocks.
According to Einhorn, stocks that are outside of benchmarks are being ignored by individual and professional investors. Even if these stocks are undervalued and their fundamentals are improving, there are few if any buyers for these companies in the current market.
Are Einhorn’s concerns valid?
There is some anecdotal and academic evidence to support Einhorn’s claims. For instance, it does seem larger cap stocks are getting more investor love than at any time in recent history. Late last year, Goldman Sachs did a study that found the S&P 500 is more concentrated than it’s ever been. The average weight of top 10 stocks in the S&P 500 index has been 20% over the past 35 years. During the dot-com bubble, the combined weight of top 10 stocks peaked at 25%. Today, the figure stands at 32%.
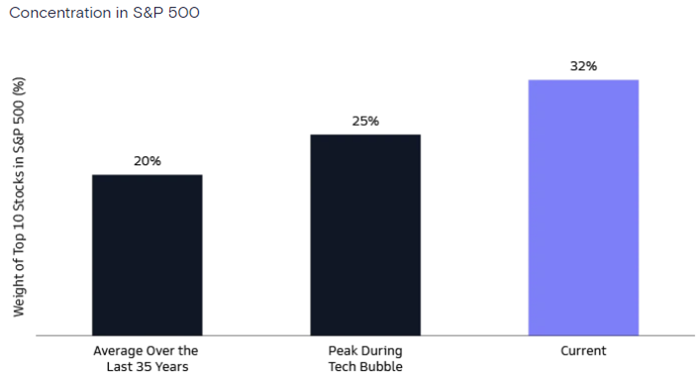
Source: Goldman Sachs
That’s led to significant outperformance from large cap stocks versus small caps. Last year, US large caps returned 26.2% compared to US small caps’ 16.8%. Since 2011, large caps there have returned 382%, or 13% annualized, versus small caps’ 208%, or 9% per annum.
The story of large cap outperformance has also been evident in Australia.
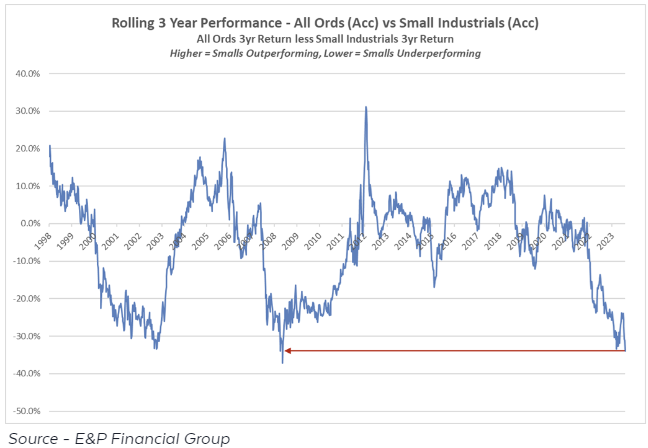
The largest stocks have tended to be ‘growth’ stocks, and growth has destroyed value over the past 15 years.
There’s also academic evidence that backs some of Einhorn’s assertions. In a 2022 paper, ‘How Competitive is the Stock Market’, UCLA’s Valentin Haddad and colleagues found that the rise of passive investing was distorting price signals and pushing up the volatility of the US market. The paper examined institutional investors and concluded that the rise of passive investors’ share of the US market over the past two decades “has led to substantially more inelastic aggregate demand curves for individual stocks, by 15%”. Passive investors have a demand elasticity of zero, because they automatically buy stocks without regard to whether it’s cheap or not. If a stock is cheap, demand from passive investors won’t increase. In theory, that should mean other investors step in to make up the demand shortfall in stocks, but the paper suggested that hadn’t happened.
Counterarguments to Einhorn
The anecdotal evidence mentioned above is just that: anecdotal. The academic evidence is also relatively new and untested.
There are several potential counterarguments to Einhorn’s assertions that passive investing is distorting markets and prices:
- The influence of passive funds on market prices may be less than claimed. Passive funds typically have low turnover, of 10-20% each year. That compares to active funds of +50%. Trading sets prices, and therefore the influence of passive investing on pricing may be overstated.
- If stock markets and price discovery are becoming less rational, that should help active investors rather than hinder them. If markets are fully rational and price stocks perfectly, there would be no role for active investors.
- Indexing may aid price discovery rather than hinder it. For example, it increases the supply of lendable shares and thus enables short selling.
In short, there may be some truth to Einhorn’s complaints though they are likely exaggerated.
The danger of passive investing for markets
Nonetheless, Einhorn is right to point out the changes that passive investing is bringing to markets. If passive investors are crowding into the large cap stocks that dominate indices, and active investors are mimicking them to keep up with performance benchmarks, it’s logical that the reverse can happen too. That is, in a market downturn, there may be a rush for the exits as both passive and active investors get out of large cap stocks. This may become even more of an issue as passive funds continue to take market share from active managers.
There hasn’t been a real test of this sort for passive investing. That said, markets did remain relatively orderly in 2022 when they were hit hard. A larger market downturn would be a real test for passive investing and the changes it’s made to markets. Whether it leads to a shakeout in passive funds is also an open question.
Investors can learn from Einhorn
You must credit Einhorn for changing his investment style to adapt to the changes that he sees in markets. Here was a guy that was known as one of the best hedge fund investors in the world, going through an extended rough patch. He could have easily doubled down on the strategy that had brought him results and fame over the previous years. Instead, he questioned that strategy and decided to change tack.
It would have been a big risk to change investment style at that time. He was under a lot of pressure from his clients and the media. If it went wrong, he would have looked foolish, and it might have been game over for his fund. Instead, it helped him turn things around.
Investors can learn a lot from Einhorn’s objective assessment of his underperformance, the reasons behind it, and changing his investment process and style to address the issues.
James Gruber is an assistant editor at Firstlinks and Morningstar.com.au
Just what the Federal Reserve (the Fed) and financial markets did not want to read was the hotter-than-expected January CPI report from the Bureau of Labor Statistics. Financial markets are all about expectations and they went into meltdown as pent-up expectations for rate cuts evaporated and the froth blew off market tops.
At the intraday lows, the Dow was down 757 or 2%, the S&P 500 off 102, also 2%, and the Nasdaq Composite 200 down 390 or 2.5%. The Russell 2000 (smaller companies) most vulnerable to rate moves slumped 4.6%, its worst session since June 2022. All benchmarks partially recovered but still finished well into the red, with a 9–1 decline/advance on the S&P 500. Investor complacency was shaken with the COBE Volatility Index (VIX) jumping 13%. Rate sensitive regional banks were torched.
It wasn’t much better in the bond market with Treasury yields spiking, led by the 2-year and 5-year maturities up 19-basis points to 4.67% and 4.33%, respectively while the 10-year benchmark rose 14-basis points to 4.32%. The key level is around 4.35% where some resistance could be encountered. It is the level from which yields spiked to over 5% in October 2023.
Headline inflation rose 0.3% month-on-month (m/m) against 0.2% expectations, with the year-on-year (y/y) rate at 3.1% against consensus of 2.9%. The increase in the core print of 0.4% m/m was the highest since May 2023 and above 0.3% consensus, while the annual rate sits uncomfortably at 3.9% hotter than the expected 3.7% (Exhibit 1). There were increases in shelter, motor vehicle insurance, and medical care while prices of used cars and trucks and apparel eased along with energy and energy services. Medical care services increased 0.7% m/m, one of the highest increases in 30 years. The inflation glide path is not as smooth as some anticipated.
Exhibit 1: United States core inflation rate (%)
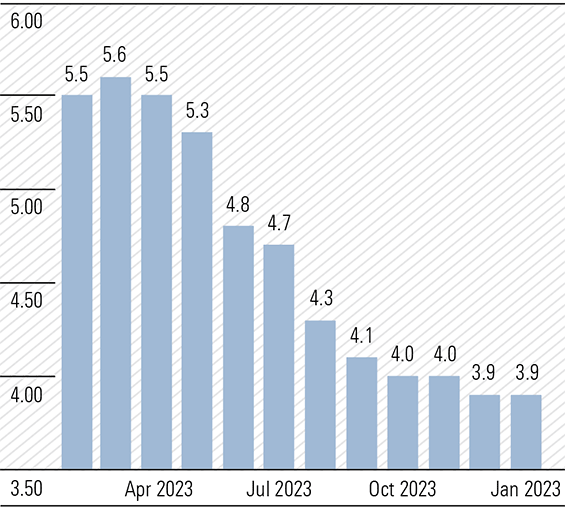
Source: www.tradingeconomics.com, U.S. Bureau of Labor Statistics
The elevated CPI report comes hard on the heels of an above expectations 0.6% m/m increase in average hourly earnings in January which pushed the annual rate to 4.5%. Recall, the January jobs report saw non-farm payrolls jump 353,000 against expectations of 185,000.
The core print is not a good number and worse the super core—ex energy services and rentals—surged 0.85%, the biggest jump since April 2022 with the y/y reading reverting to an eight-month high at 4.4% from 3.9% in December.
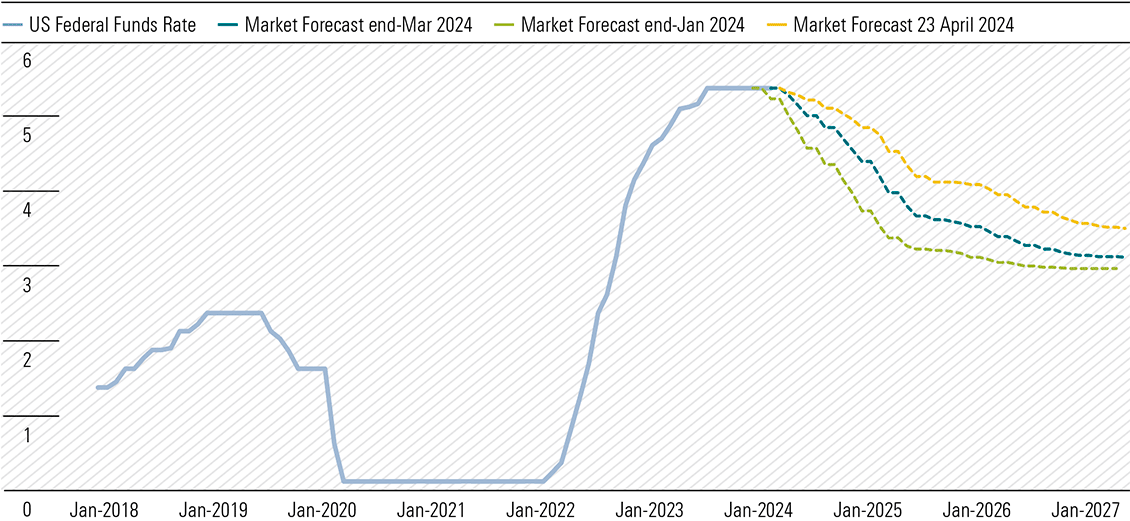
The CPI report finally puts a nail in the coffin for a March cut and places in jeopardy a cut in May. The likelihood of a May cut is 35% from 52% prior to the CPI release. It was at certainty odds in January of 100%. (Exhibit 2). As mentioned in previous Overviews certainties sometimes get beaten.
Exhibit 2: Changing expectations for the Fed
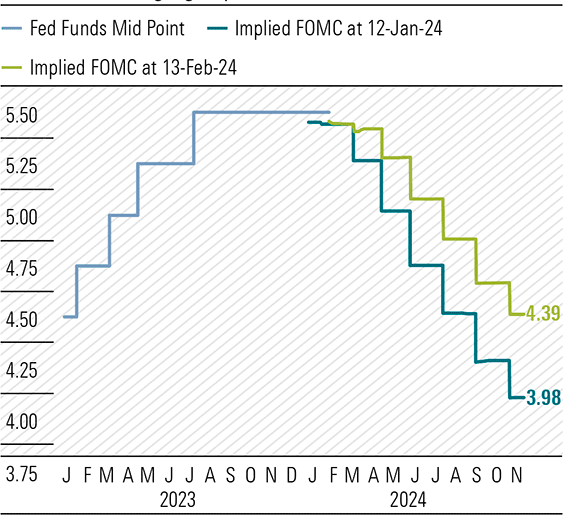
Source: National Australia Bank, Federal Reserve, Account in-house, Bloomberg, Macrobond
Recent Fed speak has been pushing back against cutting too early and this inflation report will only steel the more hawkish FOMC members.
Interestingly, as the S&P 500 hit a new peak last Friday, less than 10% of the stocks in the index hit 52-week highs. When the market has a correction, there could be some excellent opportunities on offer, both in international markets and at home.
Local surveys results send mixed messages
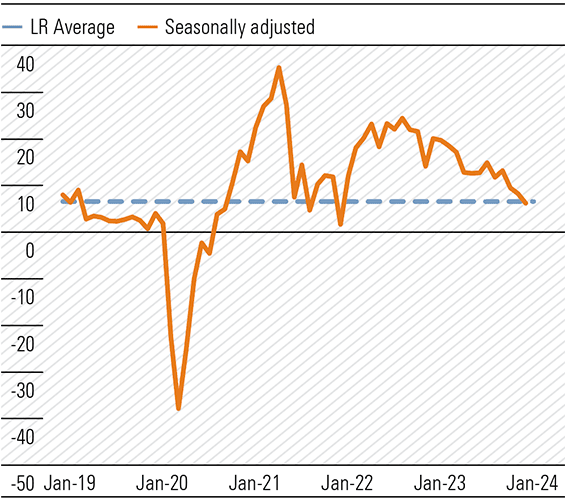
The latest NAB Business Survey and the Westpac-Melbourne Institute Consumer Sentiment Index provided some relief from the depressing tone of late 2023, although most key readings remain well below long-term averages.
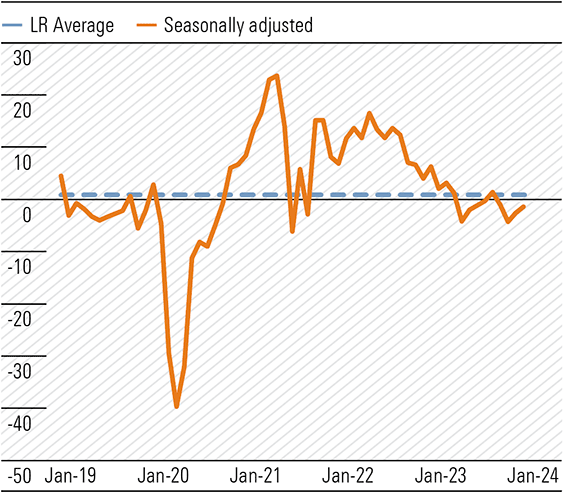
NAB’s survey for January revealed “confidence remained low, and conditions eased to be just below their long-run average, ending a two-year run of above average conditions while forward orders remain soft.” While the 24–31 January survey showed business confidence edging up 1 point to +1 any excitement was muted with the index well below long-term average (Exhibit 3). Across the states, confidence remained negative. There were improvements in manufacturing and construction partially offset by declines in retail and wholesale.
Exhibit 3: Business confidence, SA (net balance)
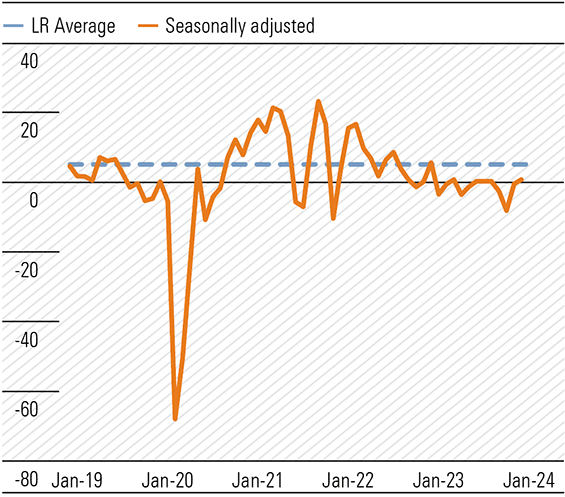
Source: NAB Monthly Business Survey Jan-24
The business conditions index eased 2 points to +6, just below the long-term average of +7, ending a two-year run above the average (Exhibit 4). Trading conditions, profitability and employment all fell. Forward orders edged higher to -1, still below the long-run average, (Exhibit 5) with retail a depressed -19. Capacity utilisation moved higher, remaining elevated and above long-term average. Rates of cost growth for both labour and other inputs increased (Exhibit 6). Inflation is still kicking.
Exhibit 4: Business conditions, SA (net balance)
Source: NAB Monthly Business Survey Jan-24
Exhibit 5: Forward orders, SA (net balance)
Source: NAB Monthly Business Survey Jan-24
Exhibit 6: Cost growth, SA (% qtly eq.)
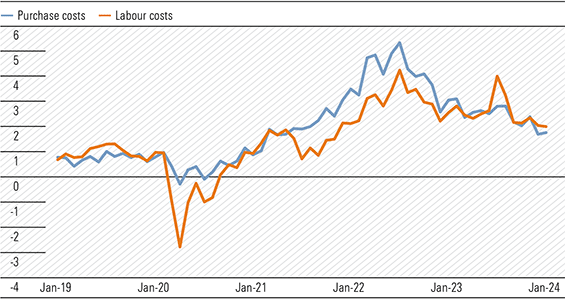
Source: NAB Monthly Business Survey Jan-24
Consumer sentiment bounced off January lows in Westpac’s survey with the index up 6.2% to 86, the largest monthly gain since April 2023 when the Reserve Bank paused hiking (Exhibit 7). The index is at its highest level since June 2022. The drivers were the benign December quarter CPI and the increasing possibility of interest rate cuts later in the year. Despite the rebound, consumer sentiment remains well in the pessimistic zone.
Exhibit 7: Consumer Sentiment Index
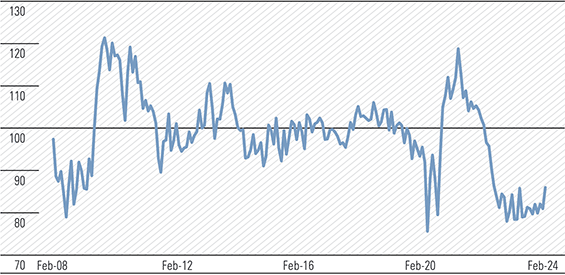
Source: Westpac Economics, Melbourne Institute
Influential in the sentiment rebound were sub-indexes ‘time to buy a major household item’ and the forward looking ‘economic conditions next 12 months’. Rate cut expectations would also have filtered through, although confidence was lower after the RBA’s 6 February meeting than prior. This suggests the less dovish commentary versus expectations were a factor given the survey was conducted between 5 and 9 February. Changes to stage three tax cuts would have helped in the improvement in one-year forward expectations.
The rally appears tentative and despite the change in the ‘time to buy a major household item’, I doubt Gerry Harvey has increased inventory in anticipation. Incidentally, the sub-index bounced 11.3% from 78 to 86.8 but still significantly below the historical average of 124.7. Positive yes, and among the consumer gloom we’ll take it, however, don’t get too excited just yet.
Current conditions reflect the intensity of pressure on household finances. Sub-indexes ‘family finances versus a year ago’ and ‘family finances next 12 months’ increased 4.9% and 2.4%, respectively to 66.1 and 95.3 against historical averages of 88.4 and 106.8, respectively. The unemployment expectations sub-index drifted 2.9% from 130.7 to 126.9 and just below the long-term average of 129. The labour market remains at the tight zone, with an easing bias.
We look forward to the March survey to see whether the improvement is sustainable. Consumer demand is likely to remain weak near term and RBA commentary will be closely monitored, but cuts are likely at least six months away.
Will the consumer psyche change quickly?
The inflationary environment of the past two years has allowed companies to lift prices sometimes by a greater degree than was necessary. While some will have been behind the curve, others got ahead assuming costs would continue to increase. Consumers were conditioned to rising prices and some businesses took advantage of the situation.
This action probably protected margins to some extent. An example comes from Boral’s half yearly report—The strong result reflects margin expansion as price increases across all product lines more than countered cost inflation. Now, with inflation subsiding and the consumer in a much more frugal state of mind, the shoe is on the other foot.
Low-middle income households, those that move the economic needle, have not experienced this intense pressure on budgets for many a long year and frugality is now ingrained in their psyche. JB HiFi’s CEO reported more customer haggling and going forward this is likely to become the norm, rather than the exception.
While consumer sentiment is likely to improve as interest rates and taxes are trimmed and prices stop rising at past rates, the change in spending behaviour is unlikely to V-reverse. As with monetary policy, there is likely to be a lag, possibly of a measurable duration.
Consequently, the rise in consumer frugality may not be good news for corporate profit margins given the operating cost base or cost-of-doing-business is now much higher and unlikely to decline meaningfully. While management will focus on reducing costs, wage increases of the past two years are embedded and wage-related costs will only fall as hours worked decline and/or unemployment rises. This will then have knock-on implications for demand.
Supermarkets are already under investigation for possible price gouging and pricing strategies are under the microscope. Coles has called on some suppliers to reduce prices by up to 14%. As inflationary pressures subside, supermarket operators are planning a discounting blitz to possibly appease the government and regulators. Probably a rearguard action with consequences.
Banks, insurance, utilities, and telecommunications sectors could be added to the regulator’s hit list. Recall, insurance premiums increased by 16.2% in the year ended December 2023, the largest annual rise since 2001. My strong recommendation shop around (see Observations).
Passive investing bleeding managed funds
Exchange-traded funds (ETFs) are dominated by passive funds, those mimicking stated benchmarks, and do not create alpha. There are active ETFs, where the manager overlays strategies within the portfolio to generate alpha, to outperform the stated benchmark, but these are in the minority.
From the vanilla product offering in the 1990s, where all ETFs were tied to a specific index or benchmark, the product suite now resembles a giant size gelato bar where every flavour is on offer. And new ones are added on a whim or sniff of an opportunity to attract any funds looking to chase the next potential winner or fad. Develop, seed, launch and hope funds flow in. If successful, another flavour is added to the gelato bar offerings, now probably in the hundreds.
Momentum and growth-facing ETFs are currently dominating, heightened by what seems an insatiable appetite for anything related to artificial intelligence (AI), led by the mega techs Microsoft, Meta, and the barnstorming Nvidia. Value has been jettisoned and individual stock prices are driven by fund inflows into general or specific ETFs. Strangely, there is an element of Ponzi schemes in ETF behaviour as stock and fund prices are dependent on future fund flows. What would support prices if fund inflows stopped or declined? Would they then be influenced by active managers and investors?
Underperforming active funds are hemorrhaging with some bigger industry funds taking management back in-house and others moving mandates to the passive sector. In recent weeks the question has been asked about Commonwealth Bank’s surge to $120 and an accompanying FY24 P/E multiple of 20. The probable reason is active managers have been underweight Australian banks, including Commonwealth. The switch to passive sees funds flowing into the second largest company by market capitalisation and international funds buying Australia would target leaders.
Generally, ETFs do not heed the plea of The Little Doer Carpet Company—tell em the price, son!
Reporting Season—Winners and Losers
The reporting is on in earnest with individual company reports and guidance being either rewarded or sent to Coventry. Exhibit 8 are the best and worst in our coverage so far.
Exhibit 8: Reporting season winners and losers
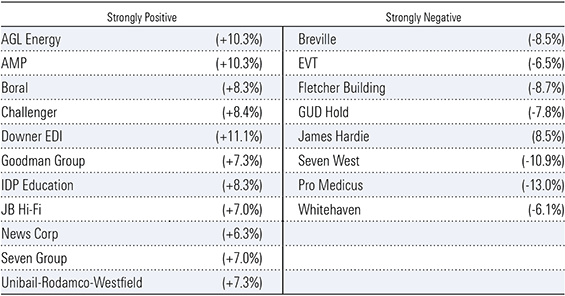
Source: Morningstar
My Initial Market Reaction (IMR) rating monitors the share price reaction to results in the 24 hours after the announcement. Strongly Positive reflects a price rise of over 5%; Strongly Negative a fall of over 5%.
Observations
Recently I received a motor vehicle renewal notice which increased 15.3% to $1,148.78 from the leading domestic insurer who I have been with for 40 years or more and with very long no claim record. I replaced the exact policy with an equally large domestic insurer for $407.74. Do yourself a favour and haggle on every renewal notice.
If your agreed value or market value policy is below $8,000 net of excess, ask yourself, Do I really need comprehensive insurance? Perhaps look at just Third Party cover—Stay alert, drive safely, and save money.
Retirement
After 57 years in the investment industry, I have decided to retire, effective 1 March. My last Overview will be in Your Money Weekly 8 on 29 February.
The headline of Your Money Weekly Issue 1 of 2023 was “Zero to Hero; Can Powell orchestrate a soft landing or is it Mission Impossible?” The year was dominated by inflation, interest rates (rising) and invasion.
A year later we are still awaiting the outcome.
Before exploring the possibilities ahead, a look over the shoulder can be educational.
Against all odds and most forecasts, 2023 was a record-breaking year for financial markets. Santa arrived early and provided a strong boost in November to a waning performance up until October. The excitement around Artificial Intelligence (AI) provided a boost to the now hackneyed Magnificent Seven and their overwhelming influence on the Nasdaq 100 and Composite (200) and the S&P 500 should not be underestimated. In fact, a new index was spawned, the S&P 493.
A quick snapshot of the 10 months to October 2023 reveals a lacklustre performance, excluding Nasdaq and the S&P 500, and did not provide any inkling of the impending and welcome fireworks in store in November and December (Exhibit 1).
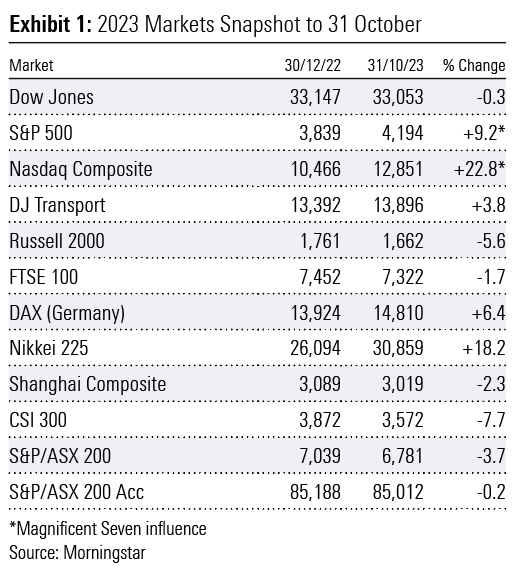
The performance of the Nikkei 225 was driven by a continuation to accommodative monetary policy settings and quantitative easing bond purchases by the Bank of Japan. In contrast, the central banks of other developed economies aggressively raised official cash rates to decade highs to bring inflation to heel.
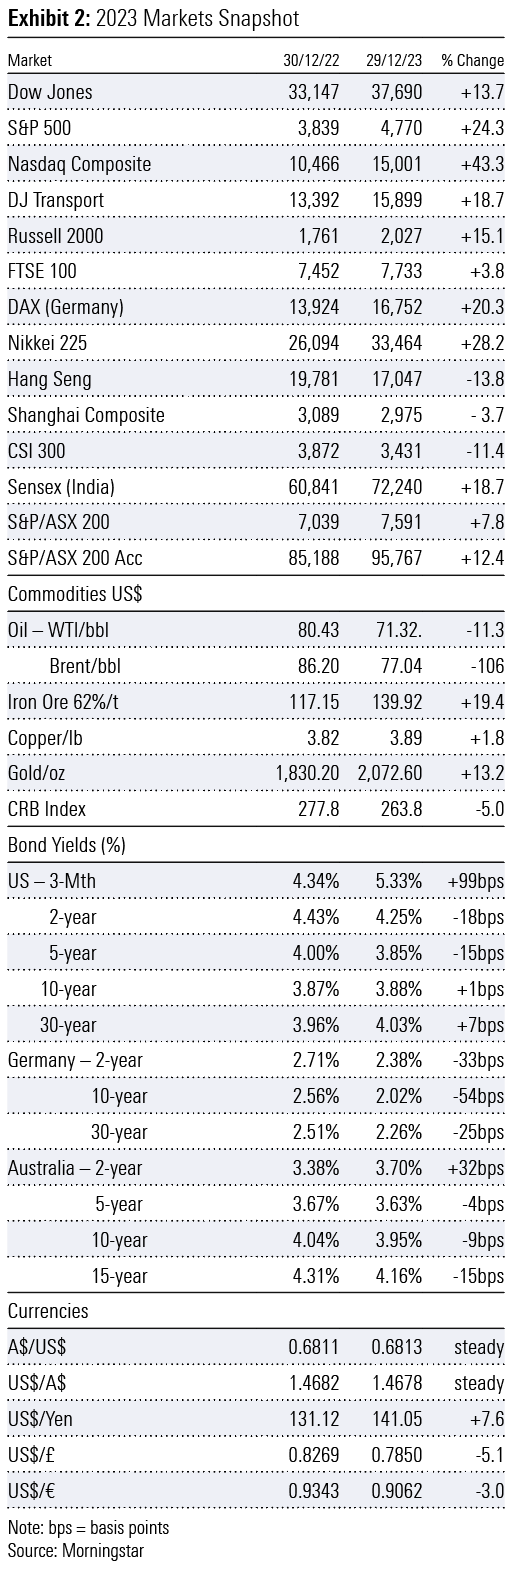
November marked the early arrival of Santa and a meaningful change in sentiment. (Exhibit 2)
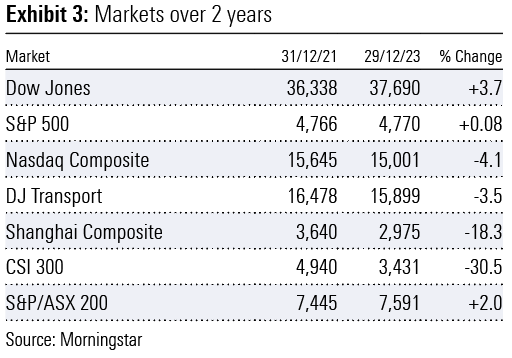
A brief snapshot of the past two years may surprise. China smashed; the rest having gone nowhere. (Exhibit 3)
By the close of 2023, records were broken. In December, all-time closing highs were made by the:
- Dow Jones Industrial Average seven times.
- Nasdaq 100 (NDX) multiple times
- US Semi-Conductor index (SOX)
- US Homebuilder ETF (XHB)
- US Industrial ETF (XLI)
- US Technology ETF (ELK)
- Magnificent Seven Index (MLUSMAG7) multiple times
- DAX Index (Germany) three times
- Sensex Index (India) four times
- S&P/ASX 20
- S&P/ASX 50 three times
- S&P/ASX 100 twice
- S&P/ASX 200 Accumulation (Australia) five times
There are likely many more.
The S&P 500 missed setting a new peak by just 12 points. Australia’s S&P/ASX 200 missed by 15 points, spearheaded to the edge of new heights by the index heavyweights Commonwealth Bank and the iron ore triumvirate BHP (adjusted for the sale of petroleum interests), Rio Tinto and Fortescue Metals Group breaking into record territory. A 21% rebound for CSL, the third largest weighted company in the index, joined the party. Collectively, these five stocks ensured the more concentrated S&P/ASX 20, 50 and 100 indices broke into new ground.
Note the meaningful (negative) underperformance of the Chinese markets. With the reopening of the Chinese economy in December 2022, expectations were high for a robust and sustainable recovery in 2023. Despite many attempts to stimulate the domestic economy, the recovery was overwhelmed by the collapse of the real estate sector which has been the driver of economic activity and wealth creation for decades.
Other not so welcoming records were also broken, including government debt across most developed countries along with associated debt servicing commitments for decades.
2024 – Hope springs eternal
A sample of the year’s opening headlines:
“Bull market set to roar in 2024.”
“The market’s bulls are running.”
So, we start the new year full of anticipation, expectation, and hope. Both equities and bond markets have already borrowed heavily from the Bank of Expectation and the jury is still out as to whether expectations can be met, let alone be exceeded.
Throughout 2024, uncertainty is almost certain to be a constant companion and with it associated financial market volatility.
Issues facing investors include but are not limited to:
- slowing economic growth and possible recession
- tighter monetary conditions despite likely interest rate cuts as excess liquidity is drained from the financial system
- Treasury yields do not return to the average levels of the past 15 years, which was both abnormal and unprecedented
- China’s economy continues to struggle impacting export-orientated economies in the eurozone, particularly Germany
- Lofty expectations of the Magnificent Seven disappoint
- Geopolitical tensions to remain elevated with two conflicts currently raging. The Taiwanese election to be closely watched. The November US presidential election is likely to put democracy under the microscope.
All eyes on the Fed
US Economy flight 2024 is on approach under the control of Captain Jerome Powell. He will be hoping the runway is clear (Japan Airlines) and all cabin door plugs (Alaskan Airlines) are secure as he attempts a widely anticipated trouble-free soft landing.
Remember, markets were pricing in six cuts, presumably of 25-basis points each, to the federal funds rate by the US Federal Reserve (the Fed) in 2024. This suggests the rate range will be slashed from 5.25%-5.50% (mid-point) 5.375% to 3.75%-4.00% (mid-point) 3.875%. I think this is highly unlikely and will only arise should the anticipated soft landing be much harder.
Market enthusiasm gathered momentum in November with a firm conviction the rate hiking cycle was over. Momentum was further supported following a dovish interpretation of commentary from chairman Jerome Powell and Fed speak from various members of the Federal Open Market Committee (FOMC) after the 13 December meeting.
The presumed Powell Pivot at the press conference following the meeting and the release of the economic projections of Federal Reserve Board members and Federal Reserve Bank presidents (dot plot), clearly indicated several cuts were on the cards in 2024. The 2024-year end median projection for the federal funds rate was from the current 5.4% to 4.6% and to 5.1% in the September projections. That is three cuts, not six.
Subsequent release of the minutes of the December meeting on 4 January ruffled the feathers of the doves. FOMC members concluded rate cuts were likely in 2024 with no inkling of timing. “In discussing the policy outlook, participants viewed the policy rate as likely at or near its peak for this tightening cycle, though they noted that the actual policy path will depend on how the economy evolves.” There remains an “unusually elevated degree of uncertainty” surrounding the policy path and “Participants generally stressed the importance of maintaining a careful and data-dependent approach to making monetary policy decisions and reaffirmed that it would be appropriate for policy to remain at a restrictive stance for some time until inflation was clearly moving down sustainably toward the Committee’s objective.”
Chairman Jerome Powell is no Alan Greenspan
Further out, the federal funds rate is projected to reach 2.9% in 2026 and longer run 2.5%. This contrasts to the average effective federal funds rate of 4.6% between 1954 and 2023, incorporating the 10 years between 2009-2016 and 2020-2022 when the rate was zero-bound post-GFC and in the pandemic years. Based on FOMC’s projection for core PCE inflation in 2024, 2025, and 2026 of 2.4%, 2.2%, and 2.0% respectively, the real federal funds rate forecasts are 2.2%, 1.4%, and 0.9%.
I am quite bemused the market has focused on the rate cuts and basically swept aside other important projections including real GDP growth, the unemployment rate, and core PCE inflation (Exhibit 4). I had assumed there was some relationship between all four.
Exhibit 4: Economic projections of Federal Reserve Board members and Federal Reserve Bank presidents, under their individual assumptions of projected appropriate monetary policy, December 2023 (%)
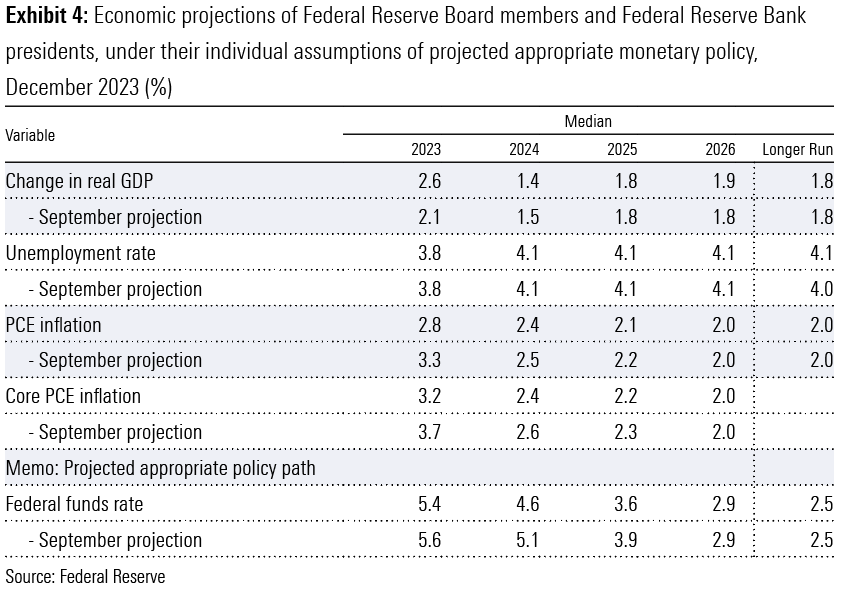
Despite projected rate cuts, real GDP growth is expected to slow from forecast 2.6% in 2023 to 1.4% in 2024, rising to 1.8% in 2025 and along with a further four 25-basis point cuts edging to 1.9% in 2026, with the longer run growth projection at 1.8%. Bank of America, one of the more optimistic forecasters predicts four rate cuts in 2024 and projects real GDP growth of 1.2%, near consensus of 1.3%, before picking up to 1.7% in 2025. In this scenario, what are the expectations around corporate earnings growth with real GDP growth sub-2%?
In the context of projected real GDP growth, FOMC members suggest longer-run real GDP growth of 1.8% against the average of 3.15% between 1948 and 2023. Lower-for-longer?
Valuations stretched?
What I do know is there is a relationship between the valuation of a company and the sustainability of operating cash flow, free cash flow, earnings per share, and shareholder returns, whichever method management chooses to deliver. The foundations of equity markets are based on the sustainability of the above corporate benchmarks. The speculative stocks and ‘fly-by nighters’ come and go and rarely have a lasting influence.
Peter Lynch of “One Up on Wall Street” fame developed the Price to Earnings Growth (PEG) ratio which added earnings growth to the more simplified Price Earnings Multiple (PEM) valuation tool. The PEG is calculated by dividing the current year PEM by the estimated earnings per share (EPS) growth for the next five years – a current PEM of
20 and estimated EPS growth of 10% results in a PEG ratio of 2. Peter Lynch classified companies with a PEG ratio below 1 as undervalued, at 2 meaningfully overvalued.
In my early days as an analyst in the late 1960s and early 1970s at the Bank of New South Wales and Hattersley & Maxwell, we always published the historical EPS growth for 5 and 10 years for well-established profitable companies we covered. These were in the days before discounted cash flow (DCF) models became the norm, although mining analysts did adopt DCF models before the industrial analysts joined in. We would compare the past performance with our future forecasts. Was the company’s EPS growth accelerating, declining or stable? The answer would determine the appropriate PEM (or range) allocated given the projected future growth profile.
According to FactSet, the bottom-up 2024 EPS estimate for the S&P 500 is US$246.30. This reflects the aggregation of the median EPS estimates for 2024 for all 500 companies. The S&P 500 closed 2023 at 4,770 suggesting a PEM of 19.4. While both average and aggregates can be misleading, what are the chances of the S&P 500 companies achieving average annual compound growth of almost 10% – a PEG ratio of 2 – over the next five years, particularly given the economic projections of FOMC members, with real GDP growth of just 1.8% longer run?
The 4Q23 reporting season is about to start. Analysts have already played their quarterly game – trimming estimates and when announcements are released the market is upbeat as results beat reduced expectations. Bloomberg reports 4Q23 EPS expectations for the S&P 500 are US$54.50, down 2.8% on 4Q22 and well below the US$57.70 forecast in September. Forecast 2023 EPS is US$220.90 from US$222.30 in 2022. Recall, year-on-year EPS for the S&P 500 fell in the first two quarters of 2023 from 2022.
In macro terms, to put valuations in perspective, the individual market capitalisations of both Apple and Microsoft exceed the total market capitalisation of the Canadian stock market.
The capitalisation of the Magnificent Seven approximately equals the combined capitalisations of the Japanese, UK and Canadian stock markets.
ETF influence overwhelming
The influence of exchange-traded funds (ETFs) on the surging US equities and bond markets in November and December should not be underestimated. Morningstar research revealed in November “investors piled a whopping $110 bn of new money into ETFs.” Equity ETFs attracted US$77bn (70%) and fixed interest US$30.7bn (28%).
“After a year of touch-and-go flows, ETFs are suddenly poised to blow past the US$500 billion annual inflow threshold that looked well out of reach just a month ago.” In the 11 months to November, inflows totalled US$477 billion, with equity’s share an estimated US$280bn (59%) and fixed interest US$184bn (39%).
In the week ended 15 December, an unprecedented amount of cash flowed into the world’s largest and oldest ETF, as stocks rallied to near-record levels after the Fed indicated rate cuts in 2024. State Street’s US$478bn SPDR S&P 500 ETF (ticker SPY) attracted US$20.8bn on Friday 15 December alone. It was the biggest one-day inflow since the fund’s inception in 1993 and according to Bloomberg Intelligence, the largest one-day inflow for any ETF. For the week the inflow was US$24bn, also a record. (Exhibit 5)
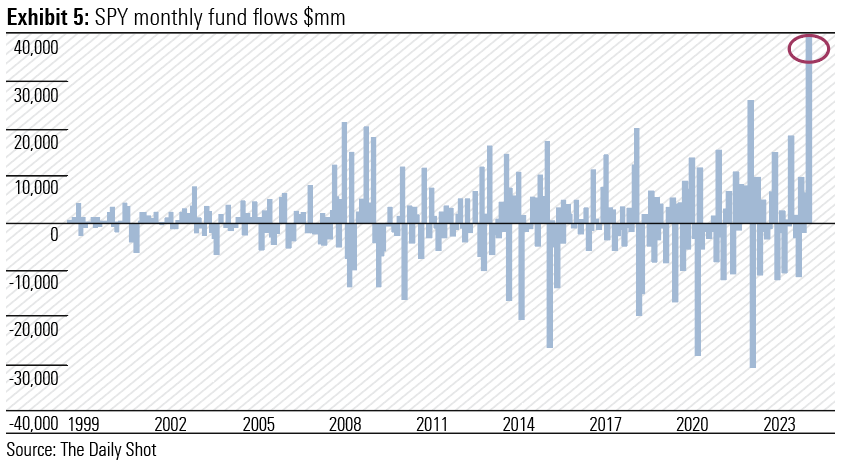
Matthew Bartolini, Managing Director of State Street Global Advisors and Head of SPDR Americas Research said “the flow we saw on Friday was 100% organic from clients, and investors and traders. It also reflects the Santa Claus rally that we have seen in the last few days – so momentum-trading going into the SPY as well.”
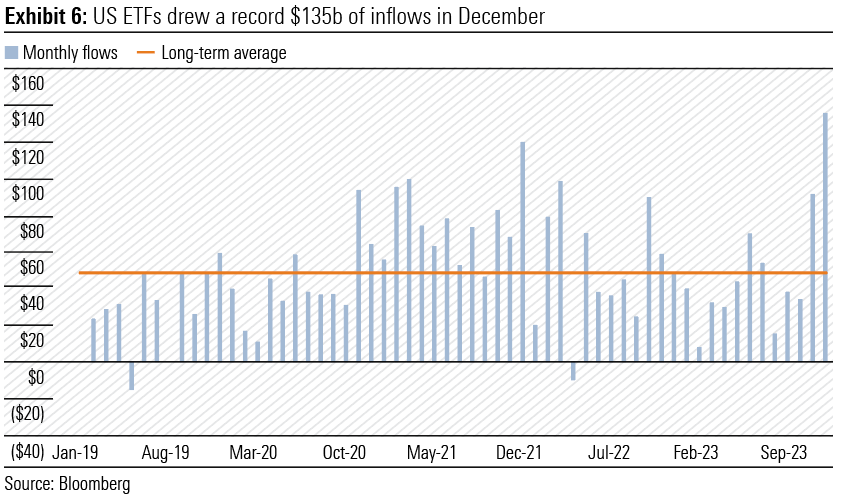
The totals for 2023 are now in. US ETFs attracted a record US$135bn in December (Exhibit 6), closing out 2023 with US$598bn of inflows. Equity ETF inflows were a record US$110bn, with a new monthly peak for US equity ETFs, driven by a record US$15bn into US small caps. The December quarter total was US$263bn. The 2023 total inflows were well short of the record US$903bn in 2021, which included US$670bn in equity ETFs.
Remember most ETF transactions are value agnostic.
The average 2024 closing target for the S&P 500 from 20 leading US forecasters is 4,832, with a range between 4,200 (JP Morgan) to 5,200 (Fundstrat Global Advisors and Oppenheimer). From the 2023 close of 4,770, the average target for 2024 is 1.3% higher.
The sharp rally in the US bond market, which saw yields across the 5-year to 30-year section of the yield curve tumble by over 100-basis points in eight weeks from late October, was also assisted by ETF purchases and meaningful short covering. (Exhibit 7) In November, net flows into fixed interest ETFs amounted to some US$31bn . A further US$24bn in December pushed the 2023 total to US$230bn, the second highest on record.
Bond bulls are cheering any sliver of negative news or economic data given inflationary pressures continue to ease although the central bank targets within the 2%-3% range still require vigilance and attention. Strangely, they may prefer a hard landing, although that may trigger added fiscal stimulus and further increase bond issuance. Confusion and uncertainty reign.
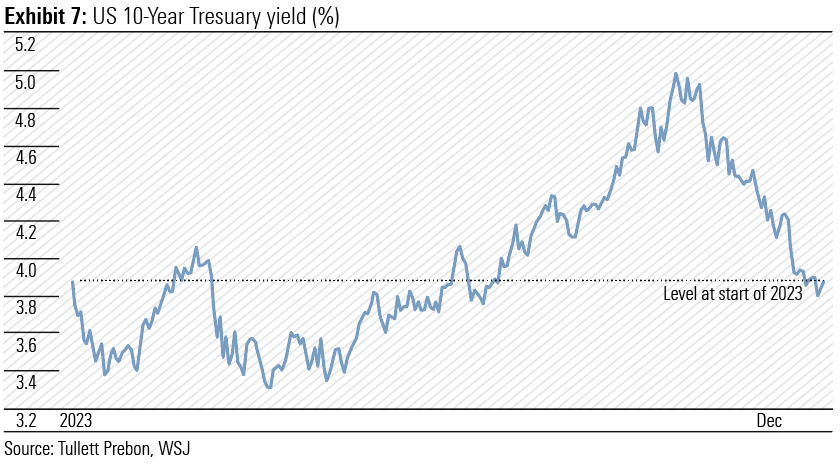
Following a better-than-expected headline number in the December jobs report, which saw both bonds and stocks initially sold off initially, the conclusion was “Scratch the surface and you’ll get a recession itch.” The 10-year Treasury yield has moved back over 4.00% to 4.05% (touched 4.07% intraday) from 3.79% on 27 December.
I just don’t see investors being attracted to bonds with a real yield well below 2% in the future. They have put up with negative yields for too long and a return to long-term historical averages is now likely. Recall, the Fed’s quantitative easing bond purchases of US$3.5 trillion between 2020 and 2022 were made at real yields between -3% and -6%. That is the prerogative of central banks, not investors.
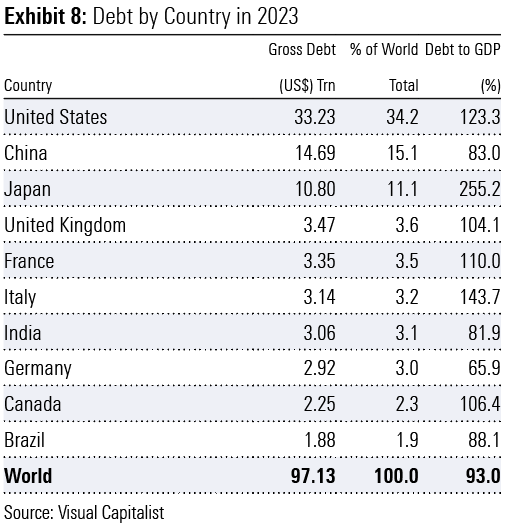
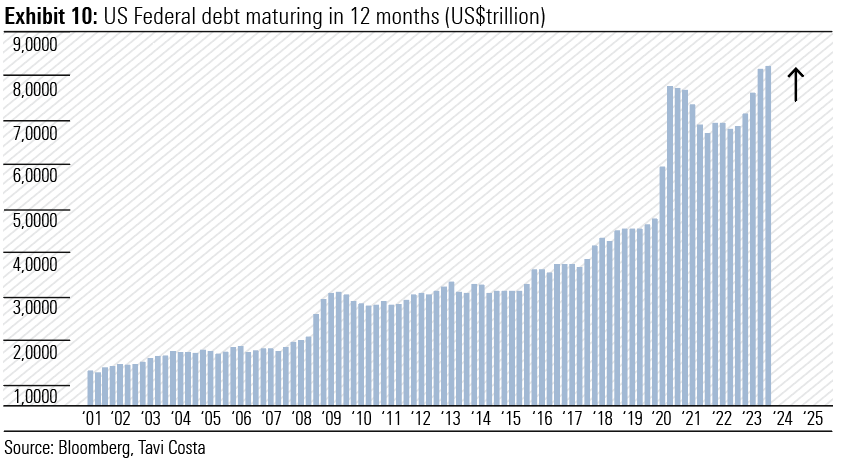
Government debt and its servicing
Government debt of developed world countries smashed records in 2023, with the US leading the way. (Exhibit 8)
The market’s focus on Jerome Powell and the Fed is overwhelming while Janet Yellen and the US Treasury’s record bond issuance and liberal fiscal policies pass under the radar. With a presidential election in November, reining in of government spending is unlikely in 2024. (Exhibit 9)
Apollo Global Management’s chief economist Torsten Slok succinctly sums up the situation. “There’s a tug of war between the Fed at one end of the rope and the supply of Treasurys at the other end. The market needs to take the bond supply more seriously, and in my view, it will be paying more attention to Treasury auctions than ever before.” (Exhibit 10)
While the rise in term premia, which sent the 10-year US Treasury yield to over 5.0% in late October, was seen as assisting the Fed in keeping financial conditions tight without a further lift in the federal funds rate, the subsequent slide to 3.8% is having the opposite effect. Dallas Fed president Lorie Logan was one of the first Fed policymakers to suggest higher bond yields were doing some of the Fed’s work.
With commercial banks tightening credit policies and credit card and auto loan delinquencies on the rise, Logan has indicated it could be time for the Fed to ease the pace of shrinking its balance sheet. Recall, the Fed is already well behind the planned monthly rate of quantitative tightening of US$95bn effective 1 September 2022.
Australia – Can’t wait for September
Pleasingly, November’s Monthly CPI Indicator showed the annual headline inflation rate slowing from 5.6% in September and 4.9% in October to 4.3%. This was below consensus expectations of 4.4%. The Reserve Bank’s (RBA) favoured trimmed mean fell more sharply from 5.3% in October to 4.6%, but still sits near twice the midpoint of the longer-term target of 2%-3%.
While the trend is comforting, the internals are a little more disconcerting. The November reading includes up-to-date price information for 76% of the weight of the quarterly CPI. Consequently, the December quarter CPI, to be released on 31 January, will be more meaningful and will be released just prior to the RBA’s first monetary policy meeting for 2024 on 6 February. It is likely the December quarter trimmed mean will come in below the RBA’s November Statement of Monetary Policy forecast of 1.0%.
Closer examination of the November release reveals increases of the more critical non-discretionary cost-of-living categories are equal to or above the headline (4.3%) and trimmed mean (4.6%) readings. These include Food and non-alcoholic beverages (+4.6%); Housing (+6.6%) – including rent (+7.1%), electricity (+10.7%), Gas and other household fuels (+12.9%); Health (+5.2%); Education (+4.8%); and Insurance and financial services (+8.8%).
Disinflationary pressures were evident in discretionary categories, including Furnishings, household equipment (-0.3%); Clothing and footwear (-0.9%); and Holiday travel and accommodation (-0.3%). The 13% fall in Brent crude prices in October and November saw automotive fuel prices increase just 2.3% on November 2022, well below the 8.6% in October and 19.7% in September. This dampened the Transport segment rise to 3.6% year-on-year from 5.9% in October and 9.4% in September.
Given the quarterly CPI-linked increases in road tolls, the biannual increase in excise on tobacco, alcohol and transport fuel and the stickiness of non-discretionary inflation in both goods and services, household budgets will continue to be stretched and real disposable income will shrink despite wages growing at 4% over the past year. The savings buffer boosted by the fiscal stimulus packages of 2020 and 2021 has been spent with the household savings rate falling to 1.1% in the September quarter. While immigration will support aggregate household consumption, the per capita standard of living will continue to decline through 2024.
A tight labour market remains supportive of household incomes and despite a 0.7% decline in job vacancies in the quarter ended November, vacancies are still 68.6% above pre-pandemic levels. The surge in immigration over the past year should see vacancies continue to fall as newcomers are absorbed into a slowing economy.
Cost-of-living pressures are likely to persist for most of 2024 as The Australian Financial Review’s headline of 2 January 2024 trumpeted “RBA set for September cash rate cut”. While the pace of inflation eases, households must deal with overall price increases of near 20% over the past two years, effectively a meaningful salary cut. Prices are unlikely to decline. And while Stage 3 tax cuts from 1 July will help, it won’t be until mortgage payments start falling that the pressure will ease on households. Unfortunately, there will be many Australian households singing Pyramid’s 1970 hit “Can’t Wait for September.”
Government subsidies on electricity, rent, childcare, renewables, electric vehicles, and road toll caps will ultimately need to be trimmed adding to eventual increased calls on household finances.
Observations
- BHP is committed to achieving net zero emissions. “Our operational greenhouse gas (GHG) emission reduction strategy continues to prioritise structural abatement in areas that are technically and commercially feasible, while working in collaboration with our suppliers, partners, and peers on accelerating the development of other potential decarbonisation technologies. Our medium-term target is to reduce operational GHG emissions by at least 30 per cent from FY2020 levels by FY2030, and our long-term goal is to achieve net zero operational GHG emissions by 2050.” In major transactions BHP has divested its petroleum interests to Woodside Energy and the metallurgical coal operations in Queensland’s Bowen Basin to Whitehaven Coal. Whitehaven “will assume economic and operating control of the Daunia and Blackwater mines on completion of the sale, including all current and future environmental liabilities and rehabilitation obligations.” Is this BHP’s way to net zero?
- As far back as I can remember, Treasury’s iron ore price forecast has been conservative with a capital C. The forecast for the year to June 2024 is US$70 per tonne (62%Fe). The current price is near US$140 and in the financial year to date has not been below US$100 per tonne. The late Julius Sumner Miller would have asked “Why is it so?” Canberra spies suggest the conservative forecast provides a meaningful buffer in the budget for the government to use to reduce debt. However, since the Howard/Costello era the buffer has either been squandered or swallowed by events like the GFC and COVID requiring unforeseen fiscal stimulus.
The $130 Billion SuperFund Manager also talks about how he sees risk, his recent investments, and why history isn’t a good guide to the future.
Founder and CIO Ned Bell gives an insight into how the Morningstar medalist fund manager uncovers growing but sustainable businesses and shares some stocks picks in the portfolio.
Australia’s compulsory superannuation regime has provided fertile ground for startup investment management firms over the last 30 years. With the passage of time, we now have a substantial track record for which to assess the success of the boutique investment firm model versus the large, diversified asset-management model.
In this paper we review those managers in our database that have offered a broad-based Australian equity fund for a minimum of 15 years. For consistency, we have chosen only broad-based strategies in our sample, as there is a limited cohort of concentrated strategies with a 15-year track record. Further, we have only included fundamental strategies (rather than quantitative and passive) that are currently analyst-rated by the Manager Research team.
We have provided some broad background comments on each of the managers included in this analysis and classified them as either a boutique or a diversified fund manager. We have classified overseas-owned or domiciled managers as diversified, however, if a fund manager began as majority employee-owned, we have included them in the boutique category.
When looking over the very long term, survivorship bias inevitably comes into play. A number of very high-profile Australian equities boutiques have come and gone (such as 452 Capital and Integrity Asset Management to name but two). The Australian equities strategies offered by the large, diversified asset managers aren’t necessarily assured of survival either. We have seen overseas heavyweights ING and Aberdeen (abrdn), for example, exit the domestic investment management market in the last 15 years, while BlackRock moved management of its High Conviction Australian Equity Fund to Pendal in the first quarter of 2023. And others such as Credit Suisse no longer exist. Notable as well is domestic behemoth AMP no longer has an inhouse asset-management division, something that would have shocked the market if known 15 years ago. The one thing that is constant is that there is always change, and managing funds in the competitive Australian market is not easy.
There are other funds that have a long pedigree that have not been included, such as Maple-Brown Abbott, and this is because it does not have a broad-based Australian equity fund that has a minimum 15-year performance track record on our database, as it has been solely institutionally focused in its earlier years.
The managers offering Australian equities that have survived, and indeed thrived, over the long term are:
Diversified Fund Managers:
- Allan Gray
- Fidelity
- First Sentier (formerly Colonial First State)
- Lazard
- Pendal (now owned by Perpetual)
- Perpetual
- Schroders
- Tyndall
Boutique:
- Ausbil
- Alphinity
- Greencape
- Hyperion
- Investors Mutual
- Solaris
We have examined the history of each of these managers to assess changes through time. We have also made observations about culture and longevity to determine whether there are any durable advantages held by the boutique model over diversified, or vice versa. The managers outlined are all of a high caliber. There are several others we could have chosen if a shorter time period was used.
The Diversified Fund Managers
Allan Gray
Allan Gray started in Australia in 2005. Now owned 49% by the Allan & Gill Gray Foundation, Gray founded the Orbis Group in South Africia in 1973. This fund was originally managed by Simon Marais, who passed away in 2015. His estate holds a 34% interest with current and former senior staff holding a 17% interest. Currently managing 65% of the portfolio is CIO Simon Mawhinney with Suhas Nayak managing the remaining 35%. Mawhinney was previously a co-portfolio manager with Marais. Like its founder, the manager is known as a long-term contrarian investor, having a value and mid-cap bias by our measures. The manager has a solid, although at times volatile long-term track record, due to its contrarian approach, hence patience is required.
Fidelity
Fidelity International is mainly owned by management and members of the Johnson family, who founded U.S.-based Fidelity Investments, a behemoth in the investment world. Paul Taylor has headed up Fidelity Australian Equity Fund since 2003. While there have been staff turnover in the more junior ranks, Taylor has been a constant for this strategy.
First Sentier
First Sentier was formerly known as Colonial First State, and the funds management arm was renamed as Colonial First State Global Asset Management, or CFSGAM. Along with the old BT and Perpetual, it was one of the giants in domestic funds management 20 years ago. Bought by Commonwealth Bank in 2000, CBA announced the sale of CFSGAM in late 2018 to Mitsubishi UFJ Trust and Banking, or MUTB, and it was finalized in August 2019. The current Head of Equities, Dushko Bajic, has managed this portfolio since February 2014. Bajic was previously at Orion Asset Management, headed by Tim Ryan, a boutique that no longer exists.
Lazard
Lazard’s portfolio management team is long on experience. Originally from Tyndall and joining Lazard in 1999, Rob Osborn, Philipp Hofflin, and Aaron Binsted are still portfolio managers. Tim Zhao joined the portfolio management team in 2010 while Warryn Robertson and Philippe Tison, who were there when the fund started, both stepped down in 2017. Robertson is still an analyst on the team. A contrarian value manager, like Allan Gray, Lazard has shown the benefits of a long-term, patient approach.
Pendal
Pendal was formed from the three-way merger in the early 2000s of Westpac Investment Management, Rothschild & Co Asset Management, and BT Funds Management. Previously owned by Westpac, it was spun out onto the ASX, changed its name to Pendal, and was subject to a successful takeover by Perpetual that was finalized in early 2023. Soon after the merger in the early 2000s, Crispin Murray was made head of Australin equities. With a background in European equities for BT, he and his team have laid down a path of success. Pendal, unlike its new owner, Perpetual, has enjoyed a long-term and stable head of equity leadership.
Perpetual
Perpetual could be considered, for want of a better term, the “father” of the Australian funds management scene. The iconic industrial share fund, as a strategy, has a recorded history of more than 50 years. Perpetual also has a history of reinvention and a continuing well-executed succession strategy. There have been many flagbearers over its history, however, the organization has been able to keep producing well-seasoned leaders almost like clockwork. Current portfolio manager and head of equities Vince Pezzullo joined in 2007 and started managing the Australian Shares Fund in 2016. With the departure of Paul Skamvougeras in December 2022, Pezzullo became head of equites (after a 15-year apprenticeship). Skamvougeras himself had been head of equities for close to 10 years, and before that Matt Williams (now at Airlie) and John Sevior (who set up Airlie and is now retired) had the role. Perpetual has shown an ability to retain experience and promote from within, although there has been a notable turnover of heads of equity compared with many other successful competitors. One could go further back to previous heads of equity with Peter Morgan (who set up up 452 Capital in 2005 with Warwick Negus), John Murray (one of the founders at Perennial), and Anton Tagliaferro (who set up Investors Mutual in 1998).
Schroders
Schroders is a listed U.K. fund management group, although it still has a large percentage of family ownership and a 200-year pedigree. Head of Equities Martin Conlon has been managing the fund since 2003, while fellow portfolio manager and Deputy Head of Equities Andrew Fleming joined in 2007. While the team has experienced some turnover, the two leaders have clearly been very stable.
Tyndall
Tyndall has had a number of owners over the years. In 1999 it was acquired by U.K. insurer Royal & Sun Alliance. The Australian assets were divided and became Promina in 2003. Promina merged with Suncorp in 2007. In 2010 Suncorp sold the business to Nikko and changed the name to Nikko. Yarra Capital Management bought Nikko’s domestic funds management business in 2021, and the Australian equity team was returned to being branded Tyndall. That is a lot of corporate activity. Tyndall’s highconviction value portfolio, the Tyndall Australian Share Fund, is another with a long-term track record. After the departure of Rob Osborn and others to Lazard, Bob Van Munster took charge. Over time Brad Potter joined him and took on a portfolio management role, starting with a 20% sleeve, and they became comanagers in 2011. Van Munster retired in 2014 with Brad Potter taking over as head of equities. Jason Kim took over Van Munster’s sleeve.
The Boutique Fund Managers
Alphinity
While Alphinity does not have 15 years of experience as a stand-alone boutique, we included this as the fund in the table in Exhibit 1. Alphinity Australian Share was originally a Challenger Fund. On July 5, 2010, Challenger announced that it was spinning off its Australian equities business into a newly formed boutique to be called Alphinity Investment Management. There was a major catch: former Head of Equities at Challenger, Peter Greentree, and his team were no longer involved. Alphinity was set up with four members from AllianceBernstein’s Australian Equity team: Johan Calberg, Andrew Martin, Stephane Andre, and Bruce Smith. Alphinity is classified as a boutique fund manager because the majority of the firm is owned by staff. However, like many boutiques, an institution is involved, and the Challenger-owned Fidante holds a 30% stake; in return it provides back-office and distribution support. Alphinity hired Stuart Welch in 2017 and promoted him to portfolio manager in 2019. In late 2022, the fund advised the departure of Johan Calberg, who is retiring in early 2024. Alphinity is now entering the period where there is a slow changing of the guard. Presently the four founders own 70% of the business, but this will change over time, as two staff are on an incentive share program and Calberg will slowly wind down his ownership under a format set out in the shareholders’ agreement. Alphinity illustrates the flexibility required to adjust to the changes when a founder leaves and the next generation begin to take on senior roles.
Ausbil
Started by Paul Xiradis and others in 1997, Ausbil entered into a joint venture with Luxembourg-based Dexia Asset Management, becoming Ausbil Dexia. Senior staff included Adam Dixon and John Grace, both of whom were holding equity. Ausbil’s major shareholder Dexia, now Candriam Investors Group, was acquired by New York Life Investment Management in early 2014, with senior employees retaining equity in the business. Xiradis is now executive chairman and John Grace remains on the portfolio construction committee (and a portfolio manager), showing a consistency and longevity that is matched by few domestically.
Greencape
The key staff at boutiques all need to start somewhere, and 15 years ago it generally was at an institution—that is the origin of Greencape. It is led by co-founders David Pace and Matthew Ryland, who both worked at Merrill Lynch (whose asset management arm was bought by BlackRock). Greencape was formed in August 2006, and the duo have remained at the boutique since then. Pace manages the high conviction and leaders’ strategies, and Ryland manages the broad-cap strategy (the one we are featuring in this article). Greencape also has an eye on the future with two co-portfolio managers, Jonathan Koh, also ex-Merrill Lynch (he joined in 2012), and Ryan Green, who was promoted to co-portfolio manager in 2020. Like Alphinity, Fidante owns a minority stake, holding 45% in Greencape.
Hyperion
Hyperion’s founders originated from stockbroker Wilson HTM in Brisbane. The firm was founded in 1996, although the investment team began in 1994 under Manny Pohl. Like Perpetual, it has managed succession well to date. Pohl departed in 2012, current Chief Investment Officer Mark Arnold joined in 1996, became CIO in 2007 and then took over the managing director role in 2019 when Tim Samway, also a founding partner, moved from managing director to the role of chairman. Like Greencape, there is an underlying minority holding by a specialist institution; in this case it is Pinnacle Investment Management. Pinnacle and Fidante are similar in that they own minority stakes in investment managers and provide back-office and distribution services. As noted, Hyperion has shown both longevity and the ability to nurture the next generation of investors.
Investors Mutual
Set up by Anton Tagliaferro in 1998, the firm has a long track record as a boutique. Tagliaferro came from notable institutions, including Perpetual among others, and he has an enviable record. While there has been staff turnover over the years, Tagliaferro has been a constant until his retirement in 2023. However, ownership of the business has changed. Though formerly wholly owned by Tagliaferro, there have been many personnel changes over time. Several senior investment staff, including Head of Research and Lead Portfolio Manager Hugh Giddy, are minority investors. Most of the firm is now majority owned by Paris-based Natixis Investment Managers. Tagliaferro sold his shares to Natixis over a period of time, resulting in Natixis owning approximately 75% and senior investment staff the rest. This is an interesting situation where an investor has left an institution, set up a boutique, and ended up to selling the majority of his stake to an institution. Investors Mutual has gone from a boutique to an institution. For the purposes of this paper, we have considered it a boutique. It also begs the question: When setting up the boutique, who really benefits—the clients, the founder, the staff, or the clients?
Solaris
Solaris was founded in 2008, and like Hyperion, is in Brisbane and has Pinnacle as a minority owner. The founding members were previously at Suncorp, and many have worked together since 2002. With 55.5% owned by staff, the remaining 44.5% of the company is owned by Pinnacle, who provides distribution support. Back-office support is provided by Channel Capital, which was spun out of Solaris in 2013. While the founders have remained relatively stable, the former managing director Denis Donohue retired in 2013. In 2022, Sean Martin stepped back into a part-time role due to health issues, and he formally retired in late 2023. The core of the team has been stable, pointing to a settled environment.
Performance
The table in Exhibit 1 below, are the funds that are in our database, are analyst rated, have a rating of Bonze or higher, and have at least 15 years of performance. We have only included one fund per manager, which is generally the fund that is a broad-based Australian equity strategy and has the longest track record in our database.
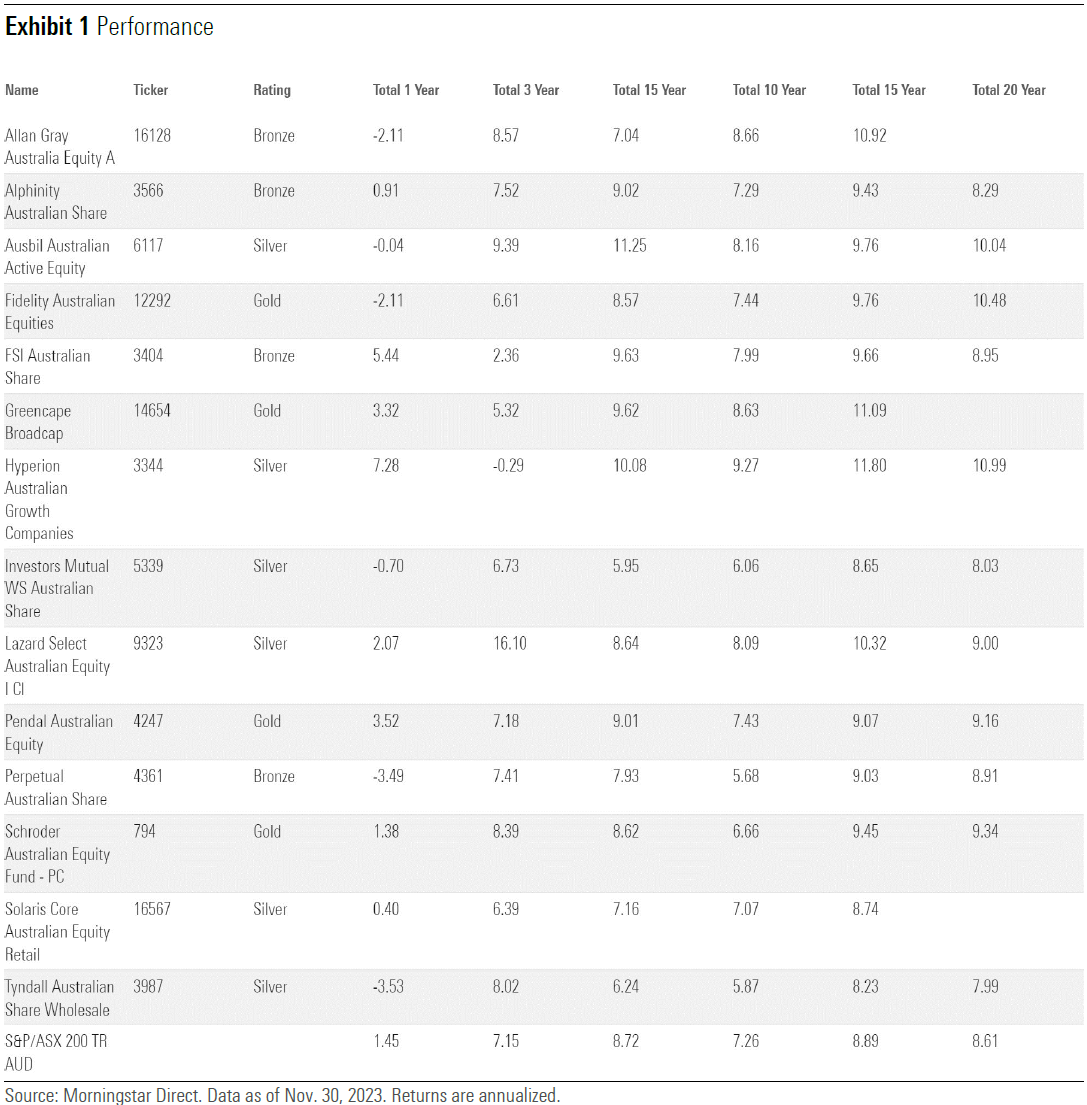
While no manager has outperformed over all time periods, these funds have generally shown a long and consistent track record of performance, which points to a rare ability in these managers in being able to outperform. All have been through performance dips, but the consistency of outperformance of several of these managers is noteworthy. The table in Exhibit 1 highlights 14 managers who have a surviving broad-based Australian equities fund. Of these 14 funds, 11 have outperformed the S&P/ASX 200 benchmark over the 15-year period that ended Nov. 30, 2023. Only Investors Mutual, Solaris, and Tyndall have underperformed, which is a 78.6% success rate.
Conclusions
Reflecting on active fund managers over a minimum 15-year period raises some interesting points:
- There are fewer boutique managers than many would likely have predicted 15 years ago. This is due to a number of reasons: We looked at a 15-year fund performance time period; we only looked at managers that offered a broad-based Australian equity fund; and many diversified fund manager responded to the new environment by changing their renumeration structures when a number of boutiques were being formed and their staff appeared liable to leave. × Survivorship bias is a big factor. There are many fund managers that didn’t make it. The following list are some of those that have merged, changed names, been taken over, or closed. At the very least these names no longer offer an internally managed Australian equities fund: 452 Capital, Aberdeen (abrdn), ABN AMRO, AMP, Arnhem, AXA, Balanced Equities, BT Funds Management, Cannae Capital, Challenger, Concord (an institutionally focused manager), Credit Suisse, Deutsche, ING, Integrity, Merrill Lynch, MIR, Orion, Portfolio Partners, Rothschild, UBS, and Westpac. These managers are a mix of boutique and diversified fund managers.
- As noted above, the self-owned structure is not the “answer” for the ideal structure of a fund management business, as it can be seen as introducing a lot of complications that are a double-edged sword. Having ownership of the business and a narrow product focus can make for a business that is highly reliant on one or two key people, and/or one or two large superannuation funds for success. This makes a fund vulnerable to changing their strategy, which results in the boutique managers searching for more capital or perhaps staff looking for new jobs. There are further complications if a founder wants to retire or experiences medical issues, both of which can be a significant distraction to the rest of the team and the viability of the business.
- The wave of new fund management boutiques being set up led to diversified fund managers examining their business structures. Diversified fund managers realized that their key assets (that is, their people) needed to be rewarded similarly to boutique managers in order for them to stay and to reduce the incentive for talented investors to leave. This has resulted in the introduction of revenue share, shadow equity, and profit share arrangements. As noted with the long-term tenure of several investors at diversified fund managers, these arrangements have been successful to date.
- The changing institutional superannuation landscape has also left a mark when AustralianSuper cut the number of active managers they appointed. More than 10 years ago this reduced (but did not eliminate) the attraction for new boutiques to set up. It also showed that diversified fund managers had pressures on their business models as well.
- The recent introduction of the Your Future Your Super, or YFYS, benchmark test, together with the ongoing quest for lower fees and the creation of internal teams to manage the shares of Australian portfolios, is a further reduction in the appetite for new boutiques in mainstream Australian equities. Diversified fund managers are not immune to these pressures either. Both boutiques and diversified fund managers have realized that the retail/wholesale channel is becoming more vital to their ongoing viability.
- To be able to outperform over 15 years, these managers clearly must be doing something right. However, there is no template, as we have a mix of boutique and diversified managers, such as Taylor (Fidelity), Murray (Pendal), Conlon (Schroders), and Xiradis (Ausbil) have been portfolio managers and heads of equity for more than 15 years, while others have not. We would say that investment culture comes in different structures and flavors but the ability to outperform relies on talented staff and a repeatable process, which all these managers have demonstrated.
- To survive, all these organisations, even those that have the same lead portfolio managers, need to nurture talent and have a supportive owner (whether boutique or diversified). Many boutiques have a minority shareholder (that is, Pinnacle or Fidante) that provides varying levels of distribution and administrative support. In reviewing fund managers, we discovered some of the important characteristics that enables them to succeed include: × Positive culture – A team and an organization that can work through challenges and manage through difficult times (usually occurs during outflows and periods of underperformance; these often occur together).
- Strong leadership – In fund management an individual usually needs to make decisions, and in managing portfolios those who are successful have a legacy of making consistently good decisions.
- Teamwork – While funds can have a star portfolio manager, for long-term success teamwork is required to be able to consistently uncover good money-making ideas for the portfolio.
- Alignment – Organizations that work well are usually aligned and have a reduced level of conflict. Staff know what is expected and work together for a common goal.
- Grow your people – Boutiques like diversified managers need to grow their people. Hiring externally is a solution, but long-term success is evident in organizations that can hire well and grow them into leadership roles.
- Stability/long tenure – It is often a positive re-enforcement of culture and helps breed success when turnover is low and staff have a long tenure.
While the above list is not exhaustive, we find that many of the fund managers that exhibit these characteristics are in this list of managers that have more than 15 years of performance. We look forward to the next 15 years.
The base case and economic reality
The swing factors that will influence your investments
- Geopolitics has become a greater swing factor in the past few years with the return of military conflict in eastern Europe and the Middle East. We’ve also seen more abrasive relations between China and the U.S. and upcoming elections may result in large policy shifts. These conflicts have already impacted prices, with potential knock-on effects on commodity prices including critical energy supplies. We must also weigh the economic effects of an ongoing rise in military spending in Europe, Asia and the U.S.
- Natural events impacting our physical environment and health have the potential to impact growth and inflation depending on their severity and the subsequent government responses. Extreme weather impacted energy demand in 2021 with shortfalls in solar and wind in North Asia causing higher demand and prices for gas. The pandemic had tragic health impacts and ongoing constraints on supply that impacted the economy in China from 2020 to 2022.
- Our third swing factor is the adoption of technological innovation. Only when the breakthrough discoveries of the past like the printing press, steam engines, electricity and computing were applied at scale did they enhance productivity, increase growth and ease inflationary pressures. The faster artificial intelligence is applied, the faster the effects will be felt. We are at the point now where application is expected to ramp up.
Economic challenges appear to be priced into the market
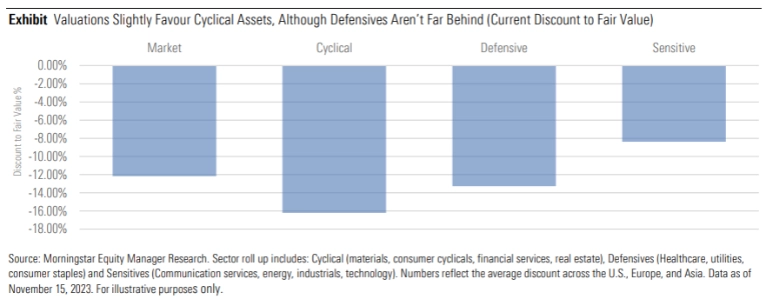
If you’ve ever purchased a plane ticket, you’ve probably stumbled across (or, more likely, clicked past) a carbon offset. Carbon offsets are commitments from a third-party platform to invest in a project that counteracts the burden on the planet of what you’re about to buy. Offsets achieve this by funneling the proceeds from the purchase into renewable energy sources like wind farms or land-use projects like planting trees.
Carbon offsets often get conflated with another instrument that shares a similar name: carbon credits. Both are the subject of increasing interest from investment firms. For example, Pimco features a small allocation to carbon credits in its Pimco Commodity Real Return PCRIX, and KraneShares offers KraneShares Global Carbon Offset ETF KSET. Both funds argue that investments in carbon may allow ordinary investors to benefit financially from decarbonization efforts. Even so, carbon credits and carbon offsets are fundamentally different, with implications for investors seeking to understand how these instruments work in practice.
It starts with the philosophical problems that each security is trying to tackle. Carbon offsets are designed to help consumers counteract the impact of expected or past emissions. Carbon credits, meanwhile, make it more expensive for companies in regulated industries to pollute by charging them per unit of carbon they emit, which has the effect of disincentivizing future emissions.
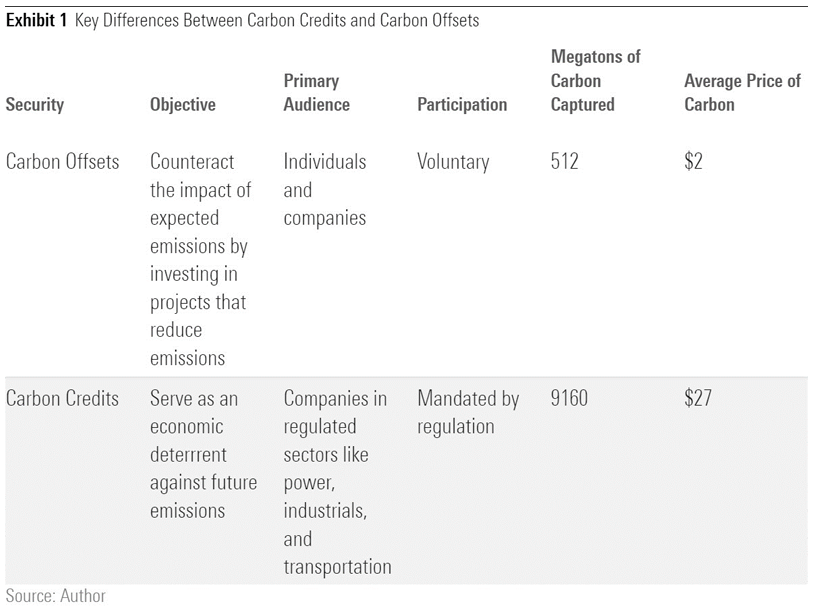
Another way to think about it is that carbon offsets are not unlike the indulgences of medieval Christianity, in the sense that people buy them in order to atone for their environmental sins. Meanwhile, carbon credits are more like a toll on an expressway: A government may actually require companies to pay in order to emit, and carbon credits are the fare they pay for the right to do so.
How Does Carbon Pricing Work?
Fundamentally, carbon offsets and carbon credits answer two different questions. Offsets serve as a proxy for how much people are willing to pay to defray the environmental cost of their activities. Meanwhile, carbon credits address the question of how much businesses are able to pay to keep operating.
Carbon offsets measure people’s (and companies’) willingness to pay for their own personal carbon footprint by pricing the cost of offsetting activities. These offsetting activities fall into two categories: avoidance, which can happen through things like stripping methane from a landfill, or removal, which generally happens through planting trees. Because offsetting activities differ depending on the program, carbon offsets themselves are heterogeneous, and prices tend to vary based on the activity they finance and the quality of the program.
Meanwhile, carbon credits track companies’ ability to pay for their operations if their emissions exceed preset limits. Because participation is required by law in most cases, the market for carbon credits is much bigger than the market for carbon offsets. This holds true in spite of the fact that offsets are more well-known. Why is this? Certain businesses have to purchase carbon credits, whereas in most cases the choice to purchase an offset is purely voluntary. Consequently, according to the World Bank, carbon credits regulate around 18% of the world’s emissions, while carbon offsets track far less than 1%.
Participation in the carbon credit markets is enforced through a special type of program called a “capand-trade” program. The cap-and-trade program mandates that businesses in specified sectors keep carbon emissions under a particular ceiling, called a “cap.” Firms that pollute less than their limit can “trade” their excess carbon on the open market. A carbon credit is the security that is created when a company opts to trade its extra carbon. The European Union has the oldest and largest market, but other places like California and China have them, too.
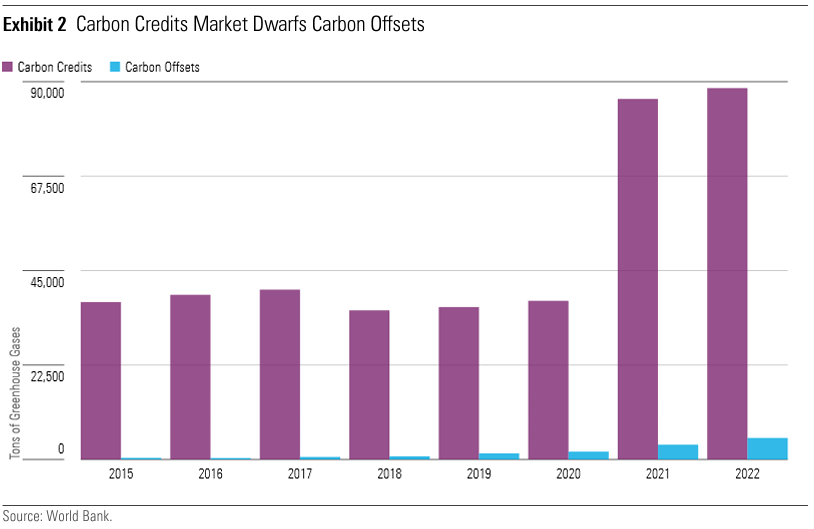
More Importantly, Does Carbon Pricing Work?
Despite the depth and sophistication of these markets, there is still a lot of daylight between what carbon pricing programs aim to do and what they can feasibly accomplish. While awareness of carbon offsets has increased in recent years, participation in carbon offsetting remains muted. The biggest audience for carbon offsets today is consumers, and for consumers other considerations like price and convenience tend to outweigh the environmental impact of the purchase they’re about to make.
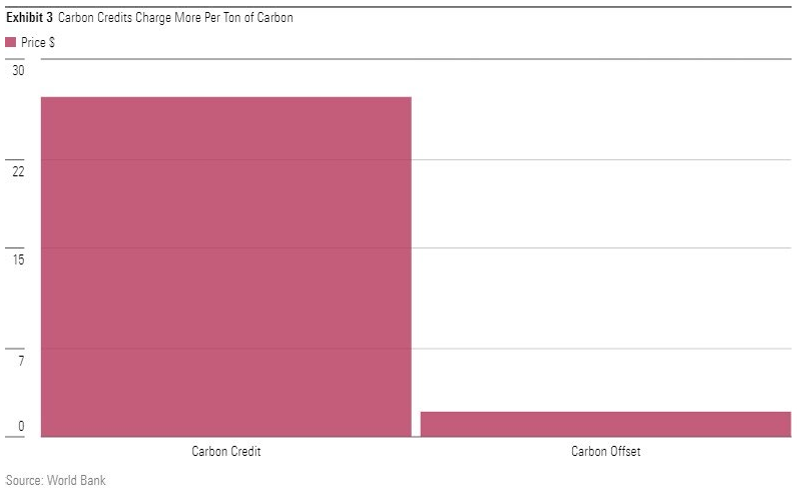
The chief issue plaguing cap-and-trade programs is that governments set the annual emissions caps a few years in advance. In doing so, regulators project how much they expect certain sectors will pollute in a given year. Our research finds that most of these covered sectors are reducing emissions faster than government forecasts, which is a good thing. But when companies beat expectations, it leads to a glut of credits on the market, and that means carbon is cheap to trade. In fact, carbon-linked securities don’t charge enough of an economic penalty to directly assist in meeting climate agreements. Economists suggest that the price of carbon needed to meet the Paris Agreement is somewhere above $50 per ton. As of 2023, no carbon offsets command a premium that high, and just four carbon credits across the 36 markets that we cover cost more than that.
What Are the Takeaways for Investors?
Although they are very different, what carbon credits and offsets do have in common is that neither carbon offsets nor carbon credits charge a price that could be considered punitive, and there’s no guarantee that they ever will. Proponents of an allocation to carbon-linked securities argue that carbon securities are a “sure thing” because, conceptually, the price of carbon has to rise in order to meet climate agreements. But this conclusion rests on the assumption that the price of carbon can rise.
For carbon offsets, that assumption can only hold true if people (and companies) have the appetite and resources to follow through on their self-imposed commitments. For carbon credits, a similar principle applies, but it’s a question of political willpower: For these programs to produce consistent price signals, governments need to set the right standard and stick to it even when it’s unpopular. Our research finds that, in most cases, regulators are a little better at it than individuals and companies, but not much. The sectors regulated under cap-and-trade programs have generally cut emissions faster than government forecasts, resulting in cheap carbon.
Carbon offsets and carbon credits obey fundamentally different principles. Importantly, carbon credits are creatures of regulation, and regulators can create a market and scale it much faster than individuals can. However, it also means that the price of carbon credits depends on the effectiveness of regulators at following through on their aims once those markets go live. Ultimately, though, investors’ success in either security depends on the outcomes of carbon markets rather than the intrinsic value of carbon itself.
Ever wondered why the Australian equities market is often referred to as the “barbell”? It is not because the market is chock full of miners forever pumping iron. Nor is it because it is constantly being lifted to new heights by our good ol’ banks, filled to the gills with housing loans squatting up the property market.
Rather, it is because no other major stock market index is so dominated by just two sectors, with financials accounting for 28.8% on the one end and materials making up 24.8% on the other (see Exhibit 1).
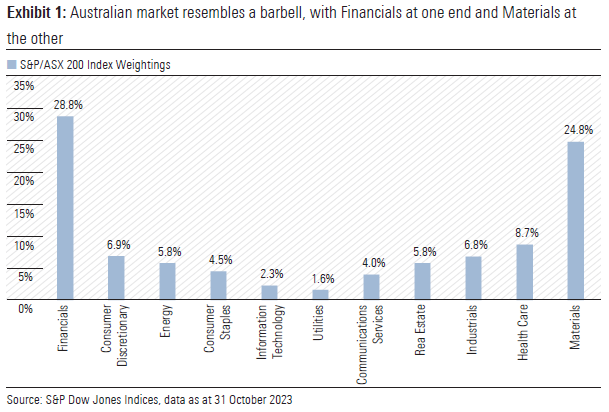
This is why, for those with an investment portfolio that is more akin to a Sportsbet gambling account, its performance bears no resemblance to the market returns reported by Australian Financial Review or Commsec evening market wraps. Come again? The ASX 200 is only down by 4% so far this year? That can’t be right. I’m down 50% over here, with a collection of spivvy cybersecurity and green energy stocks that are neither secure nor green!
More importantly, a knowledge of market compositions helps steer investors who desire particular exposures or diversifications. A fisherman would not troll for tuna in an estuary teeming with breams. So, why would an investor wanting exposure to technology stocks scavenge so hard for them in Australia where they account for only 2.3% of the market?
But guess where investors can find a petabyte of tech stocks? The US, where 28.1% of the US$38 trillion S&P 500 index value can be attributed to Information Technology companies (see Exhibit 2).
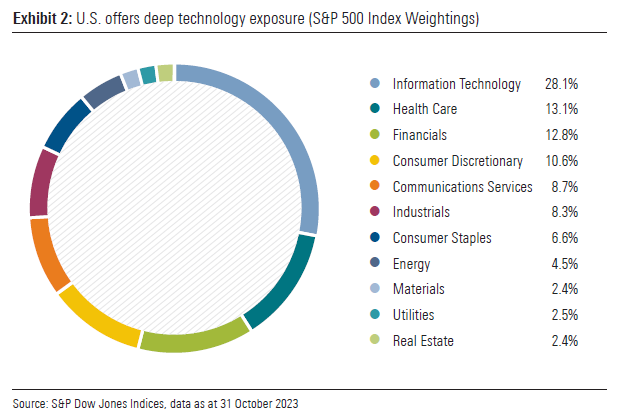
Of course, one should always keep a close eye on the price when it comes to investing. The US market is no doubt seductive in terms of the tech exposure it offers, in addition to its depth and sectoral diversification. But these attractive elements are also reflected in the US market multiple. In fact, the projected price-to-earnings multiple of US S&P 500 index is almost 40% higher than the average of other major markets (see Exhibit 3).
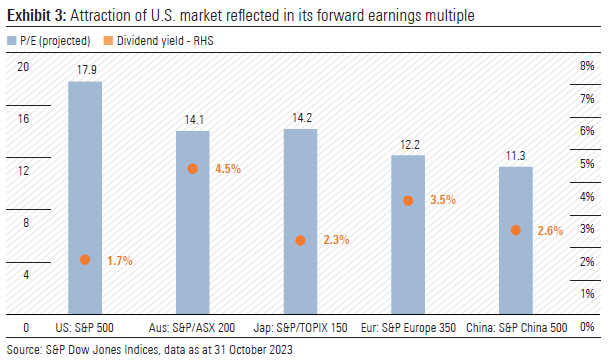
Indeed, based on the comparative multiples shown on Exhibit 3, a value-conscious investor may gravitate towards Chinese equities, with the S&P China 500 index at a price-to-earnings multiple that is 37% below the US S&P 500. The Chinese market is also more balanced, with weightings more evenly spread across industries (see Exhibit 4).
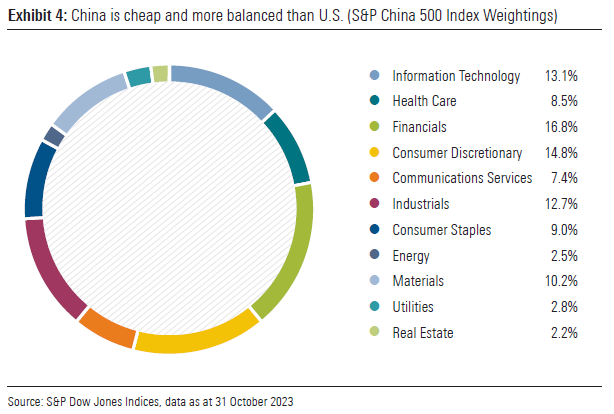
On the other hand, investing in China may not be everyone’s cuppa tea right now, no matter how balanced the index weightings. There are many reasons for this – political, economic, regulatory and whatever else the Western press seems to conjure up on a daily basis. And it does not help around 60% of the Chinese stock market value can be attributed to state owned enterprises (SOE), a three-letter acronym that gives the heebie-jeebies to many investors.
This sentiment is clearly evident in the underperformance of Chinese equities, as can be seen in Exhibit 5. Everyone wants to be a contrarian hero like Buffet and Munger. Unfortunately, not everyone is wired to be one, and the Chinese stock market’s recent relative weakness is sure to test the resolve of even the most ardent value investors.
But guess which other Asian market is staging a remarkable recovery, after the wilderness years from 1990 to 2012? Japan.
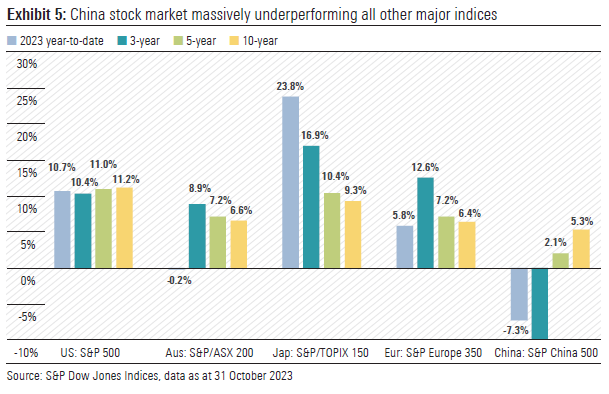
It is the Land of the Rising Sun where the sun is finally rising for stocks. As can be seen in Exhibit 5, the S&P/TOPIX 150 index is up 23.8% in 2023 to-date, continuing the recent three-year stellar performance. The five- and 10-year annualised performances are now not too shabby either, albeit we put in the usual disclaimer past performance is no indicator of future performance.
And the Japanese stock market is more “old school”, with the industrial sector (such as Mitsubishi Corp, Hitachi) and the consumer discretionary sector (think Toyota, Sony) accounting for 23.2% and 20.3% of the S&P TOPIX 150 index. It is certainly an alternative destination for investors who are reluctant to pay up for the tech glitz of the US market or the banking blitz of the Australian market.
As for Europe, the long-term performance of its stocks broadly mirrors that of Australia, as measured by the S&P Europe 350 index compared to S&P/ASX 200 index (see Exhibit 5). This is despite the vastly different composition of the European share market, with healthcare, industrials, consumer staples and discretionary sectors making up 53.3% of the market, versus just 26.9% in Australia (see Exhibit 6).
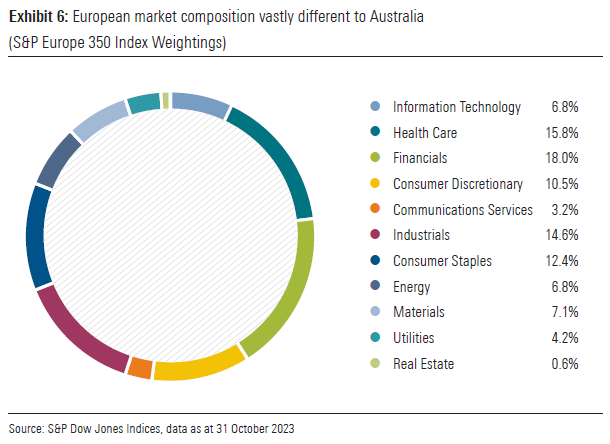
Indeed, there are investors in Australia keen on increasing their portfolio exposure to healthcare companies, driven by the thematic of ageing population, increasing wealth and growing focus on health. Unfortunately, investment choices in the healthcare sector are limited in Australia, outside of CSL, Cochlear and Resmed, as healthcare represents just 8.7% of the S&P/ASX 200 index. Turn your attention to Europe, the choices suddenly proliferate, with the healthcare sector making up 15.8% of the S&P Europe 350 index and made up of behemoths such as Novo Nordisk (diabetes, obesity), Novartis (oncology, immunology), Roche (biopharma, diagnostic), AstraZeneca (you may have heard of them during COVID vaccination craze), to name just a few.
From a top-down view, the European market also screens as cheaper than Australia, with forward price-to-earnings calculated by S&P Dow Jones as 12.2, compared to 14.1 for the Australian market (see Exhibit 3).
So, what European healthcare stocks tickle Morningstar analysts’ fancy at current prices? Come to think of it, what do we like in all the prominent sectors of each market that has been discussed in this report? The answer is contained in Exhibit 7, showing the relevant attractive shares trading at discounts to our fair value estimates.
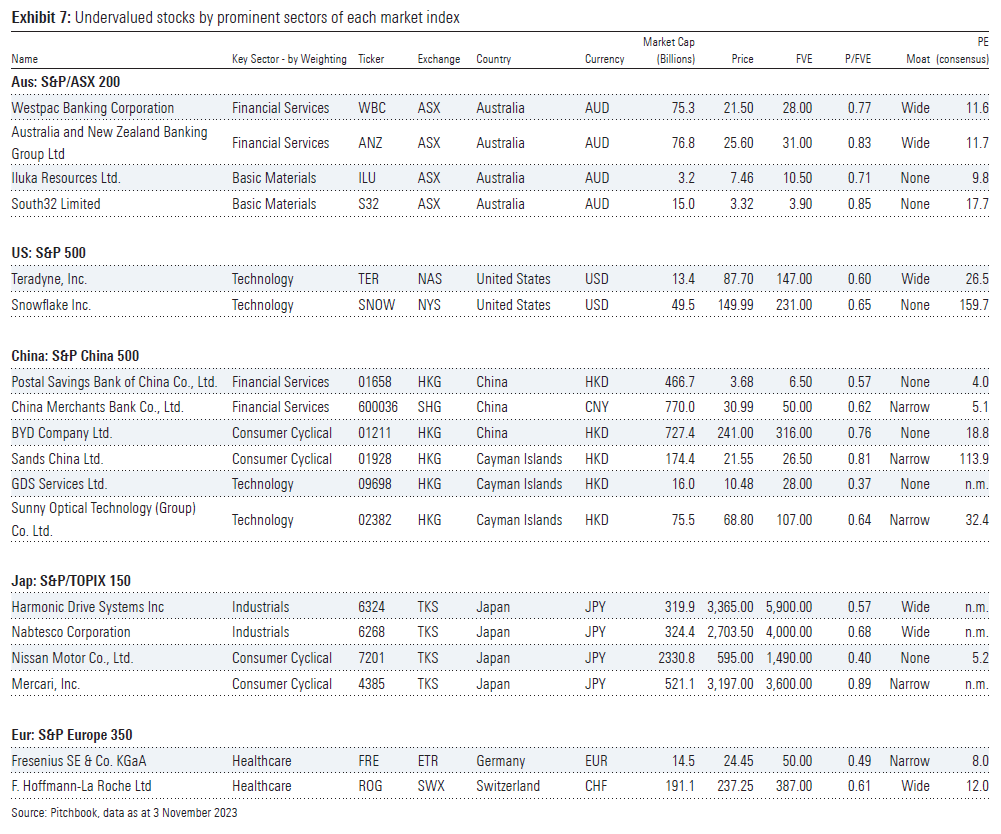
In the first instance, the list is filtered to prioritise stocks from Morningstar’s Global Best Idea List. Where we do not have such Best Ideas in the prominent sectors of each market, we have included stocks trading at the largest discounts to our analysts’ fair value estimates.
A pretty eclectic group of undervalued stocks on this list, starting with two prominent major banks on one end of S&P/ASX 200 barbell (Westpac, ANZ) and two lesser-known miners on the other end of the barbell (Iluka, South32). We have two smallish stocks for technology exposure to the US S&P 500 (Teradyne, Snowflake), not surprising given the elevated multiples of the larger-cap US tech stocks.
There is a bunch of cheap-looking stocks in China’s key sectors for those willing to traverse the wild side of emerging market investing.
Exposure to Japan’s big industrial sector is represented by Harmonic Drive Systems (gears or speed reducers) and Nabtesco (motion control technology), while Nissan (carmaker) and Mercari (second-hand good trading platform) provide exposure to Japan’s equally significant consumer discretionary/cyclical sector.
As for exposure to Europe’s sizable healthcare sector, shares in Fresenius (dialysis, injectable therapies) and Roche (biopharma, diagnostic) screen as undervalued.
However, the key message in this report is the value of knowing the index weightings of different global markets. It not only informs an investor about the key sectoral influences on each market, but serves as a roadmap on where to look to gain meaningful exposures to desired industries. Go fish where the fish are, not where you happened to set up camp.