
Morningstar once conducted research that looked at what would happen if the holdings in managed fund portfolios were frozen in time, with no further changes over the following year. The surprising conclusion? The portfolios that assumed no further adjustments tended to beat the returns of the actual portfolios, which reflected the fund managers’ trading activity. In other words, the funds would have performed better had the managers stood pat rather than trading.
Investors should take that finding to heart when they manage their own portfolios, too. While some investors swear by frequent monitoring and rebalancing tweaks, I’ll take a policy of benign neglect any old day.
There are many good reasons to be hands-off. The first gets back to the aforementioned “frozen” portfolios: Assuming you’ve taken care with your starting asset allocation and have selected high-quality investments to populate your portfolio, too frequent monkeying around could lead to worse results than sitting still. (One of the best axioms for portfolio management is “Don’t just do something–stand there!”) Trading also has the potential to jack up costs, both transaction and tax costs, which drag on returns.
Another reason to take a hands-off tack with your investments is to keep your stress level down. If you limit your check-ups to a simple annual review, you’re less likely to sweat small market movements because you won’t see them reflected in your net worth. Last and definitely not least, there may be periods in your life when you’re unwilling or unable to spend much time on your portfolio, because of time constraints or, perhaps later in life, health considerations. Crafting an ultra-low-maintenance portfolio helps ensure that nothing catastrophic would happen if you couldn’t check in with your portfolio for a year or even longer.
Of course, the gold standard for taking a hands-off approach to your portfolio while also ensuring that it’s running smoothly is to delegate your portfolio management to a high-calibre financial adviser. But if you’re a do-it-yourself investor aiming to build a “no babysitter required” portfolio, here are the key steps to take.
Step 1: Find your portfolio’s true north
The starting point for creating a low-maintenance portfolio is to give due consideration to your asset allocation. Asset allocation is process of dividing investments among different kinds of asset categories, such as stocks, bonds, real estate and cash, to optimise the risk/reward trade-off based on an investor’s specific situation and goals. That decision–more than individual stock selection–will have by far the biggest impact on how your portfolio behaves in the future.
Tactical asset allocation strategies that assume jockeying around among asset classes are automatically off the table. After all, the goal is to be hands-off. But the tricky part about asset allocation, even a strategic asset allocation approach, is that, for many situations, the “right” asset allocation is a moving target. A large equity weighting typically makes sense for the preretirement years, but you’ll probably want to transition to heavier weightings in cash and bonds as retirement–and spending from that portfolio–approaches.
To determine your asset allocation, it’s important to think through your risk capacity and risk tolerance. Risk capacity relates to how much risk you can afford to take, given your proximity to spending from your portfolio, whereas risk tolerance refers to how much volatility you can psychologically and emotionally tolerate.
In addition to thinking through your starting asset allocation, give some thought to how that asset allocation will change over time. For example, you might target a 70 per cent equity/30 per cent bond portfolio until age 55 but step down to a 60 per cent equity/40 per cent bond portfolio by age 65.
Step 2: Identify low-cost, well-diversified building blocks
Once you’ve determined your portfolio’s asset allocation, you can turn your attention to identifying the simplest possible building blocks to populate the portfolio(s).
For your long-term investments, broad “total market” index funds and exchange-traded funds are by far the lowest-maintenance choices; their portfolios are guaranteed to track a given market segment, less costs, and they won’t generally be affected by management comings and goings or by developments at the parent company.
The best aspect of “total market” products is that a single fund will provide all (or almost all) of the exposure you need to a given asset class. SPDR, iShares, Vanguard, and BetaShares all field ultra-low-cost broad-market index trackers for AU equity, international equity, and bonds.
One fork in the road is whether to obtain your total market exposure via a traditional index fund or ETF; worthy total market trackers are available in either product type.
For your cash holdings, focus on products that are low-cost, well diversified, and low maintenance: online high interest savings accounts and/or term deposits can work well in this portfolio slot.
Step 3: Document your maintenance regimen
Think of your no-babysitter portfolio as a grown child: Just because you don’t have to attend to its basic needs every day or even every quarter, you’ll still want to check in periodically to make sure everything’s OK.
If you’ve followed the steps above, a thorough annual review should be enough to keep things running smoothly. (You’ll probably want to attend to your adult kids more than that!) Such an annual check-in will be absolutely essential if you’re already retired because you’ll need to figure out how to extract cash for living expenses from your portfolio.
To help facilitate the process and, importantly, to ensure that you don’t overdo your checkups, I like the idea of using an investment policy statement that documents the basic outlines of your portfolio (your approach to asset allocation and security selection, for example), as well as how often you’ll check up on your portfolio and how you’ll do it.
If you’re retired, maintaining your portfolio will necessarily be a bit more complicated: Not only will you need to determine where you’ll go for cash to meet your living expenses, but you’ll also have to ensure that your portfolio withdrawals aren’t so rich that you risk early depletion of your portfolio. A retirement policy statement can help ensure that you’re thinking through and documenting all of these issues.
Investors want more information and further education to help them effectively use ETFs. That’s what polling data suggested at the May 2019 Morningstar Investment Conference. In the conference’s listed investments session, 62% of respondents wanted more information and education materials. Only one third of respondents believed there is adequate information available to make investment decisions and trade listed funds effectively.
That raises an eyebrow, because ETFs sometimes trade with wider than normal bid/ask spreads, or deviate substantially from their net asset value, or NAV, which can jack up the cost to investors. Reasons for this can range from market volatility, illiquid or closed underlying markets, thin market-making activity, or operational errors. We’ve seen extreme spreads and discounts in US-listed ETFs at times, and to a lesser but still substantial degree, in Australia too. Yet by being aware of a few simple rules, investors can avoid most of these issues.
It’s worthwhile revisiting the 10 rules of thumb for ETF transactions that we published in 2015. Every rule remains just as relevant in 2019, and we wouldn’t be surprised if these rules remain relevant for years to come.
1. “No Limit” is a Poker Game, Not an Investment Strategy. Consider Using Limit Orders, Not Market Orders
Market orders can be useful when time is of the essence and price is of secondary importance, or when there is plenty of liquidity. Investors using market orders want to execute their entire order as soon as possible. For large, very liquid ETFs that trade contemporaneously with their underlying securities, market orders will likely result in fast execution at a good price. But there are smaller or less liquid ETFs, and there are also ETFs that trade out of sync with their constituent securities (such as US equity ETFs where there’s no overlap between Australian and US trading hours). Limit orders help ensure favourable execution from a price perspective. A buy limit order will fetch the buyer a price less than or equal to the limit price, while a sell limit order will transact at a price greater than or equal to the limit price.
2. Avoid Trading at Open, Close, or in the Auction Period
For ASX-listed ETFs, this means at the very least, avoid trading earlier than 10.15am or later than 3.45pm. At these times, market-makers may not be watching the market as closely, and some underlying stocks may not be trading, making it more difficult for the market-maker to calculate an accurate price.
3. Check the Bid/Ask Spread
If the bid/ask spread is wide, it may indicate that something is amiss, and it might pay to delay your trade or dig further. It is also worth observing the bid/ask spread to see if it is unstable, that is, narrowing and expanding frequently. If so, it’s a sign market makers are adjusting for risk and caution may be required.
4. Be Wary When Transacting While Underlying Securities Are Not Open for Trading
ETF trading volumes should be substantially higher and bid/ask spreads will typically be lower when the underlying stocks are also trading and have transparent pricing. For example, trade Asian ETFs in the afternoon, once the Hong Kong, Singapore, and Shanghai exchanges are open. In fact, for any ETFs, spreads could well be tighter in the afternoon, due to the better price discovery available once Asian markets open.
5. Use the Available Tools
ETF providers offer tools such as the intraday NAV, or iNAV, which can help gauge whether an ETF is trading near its NAV. Although there’s no guarantee the iNAV will be an exact representation of the NAV, it’s a useful indicator. If there is one, check the iNAV before trading.
6. Check Trading Volumes and ETF Size
An ETF’s size and on-screen trading volume doesn’t tell the whole story, but it’s an important part of it. The liquidity of the underlying assets is arguably most important, because the market-maker can create or redeem ETF shares to balance supply and demand, as long as the underlying market is liquid. However, the size of an ETF and on-screen volume are worth monitoring, particularly for ETFs where the underlying assets trade outside Australian hours. For example, for global equity ETFs, the on-screen volume may be more important than ETFs that hold assets trading in local hours. As a general rule, the larger the ETF size, the less likely investors are to have problems trading it.
7. It’s Hard to Do a Bad Trade If You Don’t Trade
Ask yourself: is there anything unusual here? Is the ETF price substantially different from the previous day, or even from a few minutes ago? Is the ETF price stable while underlying markets are rising or falling? Are markets going through extraordinary volatility, has there been a distribution on the day but the price hasn’t reduced accordingly? If so, further research or patience may be required before placing a trade. That said, sometimes it’s best to trade regardless of the transaction costs, if you’ve realised that your thesis was wrong. Apply a commonsense check to make your decisions, avoid emotions, and rely on your intellect and good advice.
8. Stop-Loss Strategies May Not Stop Your Losses
Stop-loss strategies can lose more money than they save, especially during market turmoil. For example, in the 2015 volatility in the US, the market gapped downward because of a momentary lack of liquidity, which triggered stop-loss orders. Because some of these stop-losses were market orders, they were filled at any price available, and with limited liquidity at the time, which may have caused an even bigger drop in prices. Investors with stop-loss orders may have sold out at the bottom. We advise caution using stop-loss strategies, especially if they’re triggered automatically or use market orders. Price alerts can be used instead.
9. If in Doubt, Give a Shout. Contact the ETF Provider or Market-Maker If Anything Looks Odd or You’re Not Sure
The ETF provider (or for large investors, the market-maker) can answer questions about trading an ETF and explain anomalies. If in doubt, contact the ETF provider or market-maker before trading.
10. Remember – It’s All About Your Investment Strategy
Long-term investors will likely have fewer worries when transacting ETFs. If a volatile market causes bid/ask spreads to widen, a long-term investor can ride it out. Should trading be necessary, then they can wait to execute their trade when volatility has subsided. In contrast, a short-term trader may be forced to exit a trade quickly, no matter what the cost. It can be a very high cost to do a panic trade when spreads are widened, and investors will need to carefully weigh up whether it is more important to trade and incur the cost, or if they can afford to wait.
If an ETF doesn’t help you achieve your investment goals and strategy, or fit with your tolerance for risk and investment time horizon, then it’s unlikely to be the best fit for you, no matter how attractive an investment proposition it seems.
Everyone in the investment industry loves to hear investors’ success stories, whether they’re about buying a house, helping their kids pay for college, or living a worry-free retirement. These stories are the reason why all of us at Morningstar come to work every day, and they motivate us to do everything we can to empower investor success.
But these stories are less common than they should be. Most investors just aren’t getting the results they deserve. According to our research, only 25.6% of U.S. households are on track for retirement success, and just 46% of U.S. households with more than $100,000 in investable assets are prepared.
There’s a huge need for great investing advice, and great advice begins with us. Not just with Morningstar, but with the institutions building investment products; with the plan sponsors trying to help a workforce unlock the power of their retirement plans; and with the advisers who face the push and pull between serving clients and building successful practices. Investors need to be able to trust that everyone up the ladder has their best interests at heart, and we can earn that trust by making a commitment to great advice with every product launch, investment offering, and financial plan.
Here’s what great advice means to Morningstar, and I challenge everyone who serves investors to think about their personal definition of great advice and how to deliver it.
How to recognize great investing advice
- Great investing advice is transparent. Morningstar will always advocate for transparency, and of course that means eliminating hidden or mysterious fees and obscured relationships. But we also think that great advice is transparent about data privacy: Every investor should have a clear view of how and where their information is being used.
- Great investing advice is independent. Everyone wins when we put investors first, and conflicted advice is a sure path to loss of trust and diminishing returns. Morningstar is fiercely independent—even when it isn’t easy—and our business has thrived. Investors respect and remember independence, so if the market dips, advisers will still be able to stand on their values, integrity, and reputation.
- Great investing advice is personal. There’s no such thing as a one-size-fits-all financial plan—there’s no way a strategy designed for mass consumption can account for every variable in someone’s life. But individualized plans are now within reach for everyday investors, thanks to new technology and strategies that let people invest in a way that aligns with not just their financial goals, but their values as well.
- Great investing advice is patient. Great financial plans don’t just consider today; they consider tomorrow and 20 years from tomorrow. Great advice is built for the long term, because time is one of the most powerful investing tools, and long-term relationships create certainty and mutual trust.
- Great investing advice is inspiring. Talking about money is intensely personal, and that’s a great opportunity to energize and motivate investors toward their goals. Our behavioral scientists have found that people become more engaged in their financial lives if they can visualize the results of success, and great advice gives them the details that enable them to do that.
- Great investing advice is straightforward. One of the pillars of Morningstar’s success is our ability to make complex investment information easy to understand and easy to consider. Investors should be able to understand where they are and how they’re doing without deciphering jargon or digging through a pile of spreadsheets.
- Great investing advice is visionary. Every day it seems like there’s a new investing fad or can’t-miss stock tip being pushed by pundits; all too often they’re just bad, old ideas dressed in new clothes. Great advice stays on top of the latest research, data, and possibilities so investors can seize new advantages as they arise.
The time for great advice is now
The need for great investing advice exists at every corner of our financial lives—from saving, to major life events, to retirement and inheritance planning.
Investors need great advice. And great investing advice makes everyone shine.
The world is changing, the levers of central banks no longer have the same power to contain the global economy, and China’s growing presence on the world stage is reshaping geopolitics and markets. These are just some of the observations of Australia’s former chief envoy to the US and now vice-chairman at the Capital Group, Michael Thawley.
Despite the at times grave tone, Thawley, whose chronology includes a stint as international adviser to John Howard, sought to assure the audience at Morningstar Investment Conference that he remained optimistic on the outlook. Among the messages? We’ve had it good for a long time and the next downturn will necessarily present a new set of challenges.
But with these challenges come opportunities to make successful investments, he says. “We need to be more careful than usual to prepare for a situation which is inevitable at some point, maybe in the next year or so,” Thawley says.
“We need to be sure our portfolios are tested to the extent possible against the risks and we need to understand the changed situation facing the companies in which we invest.”
In a sweeping overview of the changing world order, Thawley dropped pins on key areas of concern. Among them the complacency that has developed since the global financial crisis of 2008, and the effect of China’s growing influence. In the decade since the global financial crisis, Thawley argues, asset managers and investors alike have become used to treading a robust growth path, supported by central banks that are willing to “come to rescue” when markets wobble. Particularly in Australia, with its 28-year run of growth.
But this change in mindset must be understood alongside the shift in global order that has been occurring in the past three of four decades. Here, Thawley is referring to the integration of China into the world economy. Whereas Deng Xiaoping was content to accept the prevailing strategic order as being in China’s interest, his successor, Xi Jinping, has other ideas for the Middle Kingdom. And Thawley is unsure the world has fully grasped the repercussions of this evolution.
“No other country can add the same momentum at the same pace as China has done,” he says, “not even India for all its great success and undoubted potential.”
And it’s this momentum that is rippling through geopolitics, its clearest manifestation being the trade row between Xi and his US counterpart Donald Trump. Whether this dispute ¬– which ignited last year and traces its origins back to accusations of intellectual property theft – will resolve is unknown. By Thawley’s reckoning, a deal will be reached. But it won’t be perfect. Nor will it necessarily level the playing field or achieve one of its original aims: to remedy the US trade deficit.
This of course has ramifications for Taiwan – both a bastion of democracy and one of China’s most closely held territories. And here Thawley is concerned. People, he argues, are failing to acknowledge the pressure on Taiwan, particularly its leading edge in IT. If the status quo changes, Thawley warns, so too will the stability in our region.
So, what will the US-China relationship look like? “My answer is that of course there will be an ongoing economic relationship between the two,” Thawley says. “Some modus vivendi will be found, trade will continue, but it will be in the context of areas where there’s no go and it will be limited. And probably, the next generation of Capital Group people will be dealing with the issue.”
And while Thawley welcomes China’s desire to play a greater role financial markets, he is alive to the inherent risk it entails, particularly in bond markets. China needs inflows because there’s a huge amount of debt to deal with. But what happens when its citizens decide to diversify outside the economy? Where will the liquidity be?
On the other side of the world, Thawley sees a diminished role for Europe without the UK – something he says the EU is willing to accept. The flipside, however, is that if Europe no longer plays a key role in the strategic balance, then “free market approaches are going to be much weakened”.
Underpinning this global overview is a warning on central banks, which Thawley no longer sees as having the same flexibility to reduce interestrates, some of which are below zero.
He sees governments as reluctant to resort to quantitative easing because of the effects on income, wealth distribution and asset valuations. Does that mean, however, that fiscal spending is a viable option, especially given so many countries have large deficits?
Part of the answer at least is that central banks may have to help governments manage this by “monetising deficits”.
“A few years ago, this might have been a controversial idea, but I don’t think it is any longer. And in conversations in Washington with people who have been in positions in the central bank it’s very clear that this is what people are expecting.”
That in turn creates uncertainties, which Thawley admits will cause asset managers heartburn. But he insists this is not the outline of a doomsday scenario – and that opportunities will emerge.
“The shifts are already happening,” he says. “And these shifts are our bread and butter because they are what provide the opportunities and the potential for us to make successful investments.”
Hamish Douglass looks back on the rocky route to Magellan, his exasperation at trying to predict the Fed’s rate moves, and the regulatory risks assailing the US tech stocks that form a pillar of Magellan’s global equity strategy.
There are three things you should know about Magellan’s chief rainmaker Hamish Douglass: first, he puts his money where his mouth is; second, he never loses sight of the fact he’s playing with other people’s money; and third, when it comes to global equities, the key is to invest in the world’s best businesses at sensible prices.
Others, of course, already know this about the steely-eyed investment banker who co-founded Magellan Financial Group in 2006. One of those people is Australian tycoon James Packer. Packer wasn’t at the Morningstar Investment Conference where Douglass shared his wisdom with a 1000-strong crowd of advisers – probably because he was finalising the sale of almost half his stake in Crown Resorts to Melco Entertainment’s Lawrence Ho. But Packer may well have had an envoy in the audience because a few days later he was revealing that he’d been on the phone to Douglass wanting a tip on where to park his newfound $1.8 billion pile.
Douglass may still drive the same car, as he revealed to Morningstar’s Tim Murphy, but he’s the man many – from the high net worth crowd to the humble retail investor – seek when they want returns.
During a wide-ranging and candid “fireside chat”, Douglass recounted the genesis of Magellan, his exasperation at trying to anticipate the US Federal Reserve’s rate moves, and the regulatory risks assailing the US tech stocks that form a pillar of Magellan’s global equity strategy.
Magellan may now boast $83 billion funds under management, but it was a very different story in the early days of 2006 when, with co-founder Chris Mackay, the returns were anything but immediate. The pair, who had started at Schroders on the same day, had a plan to set up their own shop, their heads full of investment lessons gleaned from visits to Warren Buffett’s Berkshire Hathaway forums. Soon after they launched their first flagship fund, the share price took off and performance fees starting rolling in. There was only one problem: Magellan was losing money. “It was just a lot of hot air,” Douglass said. “And in reality, Chris and I were having a heart attack, thinking that we were going to get paid moneythat we hadn’t earned. So, we said, ‘we have to get rid of this, this is horrendous!’”
Back to the drawing board. Another fund and another invaluable lesson in investing. This time on 1 July 2007, just as the seeds of the 2008 global financial crisis were being planted. Then the inevitable: “Markets collapsed, and we’d employed all these people and the business wasn’t effectively earning money at that stage,” Douglass recalled. “And while it didn’t feel like it at the time, it was the best thing that ever happened. It sounds weird. We were lucky we had $100 million of capital so we weren’t actually worried about going bankrupt. But it enabled us to differentiate ourselves in those early days. Never waste a good crisis is probably the message.”
Market timing brings its own lessons so does investment selection, and in the early days it seemed Douglass had hit upon the right mix. A three-pronged sector approach – franchise, financials and infrastructure – an approach Douglass looks back on as something akin to a “three-humped” camel. Others, however, had spotted a fly in the ointment. “I’ve never heard anything so stupid”, deadpanned Frank Casarotti, Douglass’s long-time consigliere and Magellan’s general manager of distribution. And Frank was right. The accountability was shaky, and the decision-making process held little water. But the problem was swiftly solved.
Chris Mackay looked at Douglass and simply said, “Hamish I think you should be the portfolio manager of that strategy.” This time thankfully, Casarotti had intervened before the launch of the product. Another crisis, and another lesson for Douglass. “Whenever you make a mistake, you have to own up to it and you have to deal with it, and don’t be afraid to change your mind if the facts change. Just don’t dig yourself in.”
Those early lessons have shaped Douglass’s thinking and bolster his more recent ambitions such as making listed investment trusts more equitable and innovating in the retirement space – an area he argues has been neglected for three decades despite the fact “there’s more money in retirement phase than in the accumulation phase.”
But other problems gnaw at Douglass. He has almost given up on trying to anticipate the Fed’s interest rate moves, and the burgeoning crackdown on American tech giants such as Facebook and Google Alphabet clearly riles him. Why? Because nosy politicians fail to fully grasp the complexity in regulating social networks like Facebook and Google’s video-sharing site YouTube, which he notes have 2.5 billion and 2 billion users, respectively. “Are you going to turn these platforms into publishers where they have to be fully accountable for any post that’s made on their platform?” And that’s just the start of the regulatory can of worms. “Should you have to separate Google and YouTube? There’s competition issues. Can you prefer your own in-house services from third-party services when you own a platform?”
That’s not to say Douglass has lost faith in tech. On the contrary, he came to the conference armed with startling statistics about Facebook’s messaging platform (2.7 billion users on their messaging platforms “and it’s unmonetised”) and its video-on-demand service Facebook.
Watch (“in its first 14 months it has picked up 100 million watchers, spending on average one hour a day. Netflix has 140 million subscribers at the moment”).
But the question perhaps on everyone’s mind emerged during the audience Q&A. “How do you invest your own personal money?”
“I have to say 90 plus per cent of my wealth is tied up in Magellan Financial Group,” Douglass said. “And I’ve never sold a share and all I’ve done since we set Magellan up is buy shares. And I’m actually not looking to sell shares in Magellan. I think that’s kind of a copout.
“Out of my free cashflow I’m putting the vast majority into the strategies managed by Magellan. I really believe in what we’re doing.”
Investing with a high-conviction manager may sound prudent, as it can help increase investors’ exposure to managers’ strong ideas, which could potentially lead to better performance. But higher portfolio concentration may also increase the risk of missing out on some of the market’s other big winners, which have historically driven a disproportionate share of its returns.
A recent study from Morningstar Research Services showed that, in practice, these opposing forces tend to balance each other out, so there isn’t a significant relationship between portfolio concentration and gross returns among U.S. equity mutual funds. Yet, concentrated managers tend to charge more, and the risk of manager selection is greater for these funds because of the wider range of potential returns between winners and losers.
Below, see some of the key findings from this study.
How our research evaluated portfolio concentration
This study measured the potential relationship between portfolio concentration and performance by grouping actively managed funds in each Morningstar category into quartiles based on the percentage of assets they invested in their top 10 holdings at the end of each year. It then tracked the gross returns (which controls for differences in fees) of each group over the next 12 months before updating the group assignments. The analysis included non-surviving funds and used the original category assignments as of the sorting date.
To assess the odds of finding high-performing managers in each group, the study also calculated success rates for the funds in each quartile over both a 12-month holding period and a 36-month holding period. For this study, success rates were defined as the number of funds that survived and outperformed their respective category’s benchmark over each holding period, divided by the total number of funds as of the sorting date.
Greater portfolio concentration doesn’t necessarily improve performance
This research showed that though the most-concentrated quartile of funds (Q4) generated higher annualized gross returns than the least-concentrated quartile (Q1) in seven of the nine U.S. equity categories from January 1994 through December 2018, these differences were not statistically significant.
The same was true for foreign stock categories. Although the most-concentrated quartiles posted higher returns in five of the six categories between January 2004 and December 2018, the return differences between the most- and least-concentrated quartiles were not statistically significant. In many cases, they weren’t economically significant either.
Similarly, the most highly concentrated managers didn’t see significantly better success rates than the least concentrated. It was split roughly in half as to whether the most-concentrated or least-concentrated funds did better. But in all cases, the difference in success rates between these quartiles landed within 10 percentage points, adding further evidence that there isn’t a significant relationship between portfolio concentration and the odds of beating the market.
Risks associated with portfolio concentration
Even though portfolio managers who invest with high conviction don’t necessarily have higher odds of outperformance, our research found that the potential opportunity cost of choosing a poor manager increases. This is because concentrated portfolios have a wider range of potential returns than their counterparts who are more broadly diversified.
Return volatility is another potential risk that could increase with portfolio concentration, because of the additional exposure to firm-specific risk. However, this study found that in many of the categories, funds in the most-concentrated quartiles only exhibited slightly greater volatility than the least concentrated. And in three of the foreign stock categories, the most-concentrated funds exhibited lower volatility than the least-concentrated ones.
In those categories, the most-concentrated managers were able to partially offset their higher idiosyncratic risk by taking on less market risk than their counterparts who were better diversified. They accomplished this by favoring more-defensive investments or carrying larger cash balances.
Firm-specific risk isn’t rewarded on average, so investors may want to know that concentrated managers are taking appropriate steps to manage this risk. To assess whether their steps have been effective, investors can pay attention to portfolio volatility and market beta.
Fees tend to increase for concentrated portfolios
While there was not a significant relationship between concentration and gross returns, the most-concentrated funds tended to charge higher fees than the least-concentrated ones did. This is consistent with the idea that investors may be willing to pay up a bit for bolder active bets. However, this study suggests that it may not be worth paying a premium for a concentrated, high-conviction portfolio, since there is no evidence of significantly better odds of outperformance.
U.S. stock markets experienced a strong rebound in the first quarter of 2019, following the previous quarter’s correction; however, the global impact of the turnaround has been weaker.
Every quarter, Morningstar’s quantitative research team reviews the most recent global market trends in finance and evaluates the performance of individual asset classes. The findings are then shared in the Morningstar Markets Observer, a publication that draws on quantitative analysts’ careful research and market insights.
Below, see some of the chief findings from this quarter’s review.
6 trends from the latest quarterly market update:
1. Expectations for major policy rates declined. In first-quarter 2019, the Fed, the European Central Bank, and the Bank of England all lowered their market expectations for the path of policy rates (shown on the chart below). The three central banks revised down their growth forecasts, though they noted that upside inflation risks have recently softened. The Fed and ECB policymakers also explicitly lowered their guidance on the likely path of monetary policy: Neither institution’s forecast includes expectations of rate increases in 2019, and implied rates on futures contracts show rate increases are also unlikely in 2020.

Source: Federal Reserve, European Central Bank.
2. Global trade may be nearing the trough. Though the outlook for global trade remains gloomy, there are indicators that the pace of slowdown may be moderating. As the chart below illustrates, Chinese manufacturers’ export orders showed signs of bottoming in first-quarter 2019. And while U.S. and German exporters have continued to see a drop in new orders, their overall pace remains near the averages set in the aftermath of the 2008-09 financial crisis. However, the future of these numbers is subject to how U.S.-China trade tensions play out. 
Source: Institute for Supply Management, Institute for Economic Research, China Federation of Logistics & Purchasing.
3. U.S. retail sales decline, though elevated sentiment and a strong labor market indicate a coming rebound. As shown below, late 2018 and early 2019 saw U.S. retail-sales growth plunge to its slowest pace since 2014, which aligns with the overall economic slowdown in those quarters. Nonetheless, a strong labor market and easing financial conditions have led to an overall favorable macroeconomic environment. Similarly, U.S. consumer sentiment remains elevated around 96, which suggests a bounceback in household spending may be on the horizon.
Source: U.S. Department of Commerce, University of Michigan.
4. Morningstar fund category Bear Market saw top performance. Funds from the Bear Market and Latin America Stock Morningstar Categories experienced the highest performance in first-quarter 2019. The Bear Market Category also earned the highest-trailing 1-year returns (7.2%), which is particularly noteworthy, as most other categories experienced negative-trailing 1-year returns.

Source: Morningstar Direct.
5. Continued decline in costs. Multiple factors have contributed to overall falling costs, such as fund companies lowering expenses on existing funds, high-cost funds leaving the market, assets shifting to lower-cost funds, and newer, lower-cost funds entering the market. As shown below, although asset-weighted expenses for both equity and fixed-income funds have fallen nearly 30 basis points since 1994, costs have been declining because the expense ratios of individual funds have hovered around zero since then.
Source: Morningstar Direct.
6. Funds with below-average assets saw the most launches, while above average saw the most closures. As shown below, funds with lower-than-average assets accounted for most of the year’s launches: 382 out of 1,049. Alternatively, fund closures saw a more even spread across asset sizes, though funds with average, above average, and high assets contributed to the lion’s share of closures.

Source: Morningstar Direct.
Overall, though the rebound of U.S. stock markets has led to a substantial lift for equity markets, the economic data remains mixed. This leaves continued uncertainty as to whether the upswing is backed by real economic growth.
Share prices at private health insurers NIB Holdings (ASX: NHF) and Medibank Private (ASX: MPL) bounced this week as Labor’s election defeat scuttled several policies that would have likely increased member outflows and slashed margins, says Morningstar’s David Ellis.
The shock defeat of the Bill Shorten-led Labor Party has reversed negative election sentiment and boosted the share price of Medibank Private and NIB Holdings, which rose between 12 and 13 per cent, respectively, in the wake of the Coalition’s upset win.
“Despite the positive political outcome, our fair value estimates are unchanged for both insurers and both stocks are broadly fairly valued at current levels,” Ellis says.
“We had not incorporated Labor’s premium rate increase limit in our forecasts so no change to near-term earnings expectations for Medibank and NIB Holdings.”
Medibank’s fair value estimate remains unchanged at $2.95, a modest discount to its $3.27 share price as of 3pm today. NIB is trading at $6.70, versus Morningstar’s $6.82 fair value estimate. Both companies also maintain their narrow moat ratings – highlighting Morningstar’s belief that they each hold strong competitive advantages.
Central to Labor’s private health insurance reform was a plan to cap premium increases to 2 per cent.
It also planned to reduce the private health insurance premium rebate – a move insurers feared would decrease the number of Australians with private health insurance.
Like many pollsters and pundits alike, private health insurers were expecting a Labor win and were accordingly cutting costs in underwriting and administration.
That hedging strategy has paid off better than expected in light of the Coalition’s unexpected win, Ellis says. “So, margins look safe, with future premium rate increases likely reflecting growth rates in claims inflation and increased utilisation,” he says.
“The insurers will benefit from a better understanding of respective cost bases and should be able to leverage this knowledge to reduce future claims cost increases and hospital utilisation rates and improve productivity.”
Greater certainty around Australia’s private health insurance rebate system after Labor’s loss has benefited insurers in other ways, too.
Currently households with annual income of $180,000 or less receive rebates of about 30 per cent from the government on premiums.
According to Ellis, Labor’s proposed downgrading of this rebate would have likely accelerated the decline in the number of Australians with private health insurance. He says smaller not-for-profit insurers might have copped an additional unintended consequence of Labor’s now-defunct plan to limit premium increases, as their already slim underwriting margins would be further tightened.
“Market leader Medibank’s net insurance underwriting margin is 8.7 per cent as at 31 December 2018 and the industry average is about 5 per cent.
“We maintain our view the industry regulator, Australian Prudential Regulation Authority, would likely force consolidation on funds that making underwriting losses,” Ellis says.
Staunching member outflows remains a challenge
Despite the current reprieve, policyholder coverage rates continue to fall, and face political and regulatory risks in the longer-term.
For Medibank, Ellis points to the government’s planned sale of its stake in Medibank as a potential problem – largely in the perceived view that this will heighten the company’s risk.
“Under the current regime, premium increases are subject to approval from the federal health minister upon advice from the regulatory body, the Private Health Insurance Administration Council.
“The process leaves the health insurance industry exposed to unfavourable political agendas or decision.”
While noting the additional risk of a potential withdrawal of government support for private health insurance, Ellis sees this as unlikely.
“Currently, both federal and state governments fund approximately 70 per cent of Australia’s health expenditure, and given Australia’s ageing population, it is in the government’s interest to support the sector.”
Financial advisors often find themselves playing the role of counselor, and they are confronted with clients whose emotional health is wreaking havoc on their finances. Some clients may be financially well-off, but so fearful of making a wrong choice that they don’t make any, leaving their wealth to slowly erode in cash accounts. Then there are clients who spend too freely, choosing blissful ignorance about potential damage to their bottom line.
Neither of these types of clients are financially healthy—regardless of wealth—because an individual’s attitude toward finances is just as essential to overall health as it is to the economic aspects of one’s life. In fact, the American Psychological Association reports that money is continually one of the top sources of stress in U.S. households, regardless of the economic climate.
It’s time to redefine the term “financial health” so it includes both a person’s economic stability and emotional well-being around his finances.
Economic stability is only part of reaching financial health
What is financial health? The topic usually brings to mind only a person’s monetary wealth, but, as many advisors know, even the wealthy can suffer because of their finances. For example, consider the client who has more than enough financial resources to last the rest of his life, but gets anxious about even the smallest splurge. A standard financial algorithm would classify this type of client as being in excellent financial health, since he possesses enough material wealth to withstand any reasonable economic shock. Yet, this finance-related anxiety can ultimately mean his quality of life is quite low.
The impact of emotional well-being on financial health
Morningstar conducted several focus groups with financial advisors to learn about the types of barriers to financial health they encounter in their day-to-day practice. The lesson from these interviews was clear: A client’s psychological state heavily impacts financial behavior, and advisors who ignore their clients’ emotional well-being quickly see their well-thought-out financial plans in ruins.
For advisors, paying attention to a client’s emotions and attitudes toward finances can be a key opportunity for meaningful coaching. By identifying specific patterns of thought that may sabotage clients’ overall financial health, advisors can help guide clients to better financial decisions and increase their satisfaction and peace of mind.
For example, our research found that a person’s unique “mental time horizon,” or how far ahead one thinks into the future, had a significant impact on financial health. A person’s tendency to think further into the future could have a huge impact on cash management, debt reduction, and savings behaviors—resulting in, on average, 20 times more money saved. However, many people automatically give more weight to immediate needs and discount the future, resulting in financial behaviors that may hurt long-term goals.
To identify your client’s natural mental time horizon, ask her to think about a day in the future. Without any prompting, your client will think of a day in a time horizon with which she feels comfortable. Once you know where she naturally feels at ease, you can start challenging her mindset and asking her to think a few years beyond her natural benchmark. Every time you meet with the client, push a little further, encouraging the client to extend the mental time horizon.
How this approach to financial health can help clients
Morningstar has created a simple framework for assessing your clients’ financial health on both an economic and emotional level. Using this framework, you can quickly identify specific aspects of a client’s financial health that need to be addressed, and then use this information to guide the client toward a stronger state of well-being.
What can March Madness teach us about the most effective approach to investment analysis? Quite a bit.
The tradition most associated with the annual college basketball tournament—filling out your bracket—works off a number of the same principles as investing, especially when it comes to reaping the benefits of a holdings-based style analysis over a returns-based style analysis.
Here are the top reasons a holdings-based style analysis can serve your investments, as well as your March Madness bracket.
The benefits of a holdings-based style analysis
1. You wouldn’t look at a team’s past record to evaluate its chance of success this year; you would consider the new roster and coach.
The same is true with portfolios of investments. Whether you’re evaluating a portfolio of individual stocks and bonds or that of a fund manager, the underlying holdings are constantly evolving both in terms of representation and their reaction to different events. Therefore, a holdings-based style analysis, which evaluates a portfolio by those holdings (or what it currently is), can be considered more relevant than returns-based style analysis, which evaluates a portfolio based on its historical returns (or what it previously did).
2. When a portfolio is outperforming, holdings-based style analysis will show you the true source of these gains so you can determine how to keep growing your client’s investments. A returns-based style analysis would only show that the fund is outperforming, without explaining the source of these gains—which may include high-momentum stocks from the previous year. It would be like looking at the raw numbers that make up a team’s record, rather than digging into the precise factors that contributed to those wins and losses.
3. What impact did the previous year’s highest-scoring players have on a team’s performance? And, if only some players remain on the team this year, how can we expect scores to play out? While returns-based style analysis uses regression to estimate how currency and geography have contributed to performance overall, holdings-based style analysis evaluates how each of those factors specifically impacted the holdings.
4. Because holdings-based style analysis uncovers the details of all holdings, it reveals asset classes and the risk of derivatives up front. A returns-based style analysis will not do this—which means in the event of index-return swaps, you and your client could be caught off guard by exposure at a different asset class.
5. Holdings-based style analysis generally produces more accurate results because it is a more stable form of analysis—just like a bracket that is built on the most current, detailed information.
Essentially, it’s important to understand that risk-factor models are at their most powerful when you use them to look into the future, rather than seek to explain the past. The past track record of returns for a fund or manager will not help you identify the current exposure of a fund’s holdings.
Constructing a portfolio without the foundational understanding of holdings-based style analysis is like only using past records to build your NCAA bracket. For both ventures, you need to take a closer look at the specific elements that make up the portfolio—or team—in order to be successful.
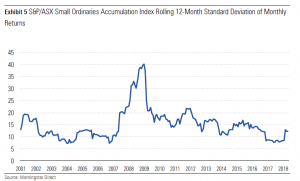
Small-cap investors may be forgiven for feeling whipsawed by volatility in 2018, but the reality is the year represented a return to more-normal conditions for the smaller end of the Australian market. Indeed, when looking back at the small-cap benchmark’s standard deviation of returns over the past 20 years (see Exhibit 5), the low-volatility period between mid-2017 and mid-2018 was a notable outlier. Such a benign environment was only matched for short periods: in the recovery period of 2004 after the tech bubble and before the global financial crisis boom in 2007. For this reason, it is important to take a long-term view when investing in small caps and be prepared to ride out the inevitable bumps along the way.
Past performance does not necessarily indicate a financial product’s future performance.
The small-cap market experienced two distinct phases in 2018. The first nine months of the year were characterised by a risk-on rally driven by high P/E stocks. Investors became particularly familiar with the WAAX (Wisetech, Altium, Afterpay, and Xero) stocks, our own version of the US FAANGs (Facebook, Amazon.com, Apple, Netflix, and Google [Alphabet]), where P/E multiple expansion far outweighed the near-term earnings prospects of the firms. Investor optimism was broadly founded on the belief that a Goldilocks-style, not too hot/not too cold, synchronized global upturn growth could be achieved with only moderate and measured rate tightening, allowing the equity bull market to continue indefinitely. This environment favoured growth managers, whose focus on long-term prospects was rewarded, while many value managers lamented the narrowness of the market rally.
A sharp uptick in US 10-year bond yields in September, which peaked in October 2018, saw sentiment turn sharply, resulting in a global sell-off in risk assets. In the last quarter of 2018, Australian small caps sold down heavily (falling around 13.7%), exacerbated by the tighter liquidity of the sector. Higher-multiple stocks were hit the hardest, resulting in a reversal in the fortunes for growth versus value and highlighting the importance of diversification of style.
For the 2018 calendar year, the small-cap benchmark finished down 8.7%, well below the large-cap S&P/ASX 100 Accumulation Index (negative 2.4%). It is difficult to call the direction of the market into 2019. While valuations have retraced to more-reasonable levels, uncertainties abound with regard to both the domestic and global economies (housing downturn, China slowdown, and trade wars). What is certain is that investors are best served taking a long-term view and manager selection remains paramount.
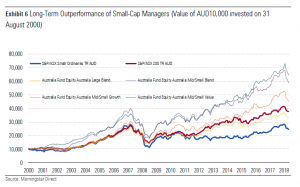
Undoubtably, the S&P/ASX Small Ordinaries Accumulation Index has a relatively poor long-term track record relative to the large-cap benchmark (averaging 5.3% per year over the 20 years to 31 December 2018, compared with 8% per year for the S&P/ASX 200 Accumulation Index). However, good active small-cap managers have overwhelmingly proved their worth by outperforming both the small- and large-cap index over the longer term. Exhibit 6 highlights that the return of the average manager across the growth, blend, and value categories has vastly exceeded both the small- and large-cap indexes, while the average large-cap manager has failed to keep pace with their own benchmark after fees.
Past performance does not necessarily indicate a financial product’s future performance.
There are a number of sources of alpha available to small-cap managers that are somewhat unique to the Australian market. We have long noted that the composition of the small-cap benchmark has a number of shortcomings, which makes it an easier hurdle to beat. The smaller end of the benchmark tends to be populated with more speculative names, such as mining exploration companies, or businesses that are yet to become profitable. Active managers can add a lot of alpha simply by “avoiding the blowups” and sticking to higher-quality names.
Second, the smaller end of the market tends to be under-researched. Sell-side brokers tend to focus in areas where there are higher trading volumes or lucrative investment banking deals, leaving many stocks uncovered. This tends to create a more inefficient market for pricing, which fundamental managers can exploit.
Third, the small-cap sector provides the prospect of picking long-term winners that can grow significantly over time, whereas the large-cap segment tends to be dominated by mature companies that increasingly face disruption risk. This provides a higher payoff profile within small-cap investing, although along with that comes commensurately greater risk.
Our preference among small-cap managers (the Morningstar medalists) is for those that have stable teams that have demonstrated their ability to avoid the disasters, exploit market inefficiencies, and identify the long-term winners over a sustained period of time. We are agnostic between value and growth, believing both styles have merit at various points of the cycle.
While the return of volatility in 2018 might provide some short-term discomfort, history has shown it is a fundamental feature of small-cap investing that investors should be prepared for. Indeed, it is within a more volatile environment that good active managers are given the opportunities to add significant value over the long term.
Use this worksheet to uncover the goals that truly matter to clients.
When was the last time you checked in on your clients’ top financial goals? A goals-based approach to financial planning can yield substantial results, such as increasing a client’s wealth by more than 15% and providing a greater sense of motivation and satisfaction with their plans, according to research from David Blanchett, Morningstar’s head of retirement research.
But our research suggests that identifying these goals can be harder than you might think; 73% of people can’t accurately state their top three financial goals when asked. Instead, many respond with the first items that come to mind—maybe a short-term priority or something they overheard recently—which may not reflect the goals that truly matter to them. And when individuals don’t take the time to carefully create and cultivate their goals, the process can’t achieve its full potential.
We’ve created a worksheet to guide clients through the process of setting financial goals.
Initiating the right conversation to find and set financial goals
Though individual investors can use the worksheet as a stand-alone tool, its intention is to initiate a meaningful goal-setting discussion between advisors and their clients. The exercise outlined in the worksheet mimics our experiment’s behavioral exercise, which nudges clients toward a deeper consideration of the goals that are most important to them.
Advisers can use this worksheet’s findings to begin a conversation that uncovers a better understanding of their client’s needs and wants.
A tested process to setting financial goals
The worksheet guides investors through a three-step process:
1)The client lists top three financial goals. This is what happens in most goal-setting conversations.
2)The adviser presents the client with a master list of common financial goals, and asks which of those goals are important but missing from the previous list the client shared.
3)After considering both versions of the financial-goals list, the client reviews the top three goals and creates a final list. Our research found that most people end up with different goals after considering the master list, suggesting that their initial ideas may rely on top-of-mind priorities.
To learn more, download our full research paper where we discuss the science behind this exercise in further detail and provide a copy of the worksheet.
This worksheet’s steps can set advisers on the right path for showing investors how to avoid behavioral biases, establish strong financial goals, and implement behaviors to help meet these goals.
This article is an excerpt of my opening address at the Morningstar Fund Manager of the Year Awards held in Sydney Friday night 1st March. For more on the winners and finalists, see the article here.
Rather than focus on the findings of the Royal Commission and what that means for the industry, I talked about Morningstar’s values and what we stand for. For us, they are more than just words on a corporate poster – we live them day to day in our business.
The opening image on the screen was that of Joe Mansueto – Morningstar’s founder, executive Chairman and majority shareholder…

Joe started Morningstar in his Chicago apartment in 1984 – 35 years ago. He left his job as a stock analyst. His vision was to give individual investors access to the same depth of information that was only available to professional investors at the time. He realised that investors lacked the data and tools required to make intelligent investment decisions and build better portfolios.
From day one, Morningstar’s business has been built on the foundation of serving the end investor and helping them reach their financial goals. All roads lead back to what is best for the end investor – we make decisions on that basis every day – both large and small.
2018 was a landmark year for Morningstar. Globally, we broke through US$1bn in revenue for the first time – a significant milestone for the company.
We are in a strong financial position with over US$350 million in cash on the balance sheet. Stable ownership and a strong financial position enables long term thinking and investment in the business.
Back in Australia, we passed several milestones. There are more than 10,000 users on Adviser Research Centre – our web-based platform to deliver our research; and usage of Morningstar’s flagship software platform, Morningstar Direct surpassed 400 users.
So what? Who cares about Morningstar’s beliefs and our financial position?
Clients and prospects care. Increasingly, we hear from individuals and organisations that Morningstar’s beliefs are just as important (if not more important) as our capabilities in their eyes. From my perspective, there has been a noticeable shift in this perspective post-Royal Commission.
The growing number of independent financial advisers care that we use Morningstar’s financial position, global scale and local footprint to deliver on the promise to support them and to improve outcomes for their clients.
We intend to accelerate our investment and product development efforts in 2019 and you will be hearing more from us on that front.
Some of our current initiatives are outlined below through the lens of three things we stand for– investor centricity, independence and transparency.
Investor Centricity
For investors, we aim to simplify the complex, to whittle down endless lists of investments, to educate and to encourage a long-term investment mindset.
We are rebuilding our individual investor website and subscription-based service to support these goals; and reaffirm our commitment to the individual investor. This work is underway and is scheduled to launch in Q3.
Independence
Morningstar’s manager research team is growing, and we are investing in that team as we support more clients – their APL management and manager selection needs; and requirement to build portfolios and managed accounts.
In line with the growth of the team, research coverage has increased 30% over the last two years.
Morningstar’s independence will remain front and centre. Coverage will be determined by investment merit and the needs of our clients. We won’t accept payment from product providers in return for coverage.
Whilst our coverage may be smaller than our competitors, our business model enables greater conviction and a skew to quality. That is positive for advisers and the clients you serve.
Transparency and Disclosure.
The importance of transparency and disclosure has never been greater – to engender trust, to engage investors and to further personalise advice.
Investors have the right to know what they own and the fees they are being charged relative to the value and services being delivered – by both the adviser and the product provider. We have and will continue to be active to drive greater transparency across the industry. These activities include:
- Over the last two years, Morningstar has been working with the asset management community to move to voluntary full portfolio holdings disclosure.
- We are at the table with the industry and regulators as it relates to RG97 to ensure we present and distribute fee data in a way that supports comparability and broad disclosure.
- Our data team is building an SMA database to shine a light on this growing area.
For 35 years, Morningstar has built its business by putting the investor above all else. It is reflected in our underlying principles and the things we stand for – like independence and transparency. It informs our partners, who we hire, our product roadmap and most importantly, when we say no. It is ingrained in our DNA – the Morningstar you experience in 35 years’ time will be the same as the one Joe setup in that Chicago apartment in 1984 and the one you interact with today. Our commitment to support and align with advisers that share these beliefs has never been greater.
Morningstar Australasia Pty Limited, a subsidiary of Morningstar, Inc. (NASDAQ: MORN), a leading provider of independent investment research, today announced the winners of the Australian Morningstar Awards 2019. Vanguard Investments Australia received the top award as Morningstar’s Australian Fund Manager of the Year.
“All winners in the Morningstar Awards have demonstrated themselves to be good stewards of investors’ capital,” said Aman Ramrakha, Morningstar Director of Manager Research Ratings, Asia-Pacific. “Whilst turbulence returned to markets, all winners and finalists continued to add value over the year and also over the longer term. Australian investors continue to have worthy investment options across the active and passive spectrum with Vanguard Investments Australia being our stand-out for 2019.” The winners of the Australian Morningstar Awards 2019 are:
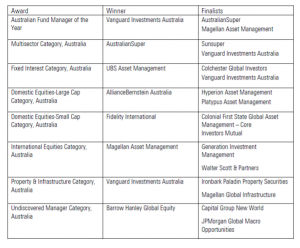
Australian Fund Manager of the Year 2019 – Vanguard Investments Australia
The recent passing of founder Jack Bogle was an opportunity to reflect on the investor first approach of the overall Australian Fund Manager of the Year winner. Vanguard continues to demonstrate the power of its low-cost simple approach to providing investment solutions to investors. In 2018 it excelled across a number of categories, cementing an impressive longer term record. Many of our winners have demonstrated that active managers can and continue to add value but with strong showings and a win across a number of categories Vanguard thoroughly deserves the overall award.
Fund Manager of the Year: Multisector Category, Australia 2019 – AustralianSuper
The high calibre team of over 200 at AustralianSuper has shown over numerous time periods and market environments to be very sound stewards of capital for one in 10 working Australians. The team has made some shrewd asset allocation decisions over the years, culminating in first quartile performance over multiple time periods, including 2018. The combination of smart and diligent team with a repeatable and time-tested process makes AustralianSuper highly deserving of the MultiSector category award.
Fund Manager of the Year: Fixed Interest Category, Australia 2019 – UBS Asset Management
UBS has performed with aplomb across its suite of fixed interest strategies for several years. This continued in the tricky conditions of 2018. Its investment capabilities surpassed most competitors, deftly navigating contrasting fortunes in the US and Australian bond markets and widening credit spreads. UBS’ reputable team has enviable tenure at its most senior ranks, and it’s shown through in consistently commendable results. The shop warrants acclaim for its fixed interest achievements.
Fund Manager of the Year: Domestic Equities-Large Cap Category, Australia 2019 – AllianceBernstein Australia
The swings in the domestic equities market in 2018 was a test which AB Managed Volatility passed with flying colours, making AllianceBernstein Australia a worthy winner of the Domestic Equities Large-Cap Category. The team led by CIO Roy Maslen utilises a quantitative approach to screen for stocks with favourable quality, value and price stability attributes, then skilfully applies fundamental overlay to identify event risk and value traps. The aim is to capture 80% of the benchmark’s return in up-markets, while protecting 50% on the downside. Since its inception in April 2014 to the end of January 2019 the strategy has delivered, with an upside capture ratio of 92.5%, versus a downside capture of 54%. The ability to keep broad pace with rising markets coupled with a focus on reducing downside volatility makes AB Managed Volatility an excellent strategy for the times.
Fund Manager of the Year: Domestic Equities-Small Cap Category, Australia 2019 – Fidelity International
Fidelity Future Leaders has won Domestic Equities-Small Cap Fund of the Year for the second consecutive year, which is testament to the disciplined investment process and well-considered portfolio construction methodology. However, ultimately, the strategy’s success has been highly dependent on the thoughtful portfolio manager, James Abela and his decision-making ability. Abela selects stocks for the portfolio based on the three pillars of viability, sustainability, and credibility, which have allowed him to avoid some of the major stock disasters and achieve some outstanding results against peers, in the past 5 years. Fidelity Future Leaders has the solid characteristics necessary to ensure investors are rewarded through the full economic cycle.
Fund Manager of the Year: International Equities Category, Australia 2019 – Magellan Asset Management
Magellan Asset Management has delivered an outstanding performance in 2018, a year in which volatility increased significantly for global equities. Via its leader, Hamish Douglas, Magellan executes its risk conscious style with conviction and consistency. It benefited handsomely from its long-term holdings and a flexible cash allocation during a period where the benchmark only just delivered a positive return. Magellan’s headline global strategy, however, was only just shy of a remarkable double-digit performance. This has not been a one off for the firm, Magellan have consistently delivered for investors over many years, another feature we value highly for this award.
Fund Manager of the Year: Property & Infrastructure Category, Australia 2019 – Vanguard Investments Australia
Vanguard continues to set a high standard. Its benchmarks have proved difficult hurdles for active managers to beat across the real assets sector, and 2018 was no exception. A well-executed approach, low cost, large scale and low portfolio turnover have delivered enviable outcomes for investors relative to peers over multiple time periods. It’s this consistent delivery across a range of products in listed property and infrastructure that gives Morningstar analysts a high degree of confidence that Vanguard will serve investors well over the long term.
Fund Manager of the Year: Undiscovered Manager Category, Australia 2019 – Barrow Hanley Global Equity
Dallas-based Barrow, Hanley, Mewhinney and Strauss is relatively unknown to Australian investors, but with a heritage dating back to 1979, we think this value-oriented firm warrants more attention. The Barrow Hanley Global Equity Trust, distributed in Australia by BNP Paribas, was launched in Australia in 2016, though it has a track record offshore dating back much further. Anyone looking for global equity exposure with a value tilt should consider what’s on offer here. A large and experienced team, plying a disciplined value process, first caught our eye in 2017, leading us to add it to Morningstar Prospects. It’s recent graduation to full coverage and a Morningstar Analyst™ rating of Bronze reflects our conviction that this is a global value manager we believe can outperform over the long term.
The Awards are copyright Morningstar. Fund managers may not publicise the Award(s) without the prior written consent of Morningstar.
Methodology
Only fund managers with managed funds available for sale in Australia qualify for inclusion in the Australian Morningstar Awards.
Morningstar determines the winner based on a combination of qualitative research by its manager research analysts; risk-adjusted returns over medium- to long-term periods; and performance in the 2018 calendar year. Morningstar’s manager research analysts assess the track record for a fund based on Morningstar’s Risk-Adjusted Return measure over the one-, three-, and five-year periods. The objective is to screen for fund managers that have provided consistently strong returns, and not just reward those with the most impressive one-year return but have otherwise struggled to impress.
Morningstar’s manager research analysts then conduct a qualitative assessment of the fund managers under consideration. This incorporates the five pillars of the Morningstar Analyst Rating™ – people, process, parent, price, and performance. The qualitative assessment also captures practical issues that quantitative screens cannot. After assessing the quantitative and qualitative outcomes for each fund manager, Morningstar’s analysts then debate and decide on the fund managers they believe are worthy winners and finalists across the various categories. If a verdict cannot be reached by a unanimous decision, then each analyst casts a vote to decide.
Determining the Morningstar Australian Fund Manager of the Year 2019
To receive the overall Morningstar Australian Fund Manager of the Year award, a fund manager must have offered funds in multiple award categories or delivered an outstanding outcome for investors. Fund managers were assessed not only on whether they were a finalist in more than one category, but on products that had peer-beating returns but did not obtain a top three position. Morningstar’s manager research analysts present the Morningstar Australian Fund Manager of the Year 2019 award to the fund manager that had strong returns across multiple categories and was deemed a good steward of investors’ capital. The Morningstar Australian Fund Manager of the Year 2019 therefore represents the Australian fund manager that, in Morningstar’s opinion, has achieved the highest level of funds management excellence.
For more information about Morningstar’s other global fund awards, visit https://go.morningstar.com/Morningstar-Awards
Relatively flexible, or unconstrained, fixed-interest strategies have touted their capacity to handle higher-bond yields better than more-traditional options. Our prior research has found some validity to these claims, albeit in a limited sample size. There were more opportunities to test this in 2018. We consequently investigate whether this has remained true and discuss the implications for using these vehicles in portfolios.
Key Takeaways
× Flexible fixed-interest strategies have generally handled periods of higher US government bond yields better than more-traditional index-relative vehicles.
× Much shorter interest-rate duration has been the primary reason for this discrepancy.
× Most of these flexible offerings have posted small gains whereas major bond indexes fell in value on these occasions. Within this cohort, Bentham Global Income and Franklin Templeton Global Multisector Bond have stood out.
× Performance during rising bond yields is an important, but incomplete, perspective.
× The flip side of shortening duration is the potential opportunity cost in carry foregone, which can be amplified when maintaining an outright negative duration stance. Indeed, flexible fixed-interest portfolios have typically lagged bond indexes over medium- and longer-term horizons given the lower interest-rate environment has broadly prevailed.
× The long-standing consensus that the US will be among the first developed countries to lift interest rates has been reflected in its yield curve for several years. Profiting on this view can be much harder than it appears.
× This cohort has mostly favoured credit risk over interest-rate risk. These strategies can consequently be more sensitive to widening credit spreads, which usually coincide with dips in equity markets. That said, a handful do have more distinct risk profiles—this is a diverse group of managers, so care is needed in understanding how they may fare under assorted market conditions.
× Amid concern over higher government bond yields, Australia was a reminder that not all economies are synchronised. Domestic bond yields actually fell in 2018, allowing Australian bonds to surpass equity indexes, cash, and this cohort of flexible-bond vehicles and fulfil its portfolio insurance role.
× A flexible-bond strategy can be useful when yields rise, but we think it’s usually best deployed as a component, rather than entirety, of a fixed-interest allocation.
Consternation about the impact of rising interest rates on traditional index-relative bond strategies has spurred the proliferation and popularity of more flexible, or unconstrained, fixed-interest portfolios.
Bellwether US bond yields have indeed risen since our April 2017 article “Unconstrained Bonds – Did They Survive Their First Test?” Let’s check in on whether these vehicles have continued to handle these conditions better than their more-traditional counterparts and figure out the implications for investors.
Most of our flexible-bond cohort are from the multistrategy income and diversified credit Morningstar Categories. There are also a handful from bonds – Australia and bonds – global—universes that typically house more-traditional fixed-interest offerings. A blurry line differentiates these strategies, and it is subject to interpretation. We nonetheless consider this a good sample given their characteristics and usage in most client portfolios. Appendix 1 has the full list of these strategies.
The Backdrop: Isolated but Sharp Rises in Yields
The paucity of occasions in which interest rates have risen has made testing tricky. The year 2018 was an exception. In January and February, the US yield curve rose appreciably, with 10-year yields rising to 2.87% from 2.46%. Similar moves occurred during April and September-October and translated into modest losses (in USD terms) for the Bloomberg Barclays US Aggregate Bond Index. Sharp, short bursts of higher yields have occurred before. That said, higher yields in 2018 were mostly confined to US bonds, with interest rates in several major global bond markets mostly stable or lower—Australia being a prime example.
How Did Flexible Portfolios Handle These Conditions?
Flexible-bond portfolios almost universally limited the damage when interest rates rose during 2018. Almost all beat the Bloomberg AusBond Composite Bond and Bloomberg Barclays Global Aggregate indexes on average during January-February, April, and September-October. It’s encouraging, though not unexpected—most of these vehicles have taken far less interest-rate risk than either benchmark.
So, which fared the best? Franklin Templeton Multisector Bond 17390 and Bentham Global Income 10751 stood out, posting average returns of 1.1% and 0.75%, respectively. These names shouldn’t surprise—both have been warning of higher US government yields for several years and have taken outright negative interest-rate duration positions. Elsewhere, T. Rowe Price Dynamic Bond 40282 performed admirably, its cautious outlook for US government bonds aided by currency positions in the US dollar and Japanese yen. Schroder Absolute Return Income 8922—another manager that’s been very wary of higher government bond yields—led a host of short duration, credit-oriented vehicles that rose between 0.2% and 0.35% per month.
Meanwhile, the Bloomberg Barclays US Aggregate Bond Index US$ averaged a 0.86% loss in these months. This was considerably more than the Bloomberg Barclays Global Aggregate Index A$ hedged, highlighting how this was mostly a US phenomenon. That said, several strategies lagged the Bloomberg AusBond Bank Bill Index, a cash proxy. The multistrategy income category average return surpassed diversified credit, bonds – Australia, and bonds – global, reflecting the relativities in typical interest-rate duration of these universes. Exhibit 1 shows these findings, with the individual strategies shown in blue, indexes in orange, and category averages in light green.
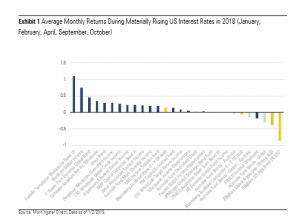
We’ve extended this analysis back to 2013 to include the mid-2013 taper tantrum, February and June 2015, and October-November 2016. Exhibit 2 shows the results.
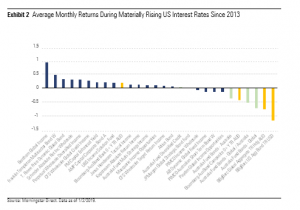
Familiar faces appear at the top—Bentham Global Income 10751, Franklin Templeton Multisector Bond 17390, T. Rowe Price Dynamic Global Bond 40282, and Schroder Absolute Return Income 8922. Although the same broad trend of flexible-bond strategies outperforming bond indexes remains intact, it’s not quite as clear-cut. Payden Global Income Opportunities 19589, PIMCO Australian Short-Term Bond 17158, AB Dynamic Global Fixed Income 40260, and PIMCO Income Wholesale 41334 incurred losses, on average. Conditions do vary—there was a broad-based sell-off in risky assets and duration- sensitive bonds during both the 2013 taper tantrum and in June 2015, which few bond managers could overcome—nontraditional or otherwise. There is a caveat—AB Dynamic Global Fixed Income 40260, PIMCO Income Wholesale 41334, and T. Rowe Dynamic Global Bond 40282 weren’t around for the entirety of this period, having started in 2014 or 2015.
The Be-All and End-All?
Nontraditional fixed-interest strategies have had a leg up when it comes to handling rising interest rates to date. But there are other important considerations. Shortening a portfolio’s interest-rate duration can come with significant costs in carry foregone, the coupon interest on the underlying bonds. An outright short, or negative duration, position amplifies this. While a capital gains payoff can be significant if yields rise, it can be costly to maintain this stance and take much time to pay dividends. You need look no further than Franklin Templeton’s wild ride—its periodic surges when US Treasury yields have risen have been accompanied by underperformance elsewhere, and it actually trailed over the full course of 2018 as hits from its short duration were compounded by its aggressive emerging-markets stake. And while Franklin Templeton is an extreme example, most other flexible-bond portfolios have lagged bond indexes over medium-term and longer time frames given the lower interest-rate environment has broadly prevailed.
US dollar bonds are a significant component of the Bloomberg Barclays Global Aggregate Index (41% at the start of 2019), but that doesn’t necessarily translate into a major slice of an Australian investor’s bond allocation. Many active global bond managers—flexible or otherwise—have had limited exposure to this region in absolute and/or duration-weighted terms. The US Treasury yield curve has priced this in accordingly—it’s been among the steepest upwardly sloping curves globally from 2014-17. It’s easy to believe that the US will lift interest rates, but profiting on it is much harder—investors need to be both correct and ahead of the pack.
Sensitivity to credit-spread moves across this cohort shouldn’t be understated. Many of these vehicles have favoured credit risk over interest-rate risk. Both sides of this coin can help when sovereign yields rise, as credit spreads typically compress during a “risk on” environment of higher government bond yields. However, when this relationship doesn’t hold, even flexible vehicles can feel the pinch. This occurred in June 2013 and June 2015 when almost all unconstrained fixed-interest strategies trailed the Bloomberg AusBond Bank Bill Index. That said, a handful do have more-distinct risk profiles. In June 2015, T. Rowe Price Dynamic Global Bond 40282 almost matched the Bloomberg AusBond Bank Bill Index amid widespread losses, aided by its ploy to hedge its corporate credit beta through credit default swaps. Meanwhile, Bentham Global Income 10751 stood out during the June 2013 taper tantrum as its exposure to floating-rate syndicated loans was insulated from the flight from duration-sensitive assets.
Idiosyncratic exposures beyond the typical corporate credit risk allowed these strategies to navigate this short-term volatility better than most.
Even if guarding against higher yields is the overriding consideration, investors should maintain a clear understanding of how these types of strategies may fare under assorted conditions. The post-financial- crisis period may be less relevant if the end of low interest rates globally is indeed nearing, but the fact that most flexible-bond strategies didn’t really capitalise either way is a reminder of the difficulty in getting this call right. The extended period of relative calm across credit markets has also left little scope for testing how these strategies may fare under greater adversity, especially if higher government bond yields lead to tightening financial conditions.
On that note, a simple way of identifying the degree of credit and interest-rate risk a bond manager is taking is through the fixed-income Morningstar Style Box. Credit quality is shown along the vertical axis and interest-rate duration along the horizontal, and you can see how this differs for strategies such as Payden Global Income Opportunities 19589 and Vanguard Australian Fixed Interest Index 4487.
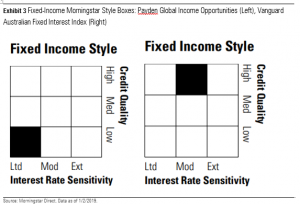
Meanwhile, 2018 was a reminder that not all economies are running in sync. Australia is an obvious example. Domestic bond yields fell during 2018, allowing Australian bonds to fulfil their portfolio insurance role, surpassing equity indexes, cash, and term deposits –and this cohort of flexible-bond vehicles in 2018. Higher US Treasury yields could still lift the cost of capital globally, particularly as another monetary-stimulus domino fell with the European Central Bank ending its quantitative-easing programme in 2018. But the unpredictability of investment markets dictates a sensible approach to portfolio construction to handle unforeseen circumstances.
There is a wide assortment of flexible-bond strategies. A few lean towards higher-grade paper and maintain some duration. We’d have no qualms about using these vehicles more liberally given the lower drawdown risks in the face of adversity. In the main, an unconstrained bond portfolio can be a useful aid if interest rates increase, but we think it should be a component, rather than the entirety, of a fixed- interest allocation.
Key Takeaways
- Benchmarking your financial progress is a key tool for success, but it’s often done referencing the
wrong things and over the wrong timeframe - Benchmarking is often done as a rear-vision exercise. Decision-making should be forward-looking
- At its extreme, incorrect benchmarking can leave investors prone to “chasing winners”, which may
hinder their ability to meet their financial goals - Benchmarking against peers or an index is a concept used to help define whether an investment
proposition is delivering value. It is well intentioned; however, we should acknowledge the
shortcomings - Investors have unique goals, so any benchmarking should ideally align with those goals.
When you invest, it’s important to remember that you’re making a short-term sacrifice for a longer-term gain. In most instances, the objective is financial prosperity, security, or the attainment of a goal, which are all typically longer-term in nature. This may sound obvious, but it highlights one of the biggest issues we find around this time of year. Primarily, investors often spend their time reviewing performance against a designated benchmark, but this can result in a biased comparison, where the wrong things are compared to each other over the
wrong timeframe. We’ll elaborate on this, but want to ask you throughout: What will you be benchmarking in 2019?
Measuring Success
Imagine a scenario in which you achieved 5% over 2018. Was this a success? Perhaps. How about if we added that the return was 4% less than the previous year, 3% above the peer-average, 2% above inflation and 1% lower than your desired level of return. Was this now a success? Maybe…
How about now adding the knowledge that one asset was attributable for your total return. You held other assets, but these netted off and went sideways in aggregate. You also took more risk than you’d have liked, which made you anxious at certain periods of the year. What about now? Hmm…
This example hopefully helps illustrate the complexity of appropriate benchmarking. There are many moving parts, some of which you can control—risk taken, assets held, timeframe considered—and many others you can’t.
As individuals, it’s important that we can each measure our own success in a way that is appropriate to the circumstance. Ideally, this will include a robust and repeatable framework, which may or may not use benchmarking tools. The list of tools at your disposal is theoretically endless, although must be appropriate.
What Tools Are Available?
As an industry, most investments options are benchmarked against one of the following:
- Peer relative. Often done in quartiles, where portfolios are ranked against comparable managed portfolios on a scale of 1 to 4
- Index relative. Where a portfolio is measured against a passive benchmark net of fees
- Absolute return. Often seeks to return a consistent positive level over time, regardless of inflation, interest rates, and other variables
- Real return. Seeks to deliver a level of return over inflation, growing the purchasing power of the portfolio over a defined period.
Each of these methods has advantages and disadvantages, with the most applicable likely to depend on what you are trying to achieve. For example, many asset managers benchmark against relative outcomes—from index-relative (fuelling the active versus passive debate) to peer-group comparisons— all designed to sort the winners from the losers.
This relative benchmarking is well-intentioned and can be useful if considered over longer periods. However, it can sometimes misalign to the reason we invest. Perhaps most prominently, it sometimes leaves investors inclined to favour the “best” performers and yearn to be part of this echelon. Investors similarly look down on the “worst” performers and sell in frustration.
This shouldn’t be underestimated. If an investor feels that they are underperforming, they will be psychologically prone to act. At its extreme, this impulse can lead investors down a garden path where they expect to be top-quartile performers at all stages of their journey – regardless of how that links to their desired destination.
What Is the Ideal Benchmark?
The best benchmark is one that is forward-looking and aligned to your financial goals. In a perfect world, every investor deserves their own framework to benchmark success, with transparency, measurement, and perspective all to be embraced. The challenge, of course, is that a forward-looking assessment is incredibly difficult to quantify, and there is no such thing as the “one-size-fits-all” approach. Benchmarking tools—such as those listed above—are powerful, but you cannot unshackle the backward-looking nature of them. What matters to an investor is whether their investment might be expected to help them achieve longer-term gains into the future. This mismatch requires care and highlights an important point around process versus outcome.
Specifically, it’s entirely possible to have a strong process (or a good decision) with a bad outcome, just as it is possible to have a poor process with a strong outcome. However, more often than not, a strong process will prevail and result in strong outcomes and vice versa. This is a key reason why we stress that people make comparisons over a longer time horizon — it allows the strength of the process (or the
combination of many decisions) to unveil itself.
To bring this to life, we can suggest a checklist to reinforce the link between goals and your investments. We split this into two distinct categories, where the idea is to first align your framework to your ambitions and then remove emotion from your appraisal process:
Checklist 1: Aligning Your Framework to Your Ambitions
- Is there a clearly-defined financial goal your portfolio can map to?
- Are you appraising your investment results over a suitable time horizon?
- If using an benchmark, is it realistic and investible?
- Do you need to account for inflation?
- Have you accounted for risk taken?
- Does your portfolio—as a whole and each position within it—stand up strongly in a forward-looking context?
Checklist 2: Avoiding Bad Decisions
- Can you avoid the recency bias (focusing beyond the recent past)?
- Are you aware of your own loss aversion (avoiding selling in a panic)?
- Can you avoid the overconfidence bias (by thinking probabilistically)?
All things considered, appropriate benchmarking is a powerful tool—both analytically and behaviourally. Done correctly, it can help investors stay on course and focus on the right things, but done incorrectly, it can have significant consequences. With this in mind, we leave you with a quote by Robert Shiller and wish you every success in 2019 and beyond.
The ability to focus attention on important things is a defining characteristic of intelligence. – Robert Shiller
This document is issued by Morningstar Investment Management Australia Limited (ABN 54 071 808 501, AFS Licence No. 228986) (‘Morningstar’). Morningstar is the Responsible Entity and issuer of interests in the Morningstar investment funds referred to in this report. © Copyright of this document is owned by Morningstar and any related bodies corporate that are involved in the document’s creation. As such the document, or any part of it, should not be copied, reproduced, scanned or embodied in any other document or distributed to another party without the prior written consent of Morningstar. The information provided is for general use only. In compiling this document, Morningstar has relied on information and data supplied by third parties including information providers (such as Standard and Poor’s, MSCI, Barclays, FTSE). Whilst all reasonable care has been taken to ensure the accuracy of information provided, neither Morningstar nor its third parties accept responsibility for any inaccuracy or for investment decisions or any other actions taken by any person on the basis or context of the information included. Past performance is not a reliable indicator of future performance. Morningstar does not guarantee the performance of any investment or the return of capital. Morningstar warns that (a) Morningstar has not considered any individual person’s objectives, financial situation or particular needs, and (b) individuals should seek advice and consider whether the advice is appropriate in light of their goals, objectives and current situation. Refer to our Financial Services Guide (FSG) for more information at morningstarinvestments.com.au/fsg. Before making any decision about whether to invest in a financial product, individuals should obtain and consider the disclosure document. For a copy of the relevant disclosure document, please contact our Adviser Distribution Team on 02 9276 4550.
Did you know 25 Australian Exchange Traded Funds (ETFs) have been terminated since 2013?
That is a big number considering Australia only has 181 Exchange Traded Products (ETPs), as listed on Morningstar’s database. It means about 12% of Australia’s ETPs have shuttered.
What does a termination really mean for investors?
The consequences of investing in a product that terminates are rarely disastrous in Australia, as generally the assets are sold off and investors receive their money back.
But there are some common downsides for investors:
- Even when an investor gets their money back, it’s inconvenient. It takes time and paperwork to return capital to investors
- Once you have your money back, the termination may have triggered capital gains, and transaction costs
- Small ETFs typically have higher bid-ask spreads, meaning it costs more to buy and sell
- If you want to reinvest the money elsewhere, this may involve further brokerage and other trading costs
So how can you avoid the Terminator?
There are no hard and fast rules for picking a termination candidate, but the following factors can provide a guide:
- Fund size
We think the number one factor in predicting which funds will close is the fund size. Of all of the closed ETPs in Australia, the largest – iShares Russell 2000 ETF (AU) – had AUD 72 million in funds under management.
ETF managers cite reasons such as changing market conditions, margin pressure, and so on. But ultimately, if the funds were large, popular with investors and profitable for the ETF manager, they probably wouldn’t be terminated.
- Age
When assessing fund size, it’s important to note that new ETFs are usually small because it takes time to build a track record, and attract customers and assets. The largest and most successful ETFs in Australia today were once new and small, so fund size and age should be reviewed hand-in-hand.
- Cost
Subscale ETFs usually have high management fees. While active investment strategies justifiably cost more than passive funds, high management fees undermines one of the reasons for investing in ETFs in the first place, which is their low cost.
- Investment strategy
Can the ETP can play a core role in a portfolio, or is more of a supporting player? In general, core strategies are less likely to be terminated, while niche strategies appear to be more likely targets for termination.
This doesn’t mean we think investors should avoid all niche products and tactical investments. But we recommend carefully considering whether a product suits their investment strategy and risk profile.
- Appeal
Even if you have a great investment idea, if an ETP doesn’t have broad appeal, it may not be around for your investment thesis to play out. Consider features like management costs, bid/ask spreads, portfolio turnover, distribution frequency and any tax complications, such as whether the ETP is cross-listed or locally domiciled.
Are ETPs Approaching Judgement Day?
While the number of terminations has ramped up in recent years, we don’t think closures signal that something significant has changed.
The sum of all shuttered funds at the time of their closure was only about AUD 186 million. Meanwhile the overall ETP market cracked the AUD 40 billion milestone in the third quarter. That’s about five times larger than five years ago.
The ETP market continues to benefit from structural tailwinds – such as low cost, convenience, transparency, and regulation that favours open architecture – which may even become more important in the wake of the financial services Royal Commission.
But the proliferation of products does mean investors need to become more discerning. Not all ETPs offer benefits in equal measure.
How to research ETPs
Morningstar currently publishes qualitative analyst research for 61 Australian ETPs, accounting for about 78.7% of invested assets. Existing clients have access to our ETPInvestor reports which provides analysis on the full universe of ETFs covered by Morningstar. If you’re not an existing client, you can try out our Adviser Research Centre portal here.

Jamie Wickham
Managing Director, Morningstar Australasia
Jamie leads the 150 financial services professionals who work here at Morningstar Australasia. He has over twenty years’ experience in the financial information and research industry, with management roles spanning product, operations, sales and technology.
Jamie is driven by our mission to help investors reach their financial goals.
Key Takeaways
- Explaining market sentiment may be clear in hindsight, but difficult to forecast.
- Predicting how macro issues will work out or how they’ll affect markets is next to impossible.
- Volatility can be upsetting, but selling after significant losses can be counterproductive.
- We believe valuations—not volatility—are the key to portfolio reallocations, although sometimes high volatility may open up a valuation-driven purchase.
Volatility returned in October, sending the equity market spiraling downward for a second time in 2018. Whenever this happens, investors naturally look for explanations for the downturn and wonder whether they’re in the right investments. We believe this response to volatility—although natural—is likely unhelpful.
Instead, investors are better served by putting recent market movements into the context of their long-term goals, in our opinion. For example, looking back a decade to the massive market decline of 2008, consider this question: Would an investor be closer to meeting their long-term financial goals by having sold out of equities after double-digit losses only to miss the rebound and one of the longest bull markets in history?
We believe discussing these types questions can be a much better reaction to market volatility than trying to understand every market move or selling to quiet fears.
Are the Good Old Days Over?
The good old days seem to be quickly sliding into the past. As recently as a year ago, markets were on a joyride. Ever-higher returns pushed painful memories of the global financial crisis further and further into the background. Even the U.S. market gained ground every month in 2017, delivering around 22% for the full year (in local currency terms).
The fear index, also known as the VIX or more formally the CBOE Volatility Index, rises during periods of market stress. But in 2017, the VIX couldn’t have been less scary, as it set record lows amid a seemingly ever-rising market. In fact, from January 1990 through December 2016, the VIX fell below 10 on nine days— nine days in 27 years!—but in 2017 it sat below 10 for 52 days so calm were the markets.
Volatility has clearly returned to markets in 2018. Earlier in the year, fears of rising interest rates and multiple trade conflicts set the market on edge. Investors continued to have confidence in leading growth stocks for much of the year until threats of stiffer regulations and the failure of a few internet darlings to live up to lofty expectations caused a dramatic rethinking of their worth.
If that weren’t enough, now investors can wrestle with slowing economic growth in China, the possible end of quantitative easing by the European Central Bank, and volatility caused by the U.S. midterm elections. If balancing all those risks to form a better forecast of how they’ll play out or affect markets seems like a tough job, we couldn’t agree more.
The Futility of Forecasting in Isolation
Clearly it’s hard to predict these issues in isolation. But in reality, these issues interact and evolve, and people react to them along the way, thus multiplying complexity and making outcome predictions next to impossible. We can’t know how today’s concerns might affect markets in the future. Take, for example, trade wars and tariffs, demonstrating how quickly investor sentiment can evolve.
Whether the market is—or will become—completely comfortable with the trade picture remains to be seen. Reaching a new North American trade agreement gave some relief, but progress has been elusive in talks with China—a situation that appears poised to potentially flare at any moment. But again, knowing when a flare-up might happen, how long it would last, and how it might impact markets strikes us as a monumental task.
We think there’s a better way to invest. Specifically, we don’t think every market hiccup needs deep analysis, nor do we believe in reading tea leaves. We prefer to focus our work on fundamental research, contrarian signals, and valuations. In the long term, investors get paid by the current and future cash flows of the securities they own. Being value investors, we seek to buy securities when prices are low compared to expected cash flows. This valuation work is the driver of our research, and it relieves us from becoming overly concerned about the next central bank rate decision or the outcome of an election.
So Should Your Clients React to the Spike in Volatility?
The short answer: No. The focus should always be on long-term valuations—the true and durable value of an asset class, rather than the volatility of its market price. Having a long-term perspective makes the next turn in the trade spat less concerning. Instead, we at Morningstar Investment Management ask, “How might this affect fundamentals over the next several years?”
Investors who trade on emotion and short-term market moves are more likely to sell after markets have gone down and buy after they’ve risen. We seek to do the opposite, in part by sticking to our principled approach to investing, which is designed to keep us rational in a sometimes-irrational world. In this regard, we are prepared to be buyers if and when valuations provide an attractive buying opportunity.
Key Takeaways
- Take economic forecasts with a grain of salt. They are often well-intended but can skew your view of investing.
- Try to see the markets upside down. This helps avoid short-term thinking and puts the focus on valuations.
- Historical comparisons are not a silver bullet, however can be useful in thinking probabilistically. On most valuation measures, the global equity market still appears on the expensive side.
- To reap the long-term rewards, we should try to resist getting scared out of an investment, instead positioning portfolios with valuation risks top of mind.
Few investors had the foresight in March 2009 to predict where we would be today after a nine-plus-year bull market. In fact, if you knew in 2009 what lay ahead, your level of disbelief may have been as strong as if someone told you in September 2017 that the market would soon lose half its value before turning around. This has many inherent lessons, but none more than the avoidance of short-term thinking and the power of starting valuations.
Lesson from the Decade Since the Crisis
Let’s rewind to March 2007 momentarily. This was considered to be a goldilocks period as the world looked as healthy as ever—although, as we now know, this assessment of economic health was grossly inaccurate. A false sense of prosperity can be illustrated in a myriad of ways, however one of the more compelling is to reflect on the March 2007 Monthly Bulletin from the European Central Bank (ECB)1. We have highlighted the key statements in bold:
Looking ahead, the medium-term outlook for economic activity remains favourable. The conditions are in place for the euro area economy to grow solidly. As regards the external environment, global economic growth has become more balanced across regions and, while moderating somewhat, remains robust, supported in part by lower oil prices. External conditions thus provide support for euro area exports. Domestic demand in the euro area is also expected to maintain its relatively strong momentum. Investment should remain dynamic, benefiting from an extended period of very favourable financing conditions, balance sheet restructuring, accumulated and ongoing strong corporate earnings, and gains in business efficiency. Consumption should also strengthen further over time, in line with developments in real disposable income, as employment conditions continue to improve.
Does this sound slightly familiar? We are not picking on the ECB—it was just one of many groups whose experts seemingly fell into the trap of the availability bias. The notion that we place too much emphasis on short-term trends is unequivocally important because it is one of the most common and recurring traits that cause financial market cyclicality. If you are not already cynical of short-term projections, maybe the ECB bulletin from the bottom of the market (February 2009) will also help:
The uncertainty surrounding the global economic outlook is exceptionally high, especially as financial market volatility has soared. Overall, the risks for growth are clearly on the downside. They relate mainly to the potential for the turmoil in the financial markets to have a more significant impact on the real economy. The depth and duration of the global economic downturn will depend crucially on the speed at which the financial crisis can be resolved. Other risks relate to concerns about the emergence and intensification of protectionist pressures and to possible disorderly developments owing to global imbalances.
Practically, this means being circumspect about what information we consume and how we consume it. It reinforces both the danger of paying attention to short term economic/market noise and the importance of being independently minded. It also highlights the benefits of viewing the world upside down.
The Power of Starting Valuations
Another lesson from the financial crisis is the power of starting valuations. To help illustrate this concept, on this occasion we ask readers to consider three valuation points: September 2007 (circa market peak), February 2009 (circa market trough) and again today.
Exhibit 1 The principle of buying low and selling high is evident in hindsight, the question is whether today marks a ‘high’ point or a ‘low’ point. See glossary for an explanation of each metric.
| Global Equity Valuation Metrics (includes developed & emerging markets) | 30th Sep 2007 | 27th Feb 2009 | 31st Oct 2018 |
| Price/Earnings Ratio | 16.32 | 9.37 | 17.06 |
| Cyclically-Adjusted Price/Earnings Ratio | 26.66 | 12.27 | 21.54 |
| Profit Margins | 9.32% | 7.04% | 8.80% |
| Dividend Yield | 2.18% | 4.33% | 2.58% |
| Return on Equity | 16.10% | 13.31% | 12.84% |
Source: Morningstar Investment Management Calculation, Morningstar Direct at 31 October 2018
We can see from Exhibit 1 that—on most valuation measures—the market is still closer to the 2007 peak valuation levels than the 2009 trough. Of course, the future carries a lot of uncertainty, yet can help an investor to think probabilistically.
The key here is to resist being scared out of an investment and instead position portfolios in a way that acknowledges valuations. When building portfolios, it is important that our investment team study market valuations and consider any dangers overvaluation may present.
Final Thoughts
If an investor can grasp these three concepts—avoiding predictions, thinking probabilistically and acknowledging valuations—they are arguably well on their way to achieving their financial goals.
Tying this together, here are a few other tips we think are relevant at moments like today:
- Remember that investing is best done as a long-term pursuit. The journey will inevitably have ups and downs, however staying the course should prove a fruitful experience.
- There are no silver bullets. By investing in a portfolio that is positioned for multiple outcomes, not just one, you can increase the chances of reaching your goals.
- True risk usually comes from the things we can’t see in front of us. The risks that are openly discussed in the media tend to be priced in by the market quite efficiently.
Similarly, our investment professionals continue to look at risk and return under a valuation lens, seeking to capture the long-term benefits of investing while keeping capital preservation firmly in mind.
Forecasting is a no-win situation. If you get it right, people go about their business. But if it’s wrong, you’ll hear nothing but bitter vituperation about the stupidity of forecasting models.
Part of the problem is that forecasting is innately regarded as an oracular art, a reading of tea leaves and sheep’s guts for a precise knowledge of the future. But forecasting models are statistical models based on historical data. In other words, the forecast is always conditioned on past data. If it’s never happened before, a forecasting model isn’t going to predict it. In that sense, forecasting models can be thought of as a more intuitive way of representing historical data. “How does this data impact me and my immediate concerns?”
Financial scenario analysis and stress testing sidestep some of the jeremiads against forecasting by clearly stating the conditions of the model. The “what if” in scenario analysis is explicitly, “What will happen to my returns if condition x is known?”
Not all methodologies for scenario analysis are the same
Scenario analysis and stress testing are essential tools for managing long-term expectations and exploring shorter-term volatility. They help tackle such questions as, “What will happen to my portfolio if the S&P 500 falls by 20% over the next year?” or “What if oil prices rise by 40% over the next four months?”
Morningstar has recently developed a suite of scenario analysis tools in the US (with intentions to roll out in Australia later next year), that provide three different approaches to interpreting how the past might provide insight into future returns. The tools include Historical Scenario Analysis, Macro-Financial Scenario Analysis, and Market-Driven Scenario Analysis. These models allow users to define one or multiple market shocks and then view the outcomes of such hypothetical events on factor exposures, portfolio returns, and volatilities.
We found that using more than one methodology for scenario analysis can validate our intuitions and outline the limitations of the assumptions of a given model. To illustrate this, we picked the oil shock of 2007-08 in which oil prices rose from $40 per barrel to just under $150 per barrel over 18 months and explored scenario analysis examples through the three unique approaches described above.
The results are published in the third edition of the Quantitative Analytics Quarterly, a publication in which Morningstar’s quantitative research team showcases their work on a regular basis.
3 Scenario Analysis Examples Explore the Impact of Constraints on Portfolio Returns:
Historical Scenario Analysis provides an excellent benchmark for assessing custom scenarios. If oil prices were to rise by 375% in the next 17 months, what is a plausible return outcome for the energy sector? The Energy Select Sector SPDR® ETF is run through Morningstar’s Historical Scenario Analysis tool and the cumulative return of 80% is plotted in the graph below. Given the magnitude and uniqueness of the 2007-08 oil shock, such a superior return is not surprising.
Macro-Financial Scenario Analysis is particularly useful when exploring the relationship between the market and macro-economic trends. For this scenario, the Macro-Financial Scenario Analysis model is shocked by the scale of the oil price rise from 2007-08. The nearly 60% cumulative return of this analysis for the energy ETF (shown in the graph below) is 20% less than the first analysis. In Historical Scenario Analysis, the assumption is that the event occurs in precisely the same way as it did in the past. Although the present may rhyme with the past in Macro-Financial Scenario Analysis, it’s not necessarily identical. So, the Macro-Financial Scenario Analysis produces the more likely result shown below rather than the extreme results shown above. 
Market-Driven Scenario Analysis provides the most statistically rich output but also requires careful consideration of model constraints. The Market-Driven Scenario Analysis tool allows users to shock an index and specify the percentile of the distribution to determine the risk and return to a portfolio through Monte Carlo simulations. The result of an oil price shock of 375% above the 95th percentile of the distribution is shown below. The cumulative return of the Macro-Financial Scenario Analysis is within one standard deviation of the simulated distribution while the cumulative return of the Historical Scenario Analysis is within approximately two standard deviations.

Given the same inputs, different models can produce significantly different results with each approach remaining methodologically consistent.