
Mark Delaney is the Chief Investment Officer of Australian Super.
There have been many times in the past 25 years when exposure to the information technology sector has driven strong returns or led to deep losses. It is a volatile sector. At Morningstar, we believe that investing for the long term and diversification are keys to success. The information technology sector exposure can be a potent catalyst for long-term wealth creation, offering the potential for lasting growth and innovation-led returns. The resurgent first quarter of 2023 for the sector has elevated investors’ exuberance for the tech-oriented thematic exchange-traded funds, as these ETFs have rallied so far this year through May 2023. However, investors should be wary of the historical volatility of the sector before jumping on the bandwagon. Notably, when equity markets globally were reeling under worsening macroeconomic conditions in 2022, IT stocks experienced a substantial decline (MSCI World Information Technology Index declined 25% versus a 12% decline for MSCI World Index), underpinning our view that thematic ETFs may not present a prudent and rationale investment case because of the concentration risk and volatility associated with this dynamic sector.
Instead, a more sensible approach to accessing the IT sector is through ETFs with better-diversified portfolios that favour the tech sectors. So, while investors may wish to pursue exposure to the technology sector, we consider doing so as part of an overall global investment strategy. Here are our picks of ETFs that provide significant tech exposure within their diversified portfolios:
These exchange-traded funds earn Morningstar Medalist Ratings of Silver and Bronze.
- iShares Global 100 ETF
- VanEck MSCI International Quality ETF
- SPDR S&P World ex Aus Carbon Control ETF
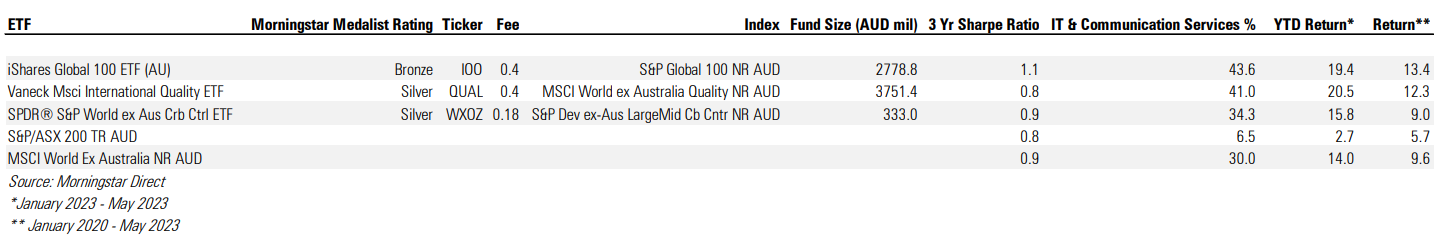
Let’s start with the Silver-rated VanEck MSCI International Quality ETF (QUAL). For investors seeking exposure to high-quality global equities, including a significant allocation to the tech sector at a competitive fee of 0.40% per year, QUAL is a strong choice. QUAL fully replicates the portfolio of the MSCI World ex-Australia Quality Index. This approach yields a portfolio that has notable differences with the MSCI World ex-Australia Index in two broad areas: It tilts toward more large-cap growth names and has different allocations to sectors and geographies. Technology and healthcare are overweight, while financials are underweight, as their leveraged balance sheets often do not fit the quality parameter of the strategy. We view this composition as sensible for diversifying a typical Australian core equity exposure portfolio, which is dominated by financials and materials stocks.
Our next ETF to highlight is the Bronze-rated iShares Global 100 ETF (IOO). IOO remains a solid choice for Australian investors seeking exposure to global equities. The fund tracks the S&P Global 100 Index, which consists of around 100 large-cap global equities from the S&P Global 1200 Index, maintaining a representative sector mix of the world economy. Allocations within the fund express sector tilt, particularly toward IT. IT and communications services together (around 40%) represent the largest allocation, followed by healthcare (12%), consumer staples (12%), and consumer discretionary (11%).
Finally, it is SPDR S&P World ex Australia Carbon Control ETF WXOZ that makes it to the list of our preferred ETF choices. WXOZ is a suitable option for environmental, social, and governance factor-oriented core global equity exposure, with tech sector inclination. The portfolio has a lower carbon intensity relative to the parent index (S&P Global Large Mid Cap Index) without losing its core features; it has an active share of around 30% and a tracking error ranging between 1.0% and 1.5%. WXOZ is well diversified, with almost 1,000 portfolio constituents, and the sector allocations are largely in line with the parent index. As such, the fund should mirror the parent index performance within a relatively low margin of tracking difference. The sector allocation comprises significant exposure to technology and healthcare—sectors that are underrepresented in the Australian market. All put together, for an increasingly efficient global equity market, WXOZ is an excellent choice considering its price advantage, liquidity, portfolio diversification, and track record of effective implementation. State Street charges just 18 basis points per year for this portfolio, easily making it a compelling ETF in the world large-blend Morningstar Category.
Innovations and Challenges
New tools for investing—such as online trading platforms, cryptocurrency, sustainability, private markets, and separately managed accounts with personalized direct indexing—have energized the investing landscape, garnering interest from both the technology and finance industries. With this new excitement, however, many may have failed to consider how investors are managing this onslaught of
new investing tools and to what degree these new capabilities promote investor success. In other words, we need to understand the relationship between investors, their long-term financial goals, and new investing tools.
In our research, we find the evolving investing landscape simultaneously presents advantages and pitfalls to investors. Although investors benefit from the expansion of investing opportunities and accessibility, they also struggle with old and new behavioral challenges sometimes exacerbated by new technology. It is worth remembering that investing tools are a means to an end. And, with any new
extension and increased capacity of technology, there is still a human being grappling with how to use available means to achieve their goals.
Key Takeaways
- Investor goals have remained fairly consistent in that building a safe and secure retirement, owning a home, paying for children’s education, and building both lifestyle and legacy have remained priorities. Investors are motivated by these powerful, long-term goals; however, goals are often neglected when touting the strengths of new tools.
- The potential of new tools is palpable, and we are just scratching the surface of understanding investor preferences for and interest in these new investment tools and capabilities. On the other hand, some preliminary evidence suggests investors may be engaging with these tools in a way that inhibits progress toward their financial goals due to poor choices driven by familiar pitfalls.
- Collectively, our research on how investors are managing new investing tools calls on the industry to reframe our focus as we introduce these tools to investors. Instead of focusing on the potential capabilities of every new tool, we should focus on how those capabilities can help a person realise their financial goals.
The tools for investing are evolving quickly; investors are not
The investing landscape is rapidly changing. Retail investors are presented with a growing number of assets available to them, like cryptocurrency and private equity, along with new opportunities to manage their holdings, like direct indexing and online trading platforms. Some of these developments are well-known to the public given their starring role in viral moments, such as online trading platforms and cryptocurrency, but retail investors must also grapple with less-viral developments to investing that are part of the shifting landscape. For example, Fidelity, Schwab, and Morningstar have launched direct-indexing solutions with far lower minimum investments than previously required for direct-indexing services (just $5,000 in the case of Fidelity), opening the door for greater portfolio personalisation and tax management to many investors. Relatedly, the proliferation of ESG investing has allowed investors to align their investments with their values and to evaluate the risks of their investments with a broader lens. Finally, retail investors have increasing access to private markets, through both the new possibility of including private equity in 401(k) plans in the U.S. and increasing access to relevant data and opportunities.
Investor goals endure
The technology and financial industries have poured significant resources into developing these new tools, but tools do not exist for their own benefit. Tools should help people achieve a goal they have in mind. Fortunately, the financial industry has little to do by way of guessing what goals investors care about, given there is plentiful research on the topic. By and large, investors have the same goals as ever:
to build a safe and secure retirement; to own their own home; to pay for children’s education; and to build both lifestyle and legacy.
Additional research has uncovered other goals that crop up alongside these main goals, such as giving to charitable organisations, consistently funding leisure interests, and engaging in hobbies more meaningfully. Overall, the picture that emerges from this collection of
research is that people see investing as a means to fund their future lives, both how they live them and the kind of legacy they leave behind.
Investors are motivated by these powerful, long-term goals; however, goals are often neglected when touting the strengths of new tools. Although financial professionals may see a connection between the benefits of new tools and investors’ goals, it is unclear if individual investors see the same connections—which brings about the question, how are investors engaging with these new tools? Moreover, are they reaping the benefits of these new investing opportunities and connecting them back to their goals? Or are they struggling with both new and old behavioral challenges, amplified by the speed, power, and complexity of new innovations?
Investors are benefiting from the evolving investing landscape
New tools are opening doors
Some preliminary evidence suggests investors are engaging with innovations in ways that help them move toward their financial goals. For example, auto-enrollment in employee retirement plans has dramatically increased the number of participants, with a Vanguard study reporting an increase in enrollment of 63% in their own 401(k) program. Additionally, online trading platforms have provided a
lower barrier of entry for potential investors and allow them to take a more active interest in their portfolio. Morningstar research found online trading platforms are also bringing investing to different people than more traditional avenues, attracting younger investors and more minority investors. Additionally, investors who use trading platforms were more likely to trade a variety of assets than investors who do not use trading platforms—not just stocks (91% vs. 63%) but also ETFs (52% vs. 36%), crypto (70% vs. 24%), and options (26% vs. 17%). This suggests online trading platforms engage new investors and encourage them to explore a variety of asset classes and strategies.
Some investors do have long-term goals in mind
Subsets of investors are connecting new investing tools to their financial goals. For example, although crypto is a hot topic, more than half of crypto investors report their interest in the asset was spurred by their desire to make good long-term investment decisions, and a third of respondents report using crypto as a diversification tool.9 Additionally, some investors are using online trading platforms for more than
the short term; 18.6% of online investors reported investing money they expected to need in the next five years, and 37.2% reported investing money they expected to need within the next 10 years or later. These findings suggest there is a sizable subset of investors who recognise these new tools can help them invest for their future goals.
New tools make greater personalisation possible
A growing number of investors also recognise new tools can help them use their money in ways that align with their values. For example, many high-net-worth individuals see private capital as an avenue for impact investing (that is, making investments geared toward measurable social/environmental impacts along with financial returns).11 Retail investors are also interested in the opportunity to have
their investments reflect their values. A Morningstar study investigated whether investors would incorporate ESG information into their investment decisions during times of an intense market downturn and found that investors were willing to invest more money in funds with better ESG scores, even during weeks of whipsaw volatility.12 This tendency reflects broader trends in the industry and an increased interest in ESG investing, with recent research putting the number of investors interested in ESG investing at about 70%.
We are just scratching the surface of understanding investor preferences for and interest in these new investment tools and capabilities. Investors’ use of these tools is promising not just for an industry betting on them but also for investors themselves. Recent years have shown the power of personalisation on people’s behaviors. People may be attracted to portfolio personalisation not only because they have grown accustomed to such treatment in other domains but also if they can see how personalisation helps them achieve their goals—especially since personalized goals are associated with better goal adherence and goal-striving behavior.
As such, investors can create a financial plan that fits with their values, interests, and goals, which may also help them persevere and stay the course over the long haul.
However, investors are falling into familiar pitfalls in new ways
On the other hand, some preliminary evidence suggests investors may be engaging with these tools in a way that inhibits progress toward their financial goals due to poor choices driven by familiar pitfalls. For example, although investor knowledge gaps have always existed,15 they may now impede investors from realizing the value of new investing tools. Furthermore, some tools may increase investors’ vulnerability to decision-making biases,16 making it easier for financial mistakes to be made.
Investor knowledge gaps get in the way
Direct indexing is becoming widely available thanks to new technology. Though direct indexing offers advantages, a study from Morningstar17 found investor knowledge gaps may prevent some investors from recognizing all that direct indexing and portfolio personalisation have to offer. In the study, investors rank ordered benefits of portfolio personalisation based on their perceived importance.
On average, investors gave top rankings to items such as “Achieving my financial goals” and “Tailored to my personal circumstances” but gave tepid rankings to offerings related to ESG, reducing fees, and tax management. This finding is concerning for fee and tax management, as investors may be failing to recognise the enormous impact these two items can have on reaching their financial goals. In other words, it’s not that these features aren’t important; it might be that investors may fail to connect these offerings to their goals and, thus, undervalue them. Therefore, investors may benefit from guidance on how new tools serve their enduring goals.
Shining a spotlight on our biases
Choice overload, preferences, and action
ESG data offers a relatively new lens for investors to evaluate and understand more about risk and impact. Yet, ESG is not for everyone. Plenty of investors shun the idea of ESG and ESG ratings and dislike when such information is made available to them.18 Still, some investors want to inform their investment choices with ESG data but struggle to turn motivation into action. Morningstar research19 has uncovered a persistent gap regarding ESG investing. The study found 13% of investors reported holding ESG-related investments. However, another 29% of investors believe company-level ESG policies should be “fairly important” or a “very important” factor in investing despite not having ESG holdings themselves. Although interest in ESG is high, people are not always translating their interest into action. A possible explanation20 for this gap is investors are facing choice overload, which cannot be solved by more data. Rather, investors need help understanding what available data means for them and how to translate their preferences into high-quality portfolios.
Lower barriers to actions, lower barriers to mistakes
Online trading tools have made investing more accessible than ever, leading to a recent uptick of new investors. More people benefiting from the power of investing is a good thing; however, online trading tools can also facilitate investors making well-known mistakes. For example, the ease of trading a stock online may be dangerous given previous research, which found individual investors with high trading
volume pay a substantial performance penalty. Morningstar research found online investors were twice as likely to trade one or more times a week than non-online investors,23 and supporting external research found trading volume generated by individual investors has almost doubled since 2010.
Additionally, investors report motivations for making a trade that points to the role of behavioral biases in their financial decisions. For example, 48% of online investors25 showed signs of returns-chasing, a common consequence of recency bias (that is, the tendency to overweight recent events), reporting they made a trade because they thought it would “make me a lot of money.” Investors’ financial decisions may also be getting derailed by herding behavior (like the tendency to follow whatever the crowd is doing); 19% of online investors mentioned making a trade because “lots of people were talking about it” versus only 6% of non-online investors.26 In a separate study, 44% of “meme” stock investors reported “they didn’t want to miss out on the action”—a clear sign of regret aversion (that is, the fear of missing out by not acting even when the wisest move is to stay put and do nothing). All these biases swirl together to form a perfect storm when fanned by media and online forums and facilitated by apps that reward speculation over sound evaluation. As a result, investors get ensnared in well-known decision biases that usurp prudent judgment.
Online accounts also allow more investors access to sophisticated investing vehicles, such as options, leverage, and short-selling. However, investors may be overconfident about their knowledge of more complex financial instruments. In a study conducted by FINRA, 62% of option traders were unable to answer a basic question related to options trading and were less likely than investors who did not trade options to admit they didn’t know the answer. Investors who purchased options were both less informed and more confident—a dangerous combination that can lead to poor risk management. Sophisticated investing innovations are just tools, and in the right hands, they can be powerful components in an investment strategy; in the wrong hands, these tools provide painful examples of the Dunning–Kruger effect, where people do not know what they do not know, yet presumptuously plunge ahead with bad consequences.
Although investors have always been subject to cognitive biases—such as overconfidence, recency bias, confirmation bias, and regret aversion—online tools have reduced guardrails that may have prevented investors from acting on those biases. Based on investor behavior and motivations in online tools, many investors need help managing their biases and these new tools make that more challenging.
Conclusion
Collectively, our research on how investors are managing new investing tools calls on the industry to reframe our focus as we introduce these tools to investors. Instead of focusing on the potential capabilities of every new tool, we should focus on how those capabilities can help a person realise their financial goals. We must also guide investors by veering them away from well-documented behavioral
mistakes. For example, nudging them away from excessive trading via reminders of potential tax consequences28 or emphasizing progress toward goals rather than recent short-term market behavior.
The evolving financial landscape presents investors with a variety of new investing tools, some easy to use with only a few clicks, anywhere anytime. However, as these new tools/means are developed, it is worth remembering that investors need help connecting their choices today with their goals/ends. Though there are clear benefits new tools can provide (diversification, tax management, low fees, transparency), the evolving landscape can exacerbate well-known behavioral pitfalls as well. The connections between investment capabilities and investor goals need to be illuminated and reinforced by independent voices that value investor success over fomenting frenzy and exploiting foibles.
As expected, the US Federal Open Market Committee (FOMC) drew breath keeping the federal funds rate unchanged at 5.00%–5.25% at its 14 June meeting, the first pause since the tightening cycle began on 16 March 2022. However, chairman Jerome Powell stated at the post-meeting press conference the July meeting was “live” and the updated dot plot revealed further hikes are likely (Exhibit 1). The pause decision came a day after the May CPI data.
Exhibit 1: FOMC participants’ assessments of appropriate monetary policy: Midpoint of target range or target level for the federal funds rate (%)
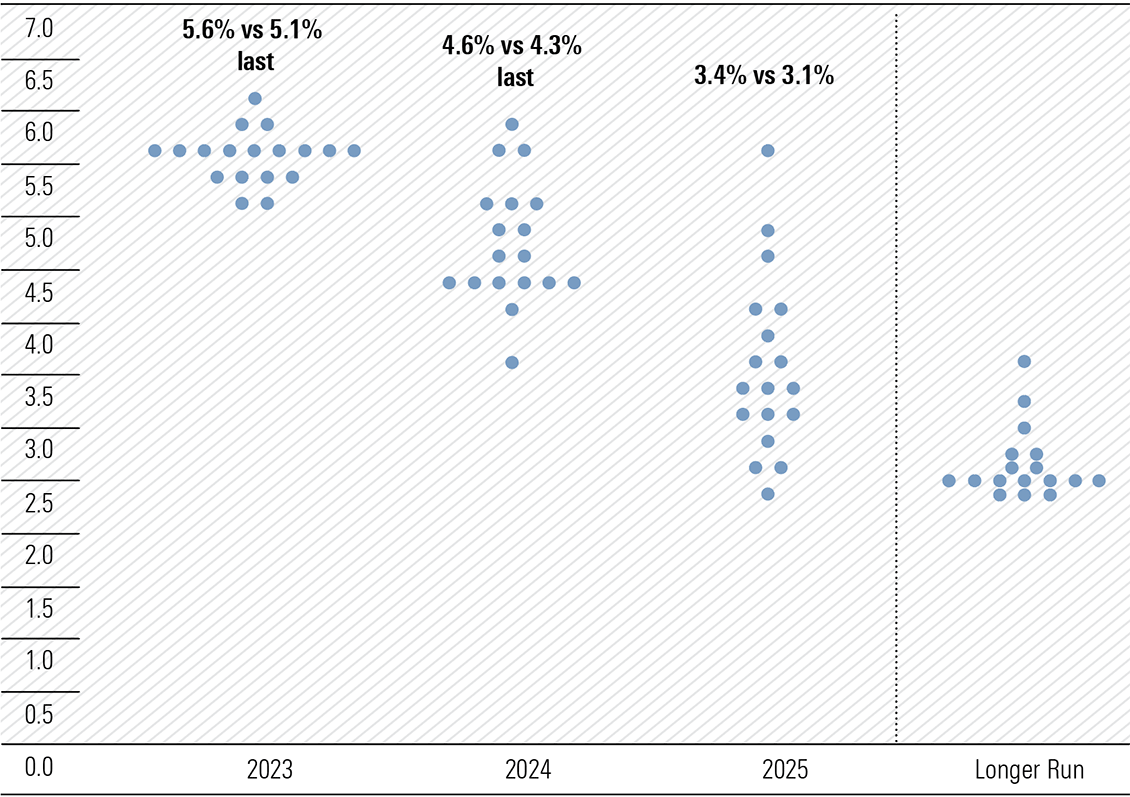
Source: US Federal Reserve
The Fed’s dot plot is a chart that records the projection of each FOMC member for the midpoint of the federal funds rate at the end of each calendar year for three years, and longer term. The current dot plot has the median rate at end 2023 at 5.6%, for 2024 4.6%, and 2025 3.4%, respectively. They reflect upward changes from March of 5.1%, 4.3%, and 3.1%, respectively.
Delving further, nine of the 18 members project a further two 25-basis point increases by year end, dominating the near term, and only two indicate no change. Clearly a hawkish bias dominates the thinking of the FOMC. It can only reflect anxiety and uncertainty around being able to drive the core CPI from the current 5.3% well into the 3% zone. Remember further rate hikes are predicted, despite the forecast of real GDP growth of 1% for 2023 and 1.1% in 2024.
The US economy, like others, is teetering on contraction in the back half of 2023. Further rate rises are almost certain to deliver a contraction. Meanwhile, financial markets will have to deal with the US Treasury issuing up to US$1 trillion in new Treasuries and other securities by the end of 2023 following the lifting of the debt ceiling until January 2025. Liquidity in the financial system is about to be meaningfully reduced, and in addition to the Fed still trimming its balance sheet under the quantitative tightening program.
There were no surprises in the US May CPI data with the inflation rate continuing to ease. Both headline and core readings were in line with expectations and equity markets moved moderately higher, as no demons emerged to push the FOMC to raise the federal funds rate.
Initially, bond yields fell on the release, but rebounded to close sharply higher, particularly at the shorter end, as the curve flattened. The 2-year yield traded across an intraday range of 4.45%-4.71%, closing at 4.67%, with the benchmark 10-year yield falling below 3.70% before closing at 3.81%. The 2/10-year spread widened to a negative 86-basis points.
Headline CPI rose 0.1% month-on-month (m/m), down from the 0.4% increase in April, marking the 11th consecutive monthly decline. The 4.0% year-on-year (y/y), which was down sharply from April’s 4.9%, is a far cry from the 9.1% peak in June 2022. The decline was helped by a 5.6% fall in gasoline prices after a 3% increase in April and the base effect from a high reading in May 2022, with the latter also providing downward influence in June. A 4.4% spike in used car and truck prices in the month was the only meaningful rise.
At the core level, excluding food and energy, the index rose 0.4% m/m, the same as April and March, and by 5.3% y/y and a much more subdued move downward from April’s 5.5%. It has been a slow grind to get the core down from 6.0% a year ago.
Exhibit 2: 12-month percent change in CPI for All Urban Consumers (CPI-U), not seasonally adjusted, May 2022 – May 2023 (% change)
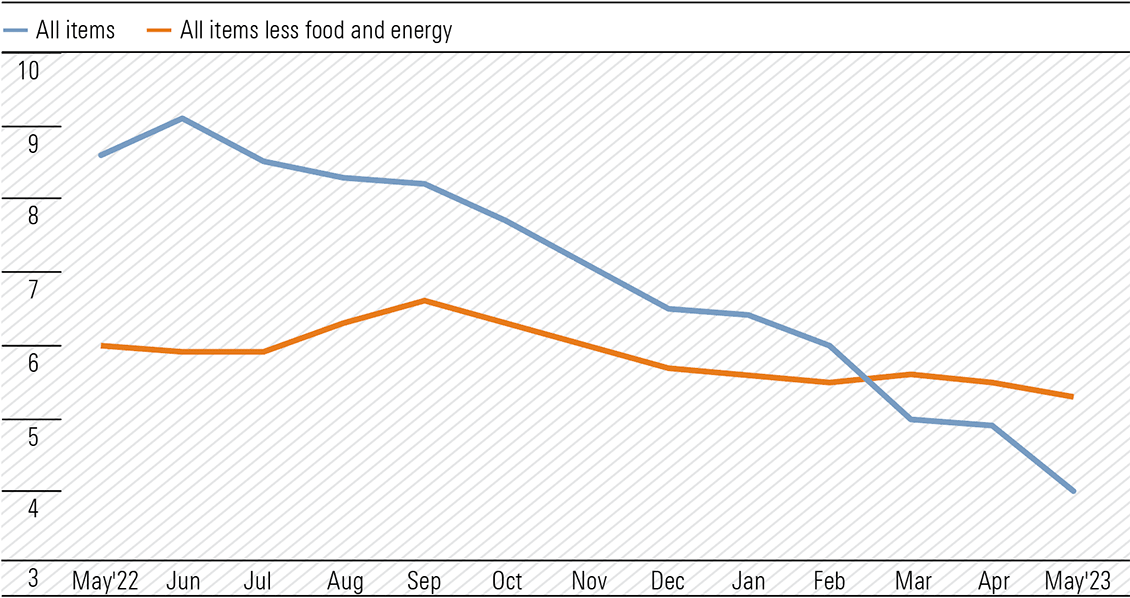
Source: Bureau of Labor Statistics
While the trend is certainly encouraging, the core reading is still too high and remains well above the Fed’s desired level. The Fed’s target is 2% for the preferred core Personal Consumption Expenditures (PCE) index and it is still far too early to claim mission accomplished in the two-year battle against what was initially tagged as transitory inflation.
Commentators pointed to narrower core readings providing optimism. Core, excluding shelter and used car and truck prices, rose 0.1% m/m and by 2.3% on a three-month annualised basis, with suggestions subsequent lower auction prices will remove used car and truck increases in June. A 10.2% increase in transportation services was the largest annual rise, beating an 8% lift in shelter. Core, excluding everything, was unchanged!
US productivity also on the nose
It appears Australia is not the only country with a labour productivity problem. In 1Q23, US nonfarm business sector labor productivity declined 2.1% as output increased by 0.5% and hours worked increased by 2.6% from 4Q22. In 1Q22 productivity declined by 0.8%, reflecting a 1.4% lift in output and a 2.2% increase in hours worked. The Bureau of Labor Statistics reported the productivity decline “is the first time the four-quarter change series has remained negative for five consecutive quarters”, marking the longest period of contraction since the series began in the first quarter of 1948.
Exhibit 3: Labor productivity, nonfarm business, 2019Q1 – 2023Q1 (% change)
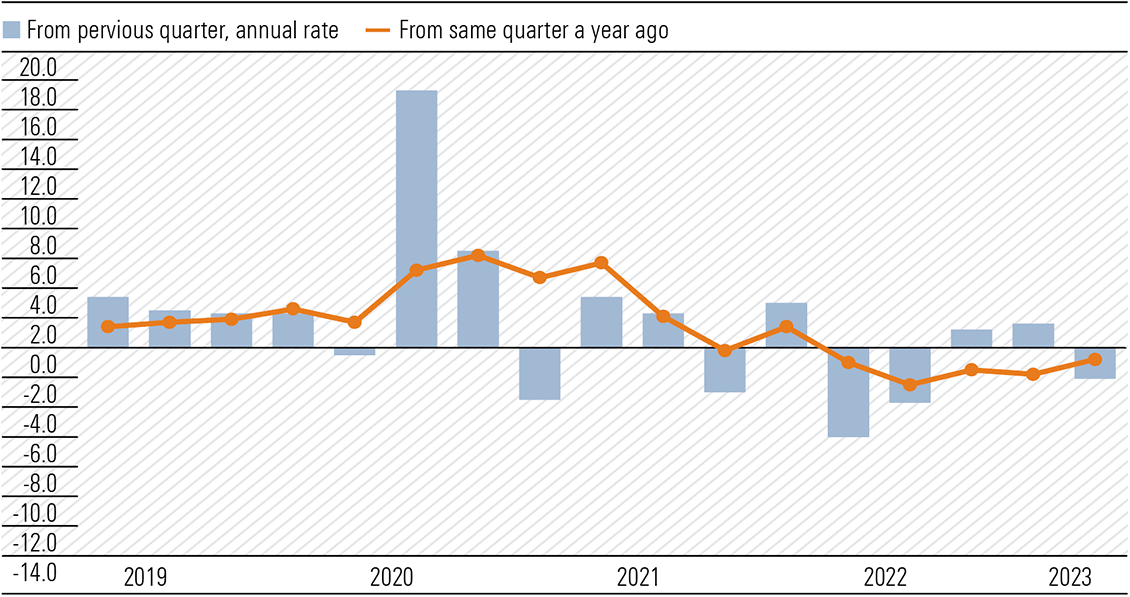
Source: Bureau of Labor Statistics
US credit crunch starts taking prisoners
Aggressive cumulative interest rate increases of 5.00% are finally taking a toll as a credit crunch looms. Defaults of a not inconsiderable US$21bn have occurred in the first five months of 2023, with the monthly rate accelerating to US$7.8bn in May. The cost of servicing leveraged/floating rate loans taken out by high-risk companies when the federal funds rate was near zero have reached breakpoint. The chances of refinancing these junk-rated loans are also probably zero. This, as credit availability is contracting rapidly. Investors who purchased these “collateralised loan obligations” are looking over a cliff.
The latest quarterly Fed Senior Loan Officer Opinion Survey (SLOOS) on Bank Lending Practices revealed lending standards had tightened across all institutions and across all lending categories—commercial and industrial as well as household loan instruments including mortgages, home equity lines of credit and credit cards. The tightening was in the wake of the problems that unfolded in the regional banking sector following the failure of Silicon Valley Bank and Signature Bank and the rescue/sale of First Republic Bank. Internationally, Credit Suisse morphed into Debit Suisse and was swallowed at an apparent bargain price by UBS. The holders of Credit Suisse hybrids saw their investment evaporate.
Recall in March, the Fed’s in-house economists warned tightening credit conditions alone would likely cause a shallow recession. The next SLOOS report is due early August, and the picture will have only darkened.
Australia’s consumer sentiment bottoming?
The Westpac-Melbourne Institute Consumer Sentiment index is showing signs of bottoming around the lows reached in 2022 and those of the late 1980s-early 1990s recession. The index edged marginally higher from 79 in May to 79.2 in June. The survey was taken between 5-9 June and while improvement is encouraging, there was a sharp decline in confidence from respondents after the Reserve Bank’s rate hike on 6 June. Clearly, the surprise element in the timing of the increase and the subsequent hawkish tone of RBA governor Philip Lowe’s commentary hit home.
Additionally, there was a meaningful lift in unemployment expectations, with the sub-index lifting to the highest level since September 2020. Given the traditional lag effect, the unemployment rate could move sharply through 4% by early 2024.
Exhibit 4: Unemployment expectations rose sharply
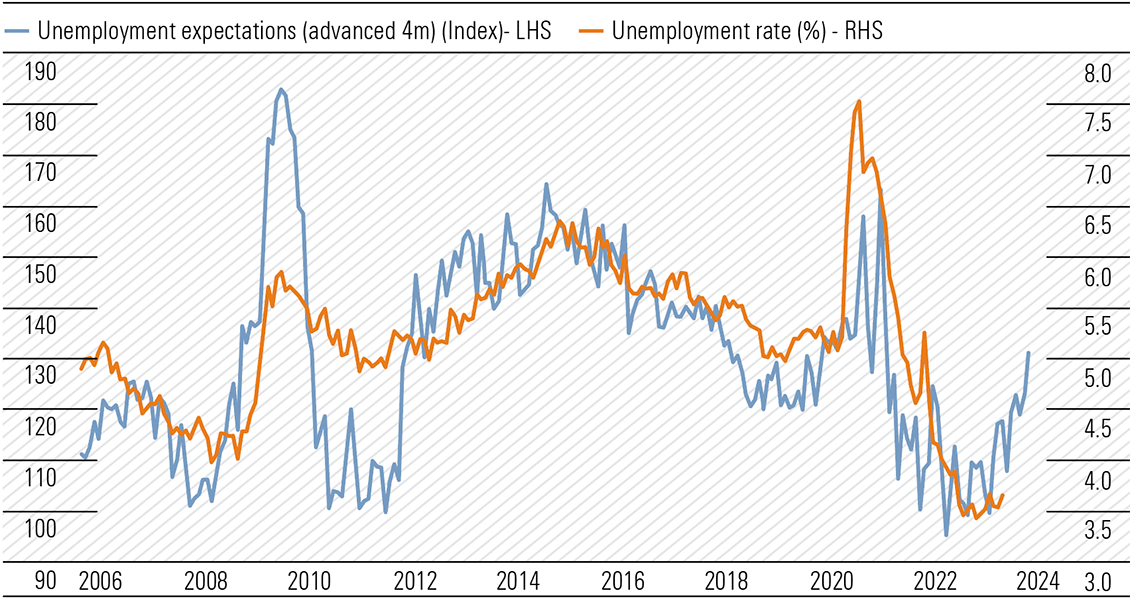
Source: National Australia Bank, Macrobond
While absorbing this information, today’s Labour Force report for May completely blindsided markets. In seasonally adjusted terms, employment increased by 75,900 after a loss of 4,000 in April. Full-time increased by 61,700 and part-time by 14,300. The unemployment rate fell from 3.7% to 3.6%. Consensus forecasts were for employment to increase by 17,500 and an unchanged unemployment rate of 3.7%. The participation rate moved higher to a record 66.9%. Monthly hours worked were 4.8% above May 2022 levels. I suspect output lagged the increase in hours worked.
The Reserve Bank is at the mercy of incoming data. The May Labour Force report and the tightness of the labour market leaves it with little option but to hike in July to 4.35%. Employment growth is underpinning household income and supporting consumer spending which adds to inflationary pressure.
To get the inflation genie back into the bottle we will have to see a change in the mindset of consumers, and it will probably require a deeper recession than currently anticipated. The only way to reverse the decline in living standards must come from a meaningful improvement in labour productivity—to lift output at a faster rate than hours worked. It includes all workers in all sectors of the economy, both public and private. A reality check could be around the corner should the unemployment rate spike. The fear of losing your job should alter behaviour.
Monetary policy is trying to slow the rate of growth in aggregate demand. It appears fiscal policy is not supportive. The Queensland budget’s hand out $550 to every household, reminiscent of Kevin Rudd’s $900 for all, dead or alive, is an example.
Interesting times ahead and I remain cautious.
Observations
Alan Finkel, Australia’s chief scientist from 2016 to 2020 has just released his book ‘Powering Up: Unleashing the Clean Energy Supply Chain’. An insight was provided in The Weekend Australian’s Inquirer June 10–11 with a headline ‘Crazy Brave World of Green Power’. It is a must read. Finkel is not a shock jock. He is a realistic electrical engineer and a neuroscientist and is now the chairman of the government’s Technology Investment Advisory Council. His vision of the future—“Think forests of wind farms carpeting hills and cliffs from sea to sky. Think endless arrays of solar panels disappearing like a mirage into the desert.”
Finkel pointed to the mining on a vast scale (and the energy required to do so—my comment) to supply minerals for batteries and solar panels; factories to manufacture wind turbines; endless kilometres of transmission lines to connect to consumers; and financing on unprecedented levels as hurdles to recognise and overcome. “Converting an energy system nourished by fossil fuels to one based on wind and solar is a task of barely imaginable proportions. We have to get off oil, coal and gas, but it is a serious challenge—anyone who thinks it is easy is not appreciating the complexities of what’s being done here.”
Finkel correctly opines, if Australia ceases exporting coal and gas, it won’t make any difference at all to the use of oil, coal or gas in other countries. He adds while coal-fired plants have no future, closing them down prematurely before formed solar and wind generation is built risks extended blackouts. “That would not just be a disaster for modern life, it risks rescinding the social licence for moving as fast as we can to get to net zero.” But our ambition must be reconciled with reality. Almost 60% of Australia’s electricity generation comes from coal, “shutting it down immediately is not an option.” Natural gas-fired electricity will have a role as last resort in supporting solar and wind long after coal-fired generation ceases. Sounds like well into the 2040s.
Origin Energy’s (ASX:ORG) CEO Frank Calabria provided a frank wake-up call on Australia’s energy transition agenda while calling for an “honest” discussion between stakeholders on the need for new gas power. Delays in the massive expansion of the transmission grid are the biggest single issue in achieving targeted emission goals. To put the required 10,000 kms of additional transmission capacity in context, it is over three times the distance from Cape York to the most southern point of the Australian mainland at Wilsons Promontory. Getting landowner permission and then building the footprint in seven years is not going to happen. It reminds me of classic Australian film The Castle and the purchase of Bonnie Doon at a bargain price, due to the overhead transmission power lines traversing the property, and then lines “How’s the serenity, so much serenity”. Australia will have so much serenity it could become a major export.
Check this out. A quotation from a well-known Australian insurance company for the renewal of Owners Corporation Building Insurance. The four-apartment building had its certificate of occupancy issued on 1 April 2022. It stated premiums are generally affected by increases in the Building Sum Insured as well as the claims history of your building. “Generally, insurance premiums have been increasing by between 15% to 20% annually, however with the recent extreme weather events, insurers are preparing their clients for increases as high as 40% over the next 12 to 18 months. This is also largely due to the number of large insurance events over the last decade. It quoted seven events dating back to Brisbane Floods 2020/11 and Cyclone Yasi 2011 to Eastern Australia Floods in both 2021 and 2022. I presume as Australia transitions to zero emissions, the incidence of natural weather hazards will fall significantly, as will insurance premiums. And if you believe that you also see the fairies at the bottom of the garden. But the pigs won’t be flying due to the danger from rotating wind turbine blades.
Shell Plc (LON:SHEL) has increased its dividend by 15% and interestingly will boost natural gas production with a refocus on fossil fuels that drove the record profits in 2022. The oil major will expand the most profitable parts of the business, even if they are carbon intensive, but management reiterates its pledge to achieve net-zero emissions by 2050. You can have your cake and eat it. Natural gas is the most effective transition energy fuel in a nuclear-free environment. In Australia, gas is currently performing as a base load energy source. So-called peaking stations are running 24/7 to ensure reliable supply.
For financial advisers to use with clients. Feel free to copy, paste, then edit as desired.
The text is intended to support your service proposition to clients. It is produced by our investment writers with a deliberately light tone and structure. However, these are guidance paragraphs only. It is not guaranteed to meet the expectations of regulators or your internal compliance requirements. If you wish to remove or amend any wording, you are free to do so. However, please bear in mind that you are ultimately responsible for the accuracy and relevance of your communications to clients.
Dear client,
It has been said we’re investing in a period we haven’t witnessed in over 15 years. Some like that we’re moving away from the “free money” era, while some are concerned about the adjustment. We see both sides to this argument, but we maintain a positive view when taking a longer-term perspective. As such, we share some insights below.
Current Backdrop & Key Observations
Like always, we must assess the market environment around us. This is not something we can control, but we can seek to understand it and the opportunities that are available. We do this with the support of Morningstar Investment Management.
Below is a series of recent developments:
- Due to sticky inflation post-covid, interest rates have increased quickly, pressuring many households and businesses alike.
- Higher interest rates mean better cash rates for savers, but also higher interest rates for borrowers. As fixed rate loans mature, many are seeing sharp increases in their debt repayments. The old “pay down debt vs invest for growth” conversation is back, which is something we can certainly help with.
- Economists now expect rate cuts as the consensus, with most believing we’re very close to peak rates. These rate cuts are expected to begin later this year.
- Stocks have been oscillating, while people weigh two opposing forces: 1) better valuations are available for long-term investors and may stand to benefit when interest rates start falling, and 2) recession and inflation pressures remain, with potential volatility for investors with a shorter-term mindset.a
- Among defensive assets, bonds and cash rates have improved, so we don’t have to work as hard to find decent cash-producing opportunities. In many cases, investment yields can still exceed debt costs.
How to Act During This Period
For assets matched to longer-term goals, we see merit in continuing our measured and positive approach. That is, we want to retain the ability to potentially drive healthy long-term outcomes, so keeping money at work in a diversified portfolio makes sense, especially with a valuation focus. We share a few reasoned thoughts to support this:
- Higher interest rates have resulted in better yields becoming available for many assets. By holding assets with strong durable income generation, we can benefit from this market shift and reduce the capital gains hurdle required to grow your portfolio.
- Valuations are supportive of investment. The markets aren’t running hot, by large, so potentially offers a solid foundation for returns.
- To offset some shorter-term risks, such as the U.S. debt ceiling or a potential recession, we’re holding defensive assets that can offer a ballast. Given the higher yields available among these defensive assets, this could offer some peace of mind.
Risks We Are Working to Mitigate
We believe the above approach makes sense for you in this environment, however we also acknowledge that we operate in a world of uncertainty. Below are some of the potential downsides that could occur:
- If we see large-scale volatility, your investment mix could still fall in value. It has the potential to hold up better than the overall market, but we might see shorter-term falls.
- The proposed holdings are diversified and liquid in nature, but we can’t rule out some assets falling more than the market. We don’t expect material liquidity or default issues though, given the diversified approach.
- If the recessionary concerns come to pass, we may find ourselves slightly on the back foot, not growing as quickly as the broader market. That is, riskier assets may excel, which could leave us lagging in a big upswing. This is a trade-off we are broadly comfortable with, balancing risk and reward, but is worthwhile noting.
No Action Required, But My Line is Open
If you are comfortable with the above, you don’t need to do anything. We will keep working on your behalf. That said, we want to make sure you’re comfortable, so if you have any questions regarding any the above, please don’t hesitate to reach out.
Kind regards,
Adviser
Four investors walk into a bar and start having an active discussion about the state of the global economy and markets. The debates were almost as noisy as the group playing a game of darts next to them.
One of the patrons sitting nearby couldn’t help eavesdropping on the discussion and made his way over to the group. The investors were visibly shocked and surprised to see this character wishing to join their company.
The four investors introduced themselves to the new patron as Annie, Bridget, Charlie, and Don. The patron introduced himself as Mr. Market.
Naturally, the investors couldn’t hold themselves back from asking Mr. Market for his perspective on their discussions about investing. The group was debating which one of them would be right about the future.
Mr. Market understood that investors have different views of the markets and global economy, but he wanted to show them some simple tricks to navigating rocky markets.
The group then asked Mr. Market a few questions.
How often does Mr. Market go down?
That is purely dependent on the time horizon or investment period used to measure it.
History has shown that the potential for a negative return diminishes as the time horizon gets longer. The longer the frame of measurement, the more time for an investment to compound its returns.
The chart below illustrates this concept using the past 30 years of returns over different time horizons.
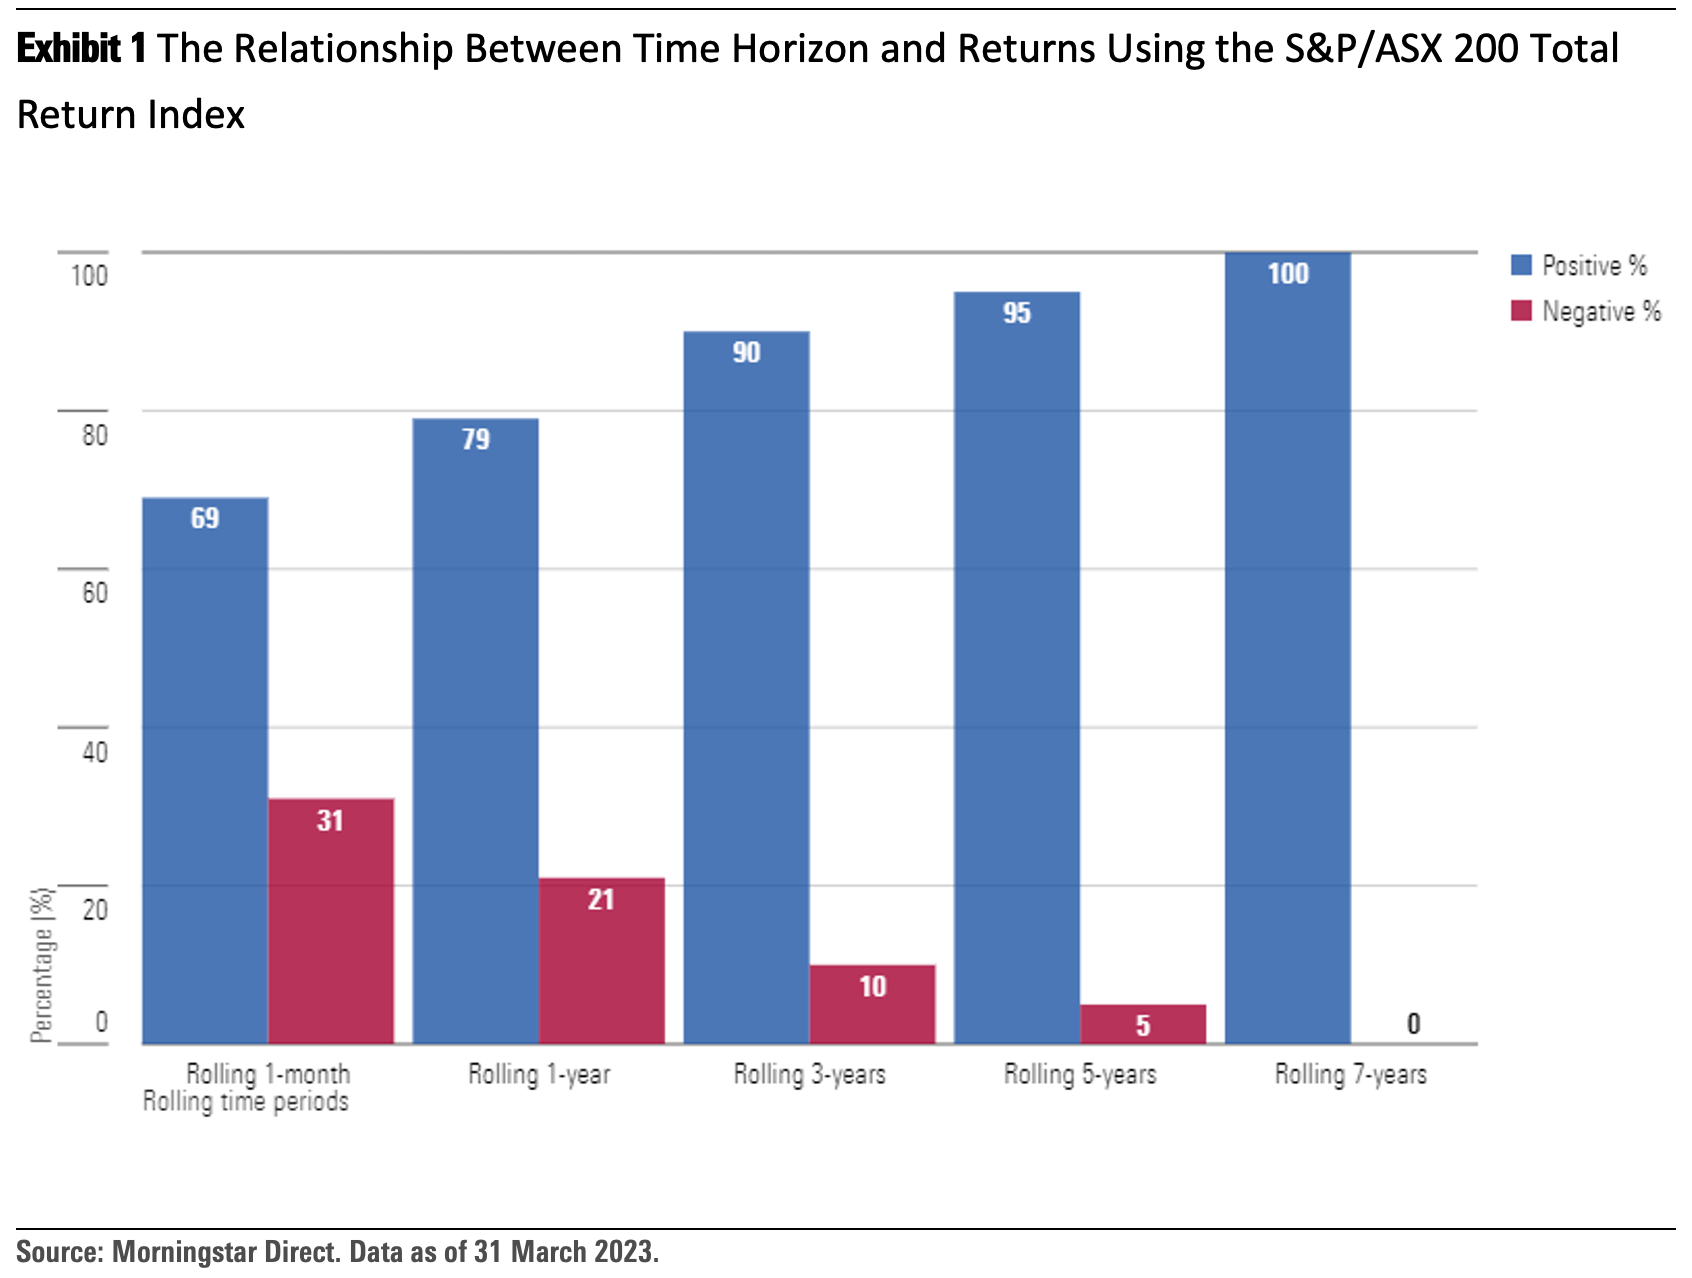
The link between the investment horizon length and the potential for negative returns is quite apparent, especially over the seven-year rolling period—there were no negative returns over any rolling seven-year period in the past 30 years. We do not have certainty that any of the future seven-year rolling periods will be positive, but it does illustrate the historical link between the investment horizon and positive returns.
What drives growth in the market over the long term?
The market is made up of companies that are producing and selling a product or service.
Companies that are well-run and well-capitalised to reinvest in their businesses have a higher chance of success over time.
These companies produce earnings, which in turn create the cash flows for growth and dividends for shareholders.
This is what drives equity returns over the long term: earnings and dividends.
The companies that fail to grow are the ones that leave the market over time. The paradox is that investors are generally more tempted to sell when markets go down, while tempted to buy after seeing markets going up.
How often does cash beat Mr. Market?
This choice of being in and out of the market is an active one, but so is deciding to remain invested for the long term, which is often the more difficult choice to make.
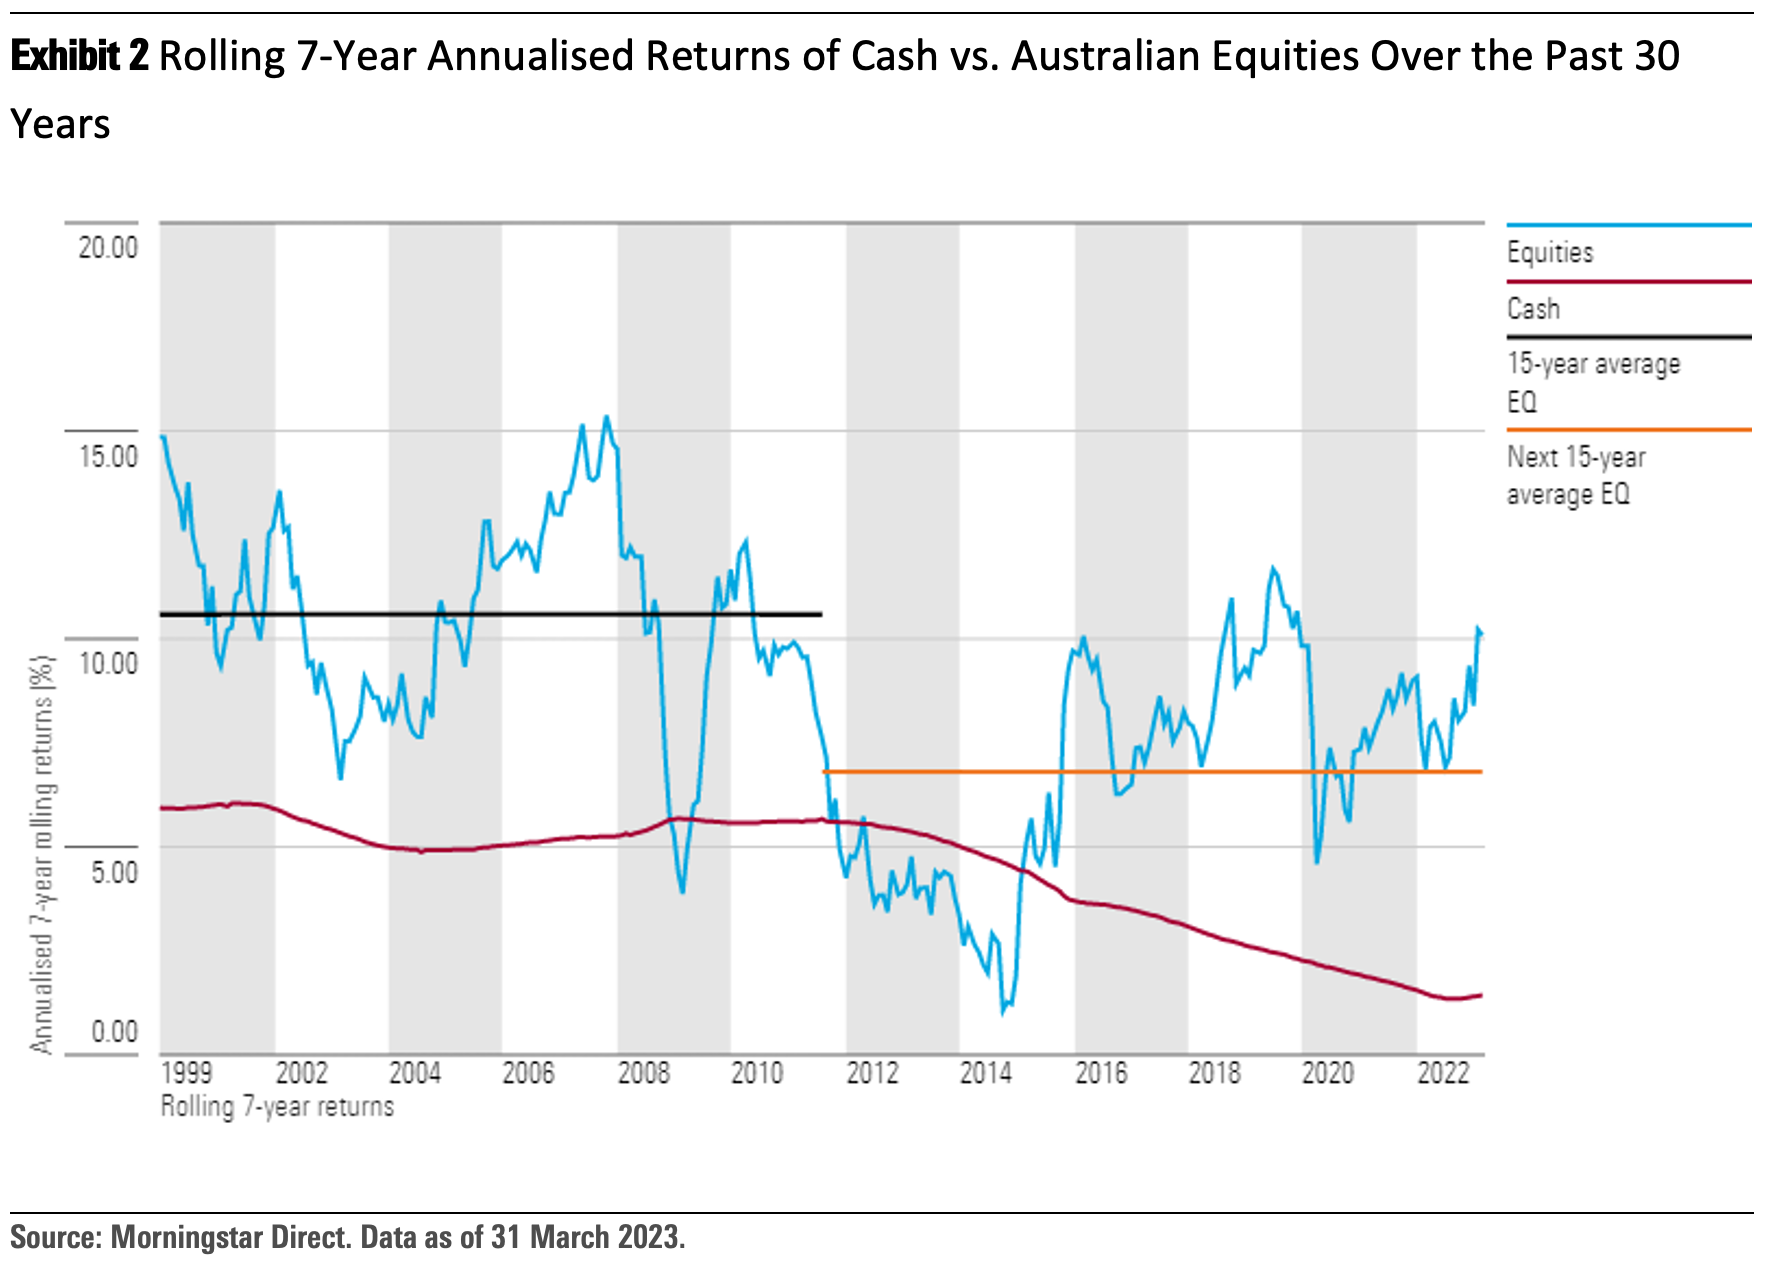
Over the past 30 years, Australian equities have outperformed cash in 85% of the rolling seven-year periods, as shown in the chart below.
Why should a 30-year time frame be considered? What are the compounding effects?
First, the average age of members across the superannuation industry is 45 years old.
Though the retirement age is 65 years, people are living much longer today than they ever were. This 30-year horizon is crucial in determining how they retire comfortably.
Second, society is undergoing the single largest wealth transfer in history as the baby boomer generation leaves some or most of their wealth to the millennial generation.
Millennials are between 27 and 42 years old. This also fits the concept of the 30-year horizon. What are the compounding effects over this period?
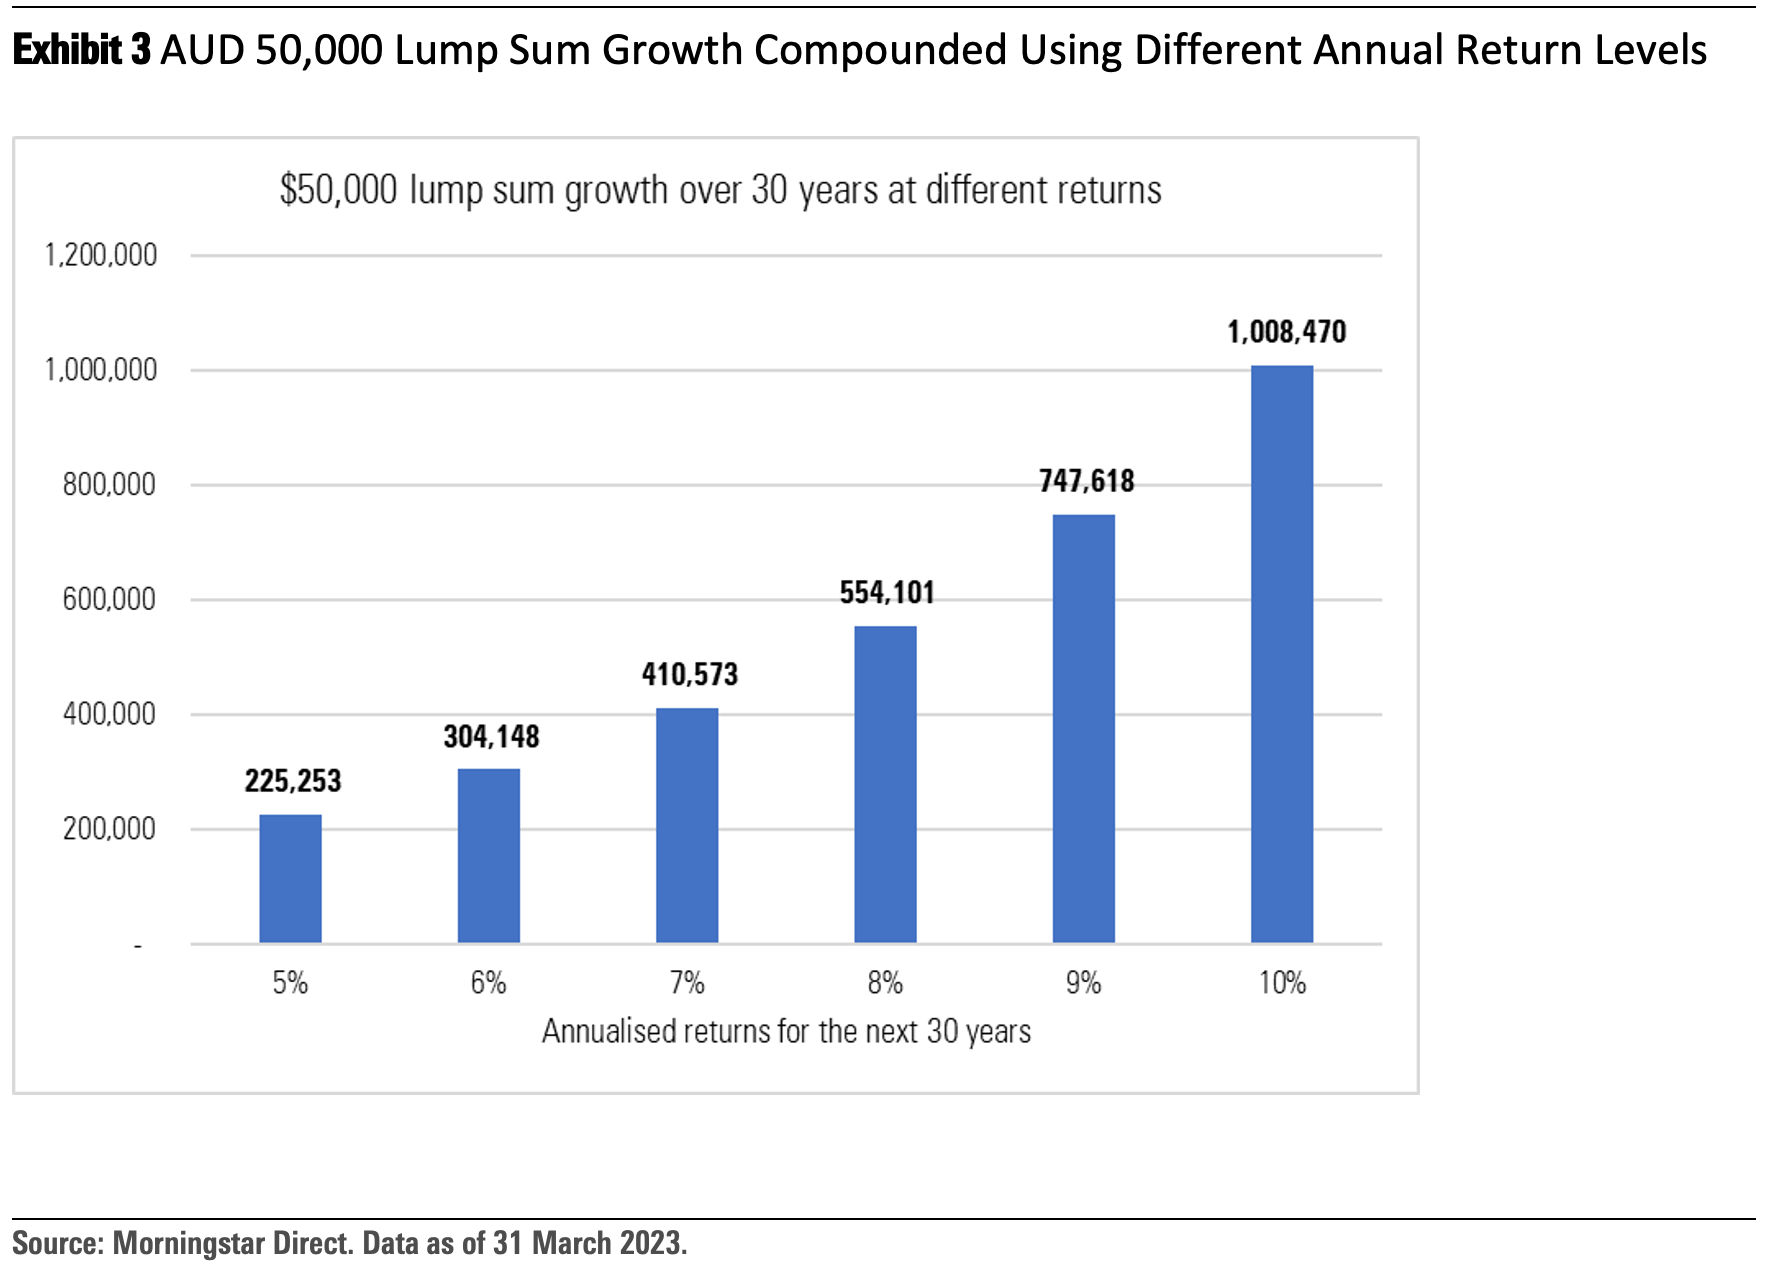
As we showed in the chart above, the average return of the first 15 years of seven-year rolling returns was 10.50%. The next 15 years’ average return was 6.75%.
We can’t predict the future, but we can model a few scenarios and their outcomes:
Warren Buffett had a net worth of USD 34 million (yes, million) at age 43.
After almost 50 years of compounding and staying invested, at age 92, he’s worth USD 113 billion—even after donating USD 111 billion along the way.
Key takeaways
- Investing for the long term and staying the course is a key tenet to achieving wealth-generation objectives.
- The compounding effects over long periods of time are phenomenal.
- The possibility of negative returns diminishes as the time horizon gets longer.
- Historically, Mr. Market has delivered positive returns over long periods of time, despite his unpredictable temperament on any day.
- Companies invest for growth and require time to deliver value to shareholders. Successful companies generally become larger over time, and the ones that fail are taken out of the market.
What do our four investors think? Armed with these insights, they wanted to understand from Mr. Market how to time the market better.
They wanted to understand what they could do in terms of their buying and selling decisions through time that would produce better results.
“Mr. Market’s job is to provide you with prices; your job is to decide whether it is to your advantage to act on them. You do not have to trade with him just because he constantly begs you to.”
—Benjamin Graham
In part two of ‘4 Investors Walk Into a Bar’, we’ll find out who wins versus Mr. Market.
Australia’s chronic shortage of housing is prompting widespread calls for changes in a wide range of policies that affect the demand and supply of places to live. A forecast net intake of 700,000 migrants over two financial years to 30 June 2024 (and 1.75 million by June 2028) at a time of construction shortages and rising rates has created an historically-low rental vacancy rate. Contrary to expert predictions, house prices have risen in 2023 as home demand outstrips supply.
At such times, two policies targeted for criticism in favouring investors over owner-occupiers are negative gearing and the capital gains tax (CGT) discount.
With negative gearing, where costs of owning a rental property exceed revenues, the ‘loss’ can be charged against other personal income. Some people seem to think the loss itself is a good thing because it reduces their tax, but the tax savings only reduces the loss: it is still a loss. This is little comfort to the aspiring homeowner who is beaten at an auction by an investor happy with the income offset in return for future capital gains.
As if that wasn’t enough, investors also receive a 50% CGT discount if they sell after holding the asset for longer than 12 months. Little wonder Australians love investing in real estate.
But why should a dollar made as a capital gain be taxed at a lower rate than a dollar earned as income? Nobody can claim a personal income tax deduction if they’ve held a job for longer than 12 months. That seems a ridiculous notion.
Why do we have a CGT and a discount?
CGT was introduced almost 40 years ago in Australia in 1985 to stop schemes that converted income into capital to exploit its tax-free treatment at the time.
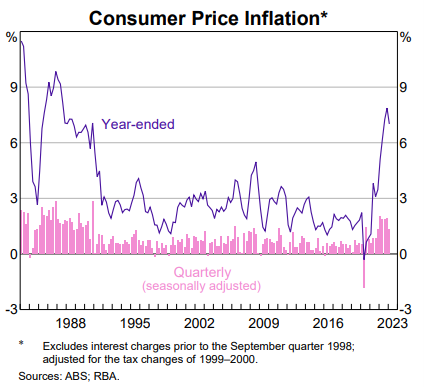
The CGT discount started as a recognition that in calculating capital gains, it is fair to tax the real increase in the value of the asset, after allowing for inflation. Any asset which only keeps up with inflation is not really increasing in value. For example, the annual Consumer Price Index reached 7.8% in December 2022, the highest for three decades. If an asset was bought for $100,000 a year earlier, its value would need to rise to $107,800 to retain its real value. That is, in December 2022, it cost 7.8% more to buy goods than in December 2021, so it is legitimate to adjust a capital gain for inflation. As the chart below shows, inflation adjustment matters again.
So where does the 50% discount come from?
Prior to 1999, the calculation was based on an adjustment to the cost base for CPI, but it was considered overly complicated. Investors needed to calculate the inflation adjustment between buying and selling dates. This seems a trivial reason, as online data and calculators could easily be provided by the Australian Taxation Office (ATO) and others. But at the time of the 50% discount introduction, it was justified on simplicity grounds. And the 15% tax on superannuation in accumulation mode receives a 33% discount, giving a tax at 10% instead of 15%.
It is easy to see who benefits and who loses from the move from CPI to 50%.
Winners: Investors who hold an asset for a little over 12 months when inflation is low.
As with most developed countries, Australia went through a golden period of low inflation starting in about 1996 and running until the pandemic. The timing of the 50% discount was of great benefit to many investors.
Losers: Investors who hold an asset for a long time during high inflation.
It’s not all win-win in investor land. Using the Reserve Bank inflation calculator, an asset bought for $100,000 in 1992 and held for 30 years until 2022 would need to rise in value to $212,610 to retain its real value. The cost base would rise by $112,610 under a CPI adjustment. If the asset sold for its CPI-adjusted level of $212,610, the CGT would be zero under the old system. Under the 50% system, half the gain or $56,305 would form part of the investor’s taxable income.
So in certain circumstances, the 50% discount is unreasonably low. Now we have a return to higher inflation which looks like sticking around for some years above the Reserve Bank target range of 2% to 3%. Online calculators debunk the idea that the calculation is too complex, and it seems a fairer system to adjust the tax base for inflation.
The CPI adjustment also encourages holders who do not flip investment properties every year or two, and it’s easier to sell politically. The 50% number sounds generous, and it was in a low inflation environment. Everyone can understand the legitimacy of a CPI adjustment.
What are some of objections to the CGT discount?
In its 2023 paper, ‘Back in black? A menu of measures to repair the budget’, the Grattan Institute argued that successive Australian governments cannot continue to massively spend to keep voters happy while not collecting more revenue to pay for it. Among a range of measures was a proposal to reduce the CGT discount to 25% to raise $5 billion a year.
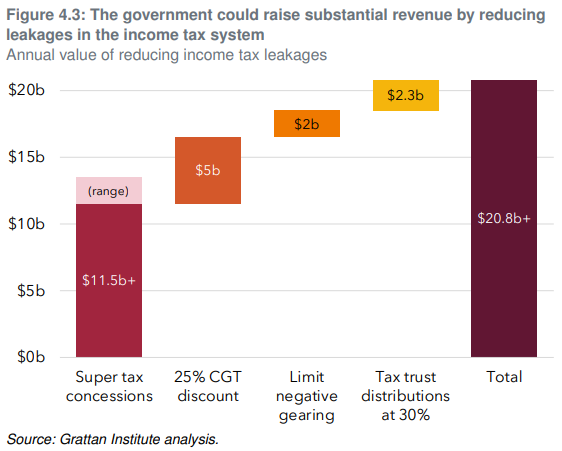
The main rational for the change was:
“If income taxes are applied to nominal capital gains, inflation can erode part of an investor’s wealth. But given low inflation for most of the past decade, the 50% CGT discount overcompensated many investors for inflation. The policy has also over-zealously protected savings at the expense of competing considerations. The economic benefits of tax neutrality for savings are small, and the 50% CGT discount encourages investors to focus too much on investments with capital growth rather than annual income. This is a major distortion which, together with negative gearing, encourages property speculation over more efficient investments. The current discount also compromises income tax integrity by encouraging artificial transactions and makes the tax system less progressive. The 50% CGT discount for individuals and trusts should be reduced to 25%, with a gradual phase-in (rather than grandfathering).”
Earlier modelling showed the top 10% of households by income receive nearly three-quarters of tax benefits.
Other critics argue Australians do not need these tax incentives to buy property, and it disadvantages people without the resources to invest in property at the expense of more productive businesses. The discount is available to people who are wealthy enough to own capital and they should not pay less tax than someone who relies on income.
The Henry Tax Review recommended reducing the 50% CGT discount to 40%, but like much of Henry, this was rejected. However, this needs to be read in the context of Henry’s sweeping changes, which recommended a move to a broad 40% discount on many forms of personal savings to remove distortions and incentives. The Henry Review said of the different ways income and capital gains are taxed:
“There is considerable evidence that such tax differences can have large effects on the assets in which a household’s savings are invested. The large variations in tax treatment can therefore alter the allocation, ownership and the management of the nation’s savings. This can have adverse impacts on overall economic efficiency, capital market stability and the distribution of risk between individuals. The tax advantages from borrowing to invest in a rental property, also relevant for shares, leads to investors taking on too much debt and distorts the rental property market. A move to a broad 40% discount for income from bank deposits, bonds, rental properties, and capital gains and for certain interest expenses would address these problems by providing more consistent tax outcomes. Savings would be allocated more productively, distortions to rental property and other markets would be reduced, and household investment and financing choices would better suit their circumstances and risk-preferences.”
While economists such as Saul Eslake supported this proposal, a 2016 paper by Professors George Fane and Martin Richardson noted:
‘the simplest way to repair the capital gains tax is to return to the pre-1999 arrangements’.
Note also that investors can add to the cost base the expenses incurred in acquiring the asset such as inspections, surveyor costs, stamp duty or costs of transfer. The ATO has a detailed list here. CGT discounts are available to individuals and trusts but not companies.
A discount is justified
As various policies relating to housing and tax are kicked around for change, we can debate the amount of the discount – 25%, 40%, 50%, linked to CPI – but the justification for some level of discount is strong. The CPI adjustment to allow for the real value of the asset seems easiest to justify and explain.
However, the impact on housing supply is uncertain. While owner occupiers would prefer fewer competitors on auction day, renters would not want a policy that materially reduces the availability of rental properties.
Executive Summary
Morningstar Sustainalytics recently released the Low Carbon Transition Rating, a science-based and forward-looking assessment of companies’ alignment to the 1.5-degree Celsius pathway needed to avoid climate catastrophe. Despite many companies pledging to decarbonise their businesses and achieve net zero emissions by 2050, current data reveals that we are not projected to make this milestone.
Key Takeaways
- Australia’s market benchmark, the ASX 300, is significantly misaligned with the reductions needed to limit warming to 1.5 degrees above pre-industrial levels.
- Even worse, no Australian-listed company is on track to reach net zero by 2050. Qantas QAN, a widely held company in investment portfolios, is one of the most severely misaligned, with an implied temperature rise of 6.0 degrees. Said differently, if all companies managed their GHG emissions in the same way as Qantas, the world would warm by 6 degrees.
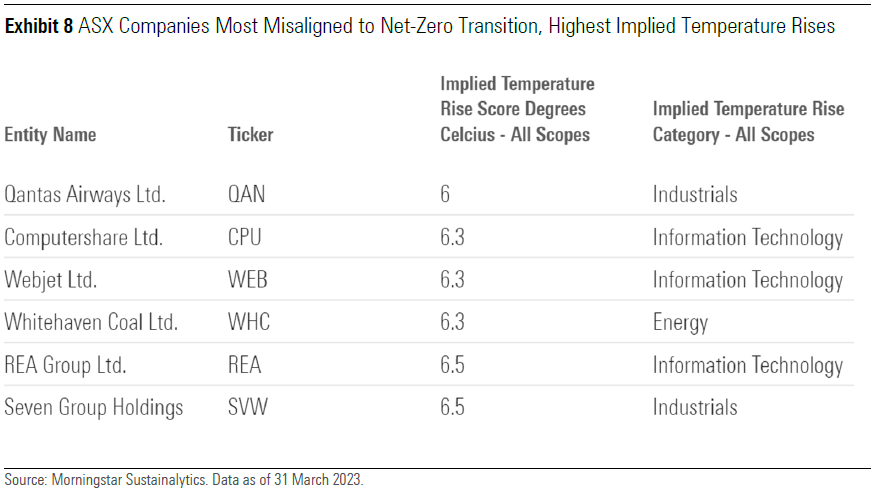
- Computershare CPU, Webjet WEB, Whitehaven Coal WHC, REA Group REA, and Seven Group SVW are the most misaligned with implied temperature rises ranging from 6.3 to 6.5 degrees.
- Alignment to net zero differs between sectors. Investors may be surprised that sustainable sector
darlings like IT have challenging transition risks compared with other sectors such as real estate or financials because of their upstream supply chain emissions. - Sustainable Australian equity funds tend to skew their investments in companies with better net-zero alignment.
Australian Market Kicks Into Decarbonisation Gear
There has been a big uptick in Australia’s commitment to addressing the issue of climate change over the past 12 months. Here are a few of the more recent climate-related initiatives that have been unfolding:
- Australia has committed to net zero, via legislation, with the climate change bill that passed Federal Parliament in September 2022.
- The Australian Federal Treasury has undertaken an industry consultation on climate-related financial disclosure, receiving 194 submissions.
- Australia has committed to launching a sovereign green-bond issuance program in 2024, which should help attract funds into projects that support net-zero alignment.
- A new national Net Zero Authority will be established on 1 July 2023 to help aid the transition to net zero by supporting communities, industries, and people.
- More-stringent safeguard mechanisms will be put in place to ensure that high emitters reduce their greenhouse gas emissions year on year.
- There has been more guidance and action on greenwashing by the Australian Securities and Investments Commission and the Australian Competition and Consumer Commission.
As Morningstar’s Investing in Times of Climate Change report found, investors are increasingly choosing to invest in climate-themed funds, and new funds are being launched to meet the demand. A growing number of strategies seek to offer a lower carbon footprint or carbon intensity compared with their performance benchmark, while others focus on companies that provide solutions to mitigate and adapt to climate change.
At the same time, investors and regulators are pushing companies to report more climate-related data, including data related to transition and physical risks as well as plans to manage those risks. Transition risks refer to the risks associated with the shift to a low-carbon economy, such as changes in regulation, technology, and consumer behavior. The ultimate risk is being saddled with stranded assets with no discernible financial value. There are also physical risks, which refer to the vulnerability of a company’s supply chain, operations, and assets owing to increasing frequency of extreme weather events such as flooding or hurricanes.
Many of the larger-cap Australian-listed companies have made net-zero commitments; KPMG’s biannual report found that 89% of the ASX 100 companies report carbon targets, 90% recognise climate as a financial risk and, despite there being no regulatory requirement to do so, 74% of the ASX 100 companies are voluntarily reporting to the Task Force on Climate-Related Financial Disclosures. So, given this backdrop of the government, companies, and investors being committed to managing climate risks, why does our forward-looking data show no Australian company is on track to deliver net zero by 2050?
We Need to Tackle Indirect Emissions (Scope 3)
Typically, indirect emissions are where the bulk of carbon emissions occur. Depending on the company, it can be as significant as 75% to 90% of all emissions. Companies generally are not adequately capturing and incorporating scope 3 emissions into their net-zero emissions targets. This needs to change. Tackling scope 3 emissions this could really move the decarbonisation needle. Including scope 1 and scope 2 emissions in a net-zero pledge is a reasonable starting point, but it is not enough. This needs to quickly evolve to capture scope 3 emissions; lack of scope 3 emission capture is a key reason why no Australian company is expected to achieve net zero.
Actions Matter
“Factis non verbis” is a Latin saying that loosely translates to “it is by deeds not words,” and it encapsulates the issue with the carbon transition. Company decarbonisation ambitions are reassuring, but best intentions may not translate into action. Morningstar Sustainalytics goes beyond a company’s stated commitment and seeks evidence of actions to decarbonise its business, using a variety of metrics such as investment in technology, good governance structures, and practices related to decarbonisation, as well as evidence of greenhouse gas reduction targets, among others. This is captured in Morningstar Sustainalytics’ company management score, which assesses a company’s emissions management preparedness.
The Data Set Is Evolving
While ever improving, most companies do not yet provide the quality and quantity of data required to properly assess their net-zero progress, particularly when it comes to indirect scope 3 emissions within company supply chains.
To that end, Sustainalytics plugs reported data gaps with its own statistical estimations. Greenhouse gas emissions captured by scope 1 are direct company emissions, scope 2 emissions are indirect company emissions such as purchased energy, and scope 3 emissions are upstream and downstream emissions generated by the value chain. See diagram below.
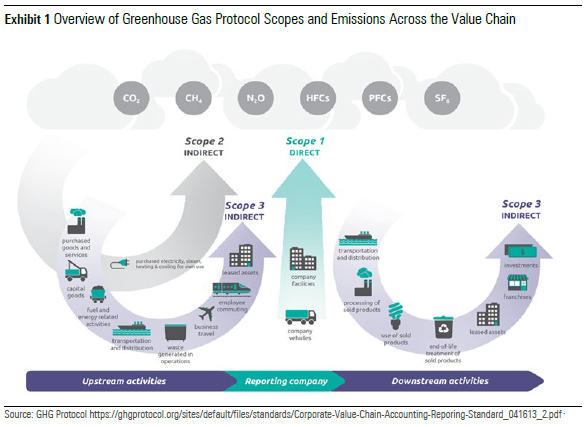
Scope 3 emissions are the most complex yet vitally important, as these emissions are typically where the bulk of a company’s carbon footprint occurs. For example, a car manufacturer’s scope 3 downstream emissions, resulting from its clients’ use of its cars, would represent approximately 80% of the company’s total emissions.
While 25% of companies globally provide scope 3 data to Morningstar Sustainalytics, only 7% are comprehensively provided. That said, even the less complex scope 1 and 2 emissions data sets are far from comprehensively provided; Sustainalytics cites that only 21% of companies provide comprehensive data sets. In the absence of reported data, we use estimations. This is suboptimal, but we note that data is ever improving in quality and quantity, and over time data issues should be resolved as disclosure becomes a regulatory requirement.
Kicking the Can Down the Road
As a resource-rich country, the Australian share market is skewed to high-carbon-emitting companies. Australian companies generate significant revenues from fossil fuels, as the country is a net exporter of coal and liquified natural gas. The energy crisis brought on by the conflict in Ukraine has increased profit for these companies, making it harder for them to set more aggressive decarbonisation targets. Yet, with tougher government policies, particularly around the safeguard mechanisms targeting large emitters (as previously mentioned), emissions reductions should progressively decline.
ASX Sectors Implied Temperature Rise
Based on the principle that companies are expected to limit their emissions to meet a net-zero budget, Morningstar Sustainalytics developed the Low Carbon Transition Rating, which is an implied temperature rise score that indicates how close a company is toward attaining its net-zero (1.5 degrees Celsius) budget. Morningstar Sustainalytics classifies the implied temperature rises in the bands listed in Exhibit 2.
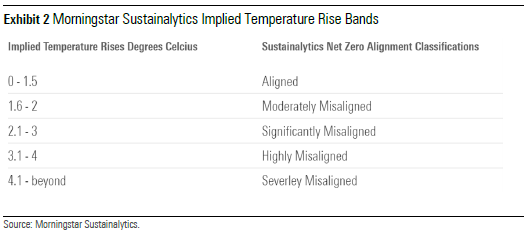
As such, we would say that a company with an implied temperature rise of 2.5 degrees Celsius is significantly misaligned with the goal of the Paris Agreement to limit global warming to 1.5 degrees.
A company’s Low Carbon Transition Rating comprises of two assessments: the exposure assessment, which provides details on how the company would be expected to perform if it took no actions to reduce emissions, and the management assessment, which provides insights on how prepared the company is to manage its emissions through its governance, policies, programmes, and investments.
Instead of placing the burden of mitigating emissions on the highest emitters, the rating acknowledges that all companies have a responsibility to limit GHG emissions according to a set path. Furthermore, the assessment goes well beyond a company’s ambitions and targets, by considering a company’s preparedness to deliver business model transformation.
Morningstar Sustainalytics’ data reveals a mixed picture of Australian companies’ readiness to deliver net zero by 2050. Unsurprisingly, companies in some sectors are more challenged than others as their businesses are inherently more carbon intensive. This is the case for companies operating in industries such as oil and gas production, metals mining, and airlines. Regardless, the data shows that currently every sector is going to fail to cut carbon emissions in line with a 1.5 degrees Celsius global warming scenario.
Australian Telecommunications and IT Sectors Are Not Aligned
The below chart depicts Australian companies’ alignment to net zero by sector across the five temperature rise bands.
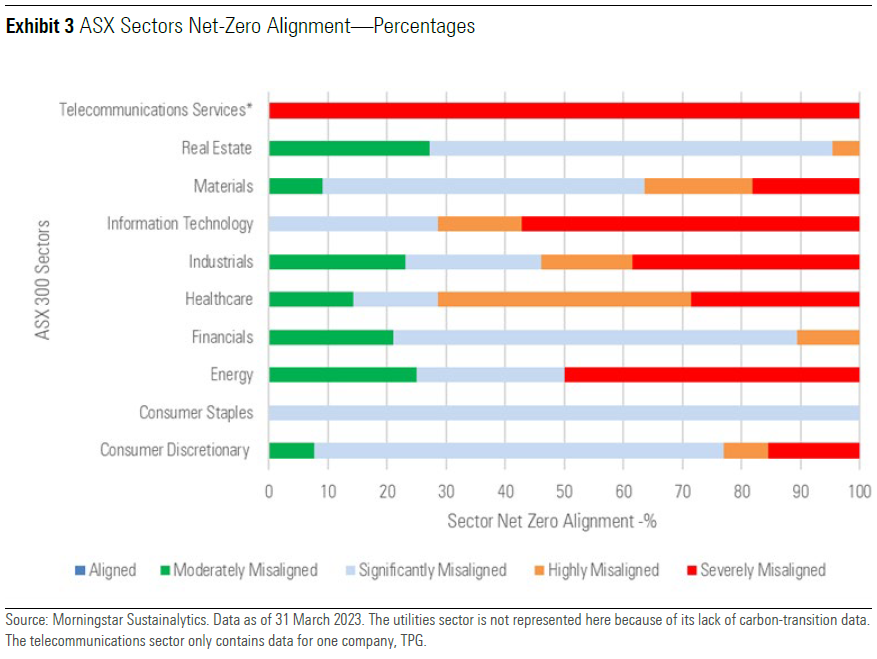
It may come as a surprise to see the telecommunications and IT sectors as so severely misaligned with net zero however, these low-carbon sectors paradoxically are severely misaligned due to their complex supply chains captured by scope 3 emissions.
For example, TPG Telecom TPG, the only company represented in the telecom sector, has scope 3 emissions accounting for 85% of its carbon footprint, yet TPG does not have a near term policy on supply chain emissions, nor does it report on these emissions, and the company’s near-term net-zero targets do not cover its supply chain. Rather, TPG says it encourages suppliers to set their own emissions targets, which is not a proactive approach or one that we consider best practice.
It is a similar story for the IT sector as most companies have severely misaligned upstream scope 3 emissions. Sustainalytics data shows the extent of the scope 3 upstream emissions per company: Pexa PXA 91.6%, Carsales.com CAR 88.5%, Computershare 92.3%, Webjet 81.6%, and REA Group 76.9%. The type of activity contributing to these emissions can vary between companies but includes the procurement of goods and services and raw materials. For example, hardware component parts sourced from a third-party supplier might use carbon-intensive manufacturing processes contributing to global warming. Research undertaken by the Australian Council of Superannuation Investors on ASX 200 companies shows that REA Group is the only company in the IT cohort of seven (see Exhibit 5) that provides a quantitative target and milestone in relation to its scope 3 emissions.
Those IT companies that operate in the enterprise and infrastructure software and data processing subindustries like Wisetech Global WTC and Iress IRE tend to have higher scope 2 emissions as they utilise data centers to store and process large volumes of data. Data centres are high-energy-consuming and high-carbon-emitting, typically powered by electricity. Wisetech Global’s annual report states it is seeking to reduce energy consumption and transition to renewable sources of energy. Iress has also committed to transitioning to renewable energy and reducing its greenhouse gas targets in alignment with the Science-Based Targets Initiative. The other factor that Morningstar Sustainalytics considers is a company’s emissions management
preparedness for transitioning to net zero. This is assessed via a five-tier scale (see Exhibit 4).
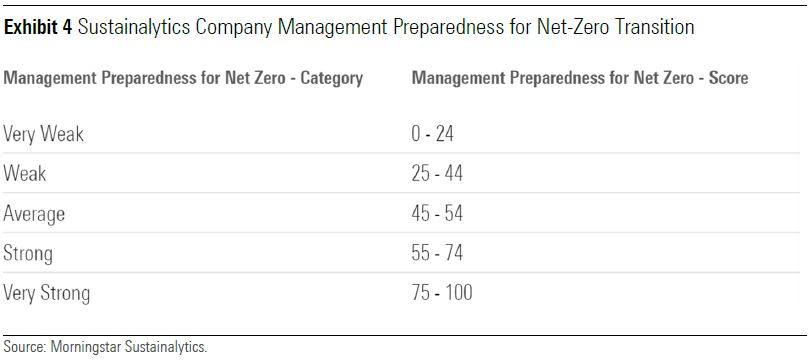
Webjet, Wisetech Global, Pexa, and Iress are assessed as “very weak,” the lowest category, for their emissions management. These companies have poor greenhouse gas emissions targets across all scopes, and greenhouse gas reduction policies and reporting are either very weak or nonexistent. REA Group and Carsales.com are marginally better at “weak,” and Computershare is considered “average.”
The IT sector represented in Exhibit 3 includes the seven companies in the table below, four of which are severely misaligned with temperature-rise forecasts well above 5 degrees Celsius.
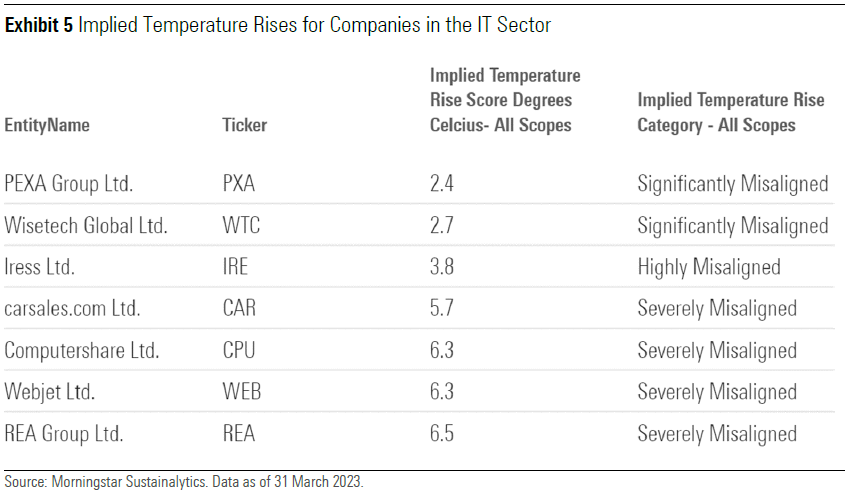
However, it is important to note some data limitations, as the dataset is still being built out. There are a number of large companies for which we do not yet have data, including CSL Ltd. CSL, Westpac WBC, and Telstra TLS.
Real Estate, Consumer Staples, and Financials Do Better
Even sectors with the lowest implied temperature rises—real estate, consumer staples, and financials at 2.3, 2.3, and 2.4 degrees, respectively—are significantly higher than the maximum target of a 1.5-degree rise. But companies in these sectors tend to have stronger management of carbon-related issues. For example, they have specific decarbonisation targets in place, robust governance and reporting practices such as decarbonisation incentives, and board oversight. Lower carbon exposures coupled with stronger decarbonisation management helps to lift their overall assessments.
Top 20 ASX Stocks Held by Sustainable Australian Equity Funds
In this section, we focus on the implied temperature rises of the top 20 stocks held by sustainable Australian equity funds.
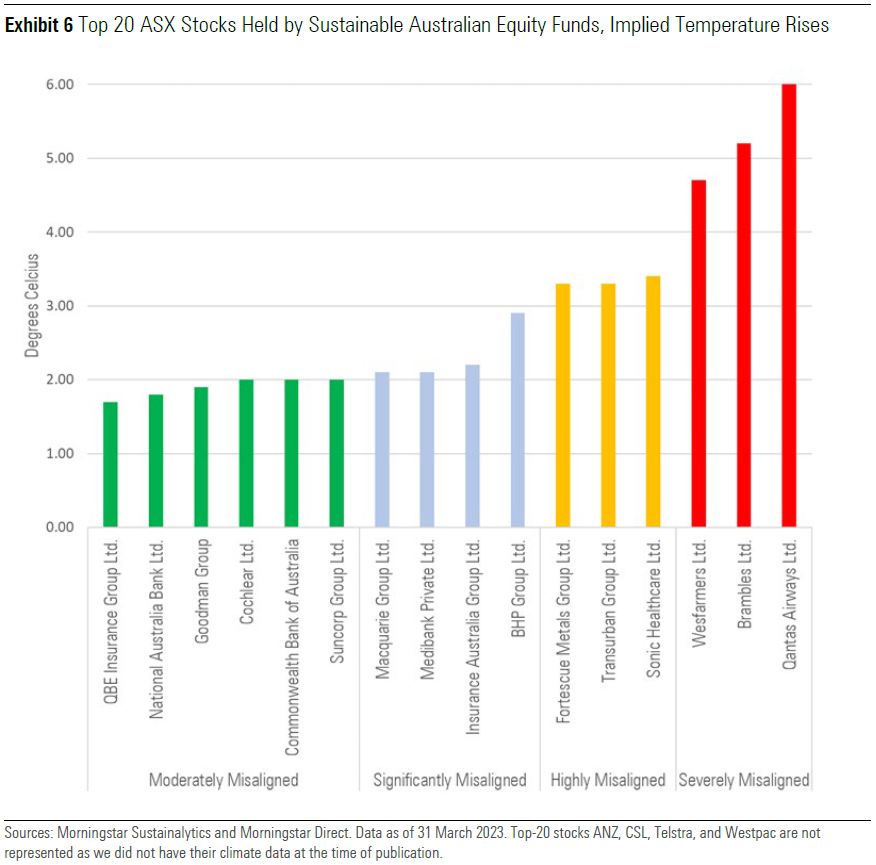
Of the 20 largest ASX stocks held by sustainable equity strategies, none are aligned to net zero. QBE Insurance Group QBE comes on top with an implied temperature rise of 1.7 degrees, followed by five other companies classified as moderately misaligned. Four are significantly misaligned, three are highly misaligned, and three are severely misaligned. Unfortunately, there is no data available yet for the four remaining companies that make up the top 20 holdings.
Listed below are the 10 companies within the ASX that are most closely aligned to a 1.5-degree temperature rise.
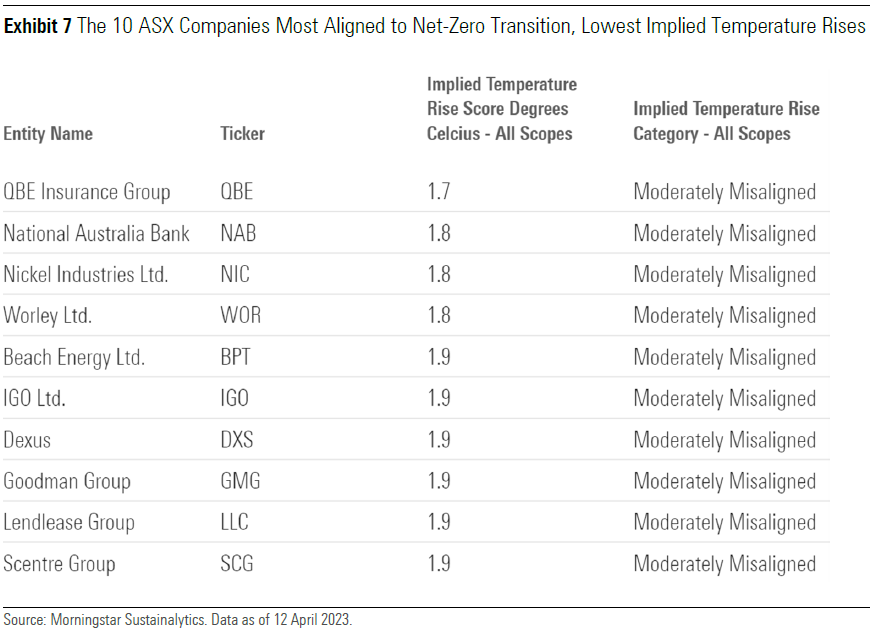
Many of the 10 most aligned companies are widely held by sustainable funds, aside from diversified materials and mining firm Nickel Industries NIC and oil and gas exploration and production company Beach Energy BPT. These two companies are not broadly held in any significant weight, which is not surprising as sustainable funds tend to underweight the materials and energy sectors.
Three severely misaligned companies make the top 20 holdings, Wesfarmers WES, Brambles BXB and Qantas. Qantas is the most misaligned large company, with an implied temperature rise of 6.0 degrees Celsius, mainly owing to its scope 1 fuel consumption, which is responsible for more than 90% of its total emissions. Qantas does particularly badly in its management’s preparedness to lower carbon emissions, and it is one of the worst airlines globally, ranking 28th out of 29 airlines.
Meanwhile, REA Group and Seven Holdings are the most misaligned stocks listed on the ASX, both having implied temperature rises of 6.5 degrees Celsius, followed by Whitehaven Coal, Webjet, and Computershare, all with implied temperature rises of 6.3 degrees Celsius.
As of this writing, no sustainable Australian equity funds in our database held Whitehaven Coal or Seven Group Holdings, while the other stocks mentioned above were not heavily represented. A number of sustainable Australian equity funds held Qantas, with the highest portfolio weight being 5.6%. But most funds held less than a 2.0% weight.
Where to From Here?
While the feasibility of the 1.5-degree Celsius target set by the Paris Agreement has become more uncertain, companies will still need to transition sooner rather than later. Delayed action on climate change has the potential to deliver catastrophic environmental and financial consequences.
As such, investors need to consider whether the companies they hold in their portfolios are well prepared to transition to a low-carbon future and whether they run the risk of future price revision or potentially holding stranded assets. They will also need to understand the measures taken by companies to adapt to a warmer climate.
On a positive note, there is a wave of decarbonisation support coming from multiple stakeholders. Importantly, a crucial gap in government guidance via climate commitments, legislation, reporting, and disclosure regimes is now being addressed. Coupled with regulatory scrutiny, investor demands for more disclosure and companies supplying more climate-related data mean there is hope, but we are rapidly approaching a tipping point. The increased availability of climate-related data and ratings like Morningstar Sustainalytics’ Low Carbon Transition Rating will help empower investors to make more informed decarbonisation choices and allocate to companies aligned with their values.
As the Australian funds management industry continues to evolve, it is important to demand the highest standards from the firms that are entrusted with managing other people’s savings.
Australia’s compulsory superannuation regime has provided a fertile environment for funds management businesses. Barriers to entry are relatively low for what is a capital-light and highly scalable business model.
This backdrop has seen numerous business structures emerge, from more-traditional diversified financial institutions to ultrafocused single-strategy boutiques. The landscape is continuing to change, with mega mergers among both publicly listed firms and industry superannuation funds, and there appears no shortage of boutique startups readily backed by specialist ‘incubator’ firms.
Faced with such a broad and changing range of options, investors should consider which funds management model is going to provide the best structure for long-term alpha generation.
At Morningstar, we ponder this question in our assessment of the Parent Pillar, which is a key input into our overall ratings framework.
This article outlines the key attributes that we believe investors should look for in a fund manager and examines the differing funds management models in Australia.
What makes a good fund manager?
The key attributes we look for in a parent is strong stewardship and the ability to deliver positive net alpha to investors over the long term.
There are many factors that drive this, including:
- An enduring business model that will be around for investors over the long term
- A culture of putting investors first
- Well-considered and executed capacity management
- A focus on creating centres of investing excellence
- The ability to attract and retain investment talent
Let’s explore each factor in more detail.
An enduring business model
To be successful, investors need to take a long-term view. It is therefore critical that any fund manager under consideration will be around for the long term.
With low barriers to entry, many individuals will try their hands at funds management, but to build an enduring and sustainable business, a certain level of scale and profitability must be reached.
Larger and more established firms have an advantage here, but to address the business risk of new ventures, many startups will seek the backing of a well-funded equity partner that can provide a guarantee of working capital over a period of time. Indeed, Australia has seen the rise of the ’boutique incubator’ model to solve this problem.
For more-established firms, investors should consider customer concentration risk. Large redemptions (such as from institutional investors) can jeopardize the financial sustainability of the firm.
It is important for investors to examine and understand the financial backing and risks associated with the fund manager itself, to ensure they will be around for the long term, and not close their doors prematurely because of a lack of profitability.
A culture of putting investors first
To be a good steward of investor capital, funds management firms must have a strong culture of putting investors first.
Unfortunately, conflicts of interest exist in any business, but investors should have a clear understanding of how these are managed.
One of the biggest conflicts is a firm’s desire for profit maximisation, which will come at the expense of investor returns. Fund managers derive their revenue from investment management fees, which are deducted from investment returns.
As mentioned above, firm profitability is important to ensure long-term sustainability, but above a certain level, fund managers should look to share the benefits of scale with investors through lower fees.
Funds management businesses may also seek to maximise profits through asset growth and new product development. This must be managed carefully to not distract or detract from existing offerings (see capacity management below).
While all super fund trustees and responsible entity board members have a fiduciary duty to act in unitholders’ best interests, public company boards also have a duty to maximise shareholder returns. This doesn’t make them any more conflicted than private companies, which have their own shareholders to consider, but profit drivers for listed companies are more visible because of reporting requirements.
Indeed, this public company transparency can be helpful, allowing investors to assess whether the right balance has been struck.
Industry funds are the best placed to maximise unitholder interests, as profits are reinvested for the benefit of members. Nevertheless, it remains important to ensure that costs are managed appropriately and strong governance practices are in place.
Well-considered capacity management
A key component of good stewardship is well considered and executed capacity management.
There is a limit to the level of assets under management a firm can effectively manage before market impact costs have a detrimental impact on investor returns.
If a fund manager is less conservative with regard to capacity, this may be a sign that it is seeking to gather assets to maximise profits, rather than protect the interests of existing investors. Given that successful firms tend to attract the highest levels of flows, it can be a difficult decision to soft-close or hard-close a strategy to new money in order to preserve capacity, but it is an important discipline to maintain.
The other major driver of asset growth in recent years has been consolidation, particularly in the industry superannuation fund segment.
The merger of Sunsuper and QSuper has seen the assets of Australian Retirement Trust exceed AUD 200 billion, joining AustralianSuper in what has been termed the ‘mega fund’ category. This is a double-edged sword as the potential cost savings from scale are countered by capacity management challenges, particularly when combined with the internalisation of the investment management function.
Unfortunately, there is no standard measure of a firm’s capacity, and it is often treated as more of an art than science. The least useful measure that is most often touted by fund managers is looking at strategy size as a percentage of total market capitalisation. This figure has little relevance for active managers that seek to concentrate their investments in specific areas of the market, rather than simply replicate the total market.
Much more useful are the two measures we focus on: days to trade and substantial shareholdings.
Days to trade is an objective measure of the time it would take to liquidate an individual position or total portfolio based on the average trading volume of that security. As a rule of thumb, we believe a fund can trade 25% of average daily volume without having an undue impact on the price. The less time it takes to liquidate a position, the better, as it enables the fund to be nimble in the face of market shifts. Fewer than 10 days to trade represents a highly liquid portfolio, but beyond 30, 60, and 90 days begins to raise questions around capacity management.
For equities, we also monitor the number and weight of substantial shareholdings (greater than 5% of issued capital). A large number of substantial shareholdings or individual holdings in securities that account for greater than 10% of issued capital are a signs that capacity management should be closely scrutinised.
A focus on centres of investing excellence
When it comes to managing money, it is better to be good at one thing than average at many. This is one of the main benefits of the boutique asset-management model—a singular focus on an area of excellence rather than suffering from the distractions of a diversified product offering.
Larger diversified firms can overcome this issue by developing individual centres of excellence under a single firm umbrella, but it is not easy. The rise of the boutique asset-manager model has seen increased competition for talent. Larger diversified firms must continue to evolve to create an environment that nurtures and retains investing excellence.
Industry funds have increasingly moved toward the internalisation of investment teams. This is a significant shift in approach and brings a substantial challenge of maintaining a strong investment culture across each individual asset class.
The ability to attract and retain talent
Funds management is an industry reliant on human capital and individual talent.
The boutique model’s emergence was due to star fund managers wanting to own their own businesses and be masters of their own destinies. The list of portfolio managers who have left large, diversified asset managers to start their own shops is a long one.
While boutiques have had an edge, diversified financial-services firms and industry funds are evolving their business models to address the issue of talent retention. Revenue share models and shadow equity arrangements have become more common as large firms seek to replicate the economic benefits of the boutique structure. There are other benefits that a larger diversified firm can bring, such as greater distribution, compliance, and administrative support. But this is where the boutique incubator models have stepped in to simplify the business ownership experience and allow fund managers to focus on alpha generation.
The main drawback of the industry’s reliance on individual talent is key-person risk.
Recent history shows that despite all the incentives of equity ownership and profit-sharing, portfolio managers may choose to leave for unexpected and personal reasons.
All fund managers should have a clear succession plan in place. The onus is on the board and management to ensure that contingencies are well-thought-out and implemented
An overview of the funds management structures in Australia
When it comes to providing the best platform for investor success, the various funds management models in Australia have a number of advantages and disadvantages to consider.
We broadly categorise the market in Australia into three distinct funds management models:
- The diversified financial firm
- The boutique
- Member-owned and profit-for-member industry funds
The diversified financial firm
Diversified financial firms are those that provide investment management services across a range of asset classes, as well as internally managing their own compliance, marketing, and distribution.
They are full-service firms, with many historically going so far as to vertically integrate into advice.
These firms once dominated the Australian funds management landscape. Perpetual and AMP were stalwarts of the industry, followed by Pendal (formerly Bankers Trust). The major offshore players have also entered the Australian market, either directly (Vanguard, Fidelity, BlackRock, and T. Rowe Price) or via acquisition (Nikko).
The benefits of diversified financial firms are scale, diversification across asset classes and products, and financial strength. These businesses should have longevity when managed well, although this is not assured, as we have seen in Australia, particularly if a firm’s culture strays off course.
The key strengths of the business model have the potential to become weaknesses. Size and scale bring complexity and a lack of focus, and success can evolve into hubris. As with any firm, leadership is key.
Diversified financial firms are able to deploy significant resources into not only investment capability, but product development, client services, and environmental, social, and governance investing. The drawback is the lack of focus on a single area of investing excellence.
Retention of talent has historically been difficult, with talented individuals drawn to the potential of the more lucrative equity ownership structure of boutiques. Diversified financial firms can address this in a number of ways. They can make the firm greater than the individual, as has been the case with Fidelity and Perpetual, or increasingly they have sought to give talented individuals equity-equivalent packages like revenue share arrangements.
The boutique
Boutiques have flourished in Australia over the past 30 years. The attraction for talented managers to strike out on their own and be in control of their own destinies is strong. Boutiques have made a number of individuals extremely wealthy.
Platinum Asset Management and Magellan Asset Management are two of Australia’s most successful boutique investment managers that have grown into large firms.
The challenge of setting up a new firm has been made easier by the emergence of boutique incubators such as Fidante and Pinnacle. These businesses take a minority stake in the new boutique in exchange for providing startup working capital as well as distribution, marketing, and administrative support.
While a singular focus is a key strength of the boutique model, it can also expose weaknesses.
The success or failure of a boutique can be dependent on one or two key individuals, resulting in substantial key-person risk.
Business sustainability can also be endangered by a concentration in assets among a few key clients.
Numerous boutiques have closed in Australia because of personal or commercial reasons, even when a boutique incubator has been involved.
Member-owned and profit-for-member industry funds
Member-owned and profit-for-member firms reinvest profits back into the business to benefit all members.
Vanguard has been the poster child for the member-owned model over the past half century, with scale benefits reinvested back into lower fees.
In Australia, industry superannuation funds are set up as profit-for-member and have a similar ethos of passing on the full benefit of scale to investors.
The success of industry super funds in Australia has introduced its own challenges, given they have become behemoths in themselves. Capacity management is a key challenge, particularly after many funds have internalised the investment function. One solution has been increased investment in alternative asset classes and unlisted investments, which carries additional liquidity risk.
Industry funds are having to undergo a cultural change as they shift from being administrators and asset allocators to being fully fledged investment managers.
Conclusion
While funds management firms come in a variety of shapes and sizes, the features that make them effective stewards of investor capital are not exclusive.
There is no single model that has all the answers. Rather, investors must analyse businesses on their own merits, identifying where they have maximised their strengths and minimised their weaknesses.
Culture and effective stewardship cannot be taken for granted, and it requires the constant efforts from a firm’s management and board to ensure that interests are aligned and there is the greatest chance of long-term net alpha generation.
Morningstar is committed to helping investors make an educated assessment of their fund managers through our Parent Pillar ratings.
Key Points:
- Morningstar recently increased long-term gold price assumption to US$1,700 an ounce, up from US$1,600.
- We recently reinitiated coverage of the world’s largest gold miner Newmont (NEM), which is in takeover talks with ASX-listed Newcrest (NCM)
- Newmont is interested in Newcrest because it’s of its reserves. If you don’t replace the reserves, you don’t have a business, and Newcrest has more than two decades of reserves.
Key points:
- Banks have benefited from rising interest rates, but margins and earnings appear to have peaked.
- The second half is likely to be a bit weaker than the first half. But over time, we expect the market to be rational in setting prices for both deposits and mortgages and try to make a decent return for shareholders.
- The outlook for bad debts is also weighing on bank shares. We expect to see a material rise over the next 12 months, but we don’t think it’ll be anywhere near as bad as we saw in the GFC.
- Dividends could potentially grow a little bit in the second half even if earnings are weaker because first half payout ratios were at the lower end of their target ranges.
Fulfilling Multiple Investment Objectives
Given their product description, many investors would rightfully expect absolute return bond managers to generate consistent positive returns across all market environments, including negative markets like we saw in 2022. Most absolute return bond managers explicitly target downside protection as one of their three key objectives, along with delivering cash plus returns and providing steady investment income. In the current volatile and rising interest-rate market where traditional fixed-interest investments have become more positively correlated with equities of late, absolute return bond strategies should be attractive. However, recent active returns for these fixed-income managers have been challenged in this environment. Are absolute return managers exhibiting the skill to consistently deliver on all their objectives, and are these strategies worth the additional cost for investors? Should absolute return bond managers be expected to protect the downside as well as meeting absolute return objectives?
What Are Absolute Return Bond Strategies?
Absolute return bond strategies are typically more skill-oriented strategies where managers seek to deliver consistent returns regardless of the direction of markets. Strategies might invest across government and corporate securities, into emerging markets, and also use currency as additional return or a diversification lever. Distinct from traditional fixed income strategies, absolute return bond managers are less constrained by benchmarks and tend to maintain a structurally lower level of duration risk and sensitivity to interest rate changes. While absolute return bond strategies do not have an explicit Morningstar Category, as part of this analysis, we have differentiated these strategies as a subset of the broader cohort of unconstrained strategies for their more-explicit focus on protecting aganst downside risk and ensuring ongoing return and income stabilty, generally targeting a level of return above a cash-based benchmark over their stated investment horizon with an investment-grade credit-quality orientation. The success of the broader unconstrained cohort has been covered in previous research such as Tim Wong’s 2019 paper, “Have Flexible-Bond Strategies Hit Their Mark”, and Sarah Fox’s 2017 paper, “Unconstrained bonds—did they survive their first test?”.
In seeking to deliver consistent absolute returns, managers will generally use a combination of income carry from short duration credit-based investments as well as less market-directional relative-value trades, typically expressed through long and short interest rates and currency positions, while often seeking to protect the downside through sophisticated derivative-based overlay strategies. Derivative and other hedge-based return protection strategies do have an ongoing cost premium to return, so prudent managers will look to size these exposures appropriately.
Absolute Return Bond Strategies and Morningstar’s Ratings Framework
Absolute return bond strategies are currently covered within several of Morningstar’s Australian investment categories, including unconstrained fixed income and diversified credit. The former category generally includes managers that are less constrained by benchmarks and employ a broader range of alpha sources, while the latter category is more focused on bottom-up-driven credit managers, including those who adopt lower-volatility short duration income-oriented mandates with less duration and macro management.
Under the current Morningstar Medalist Rating methodology, managers are assessed on a forwardlooking basis, with the top three ratings of Gold, Silver, and Bronze being reserved for the actively managed funds that are expected to produce risk-adjusted alpha relative to their Morningstar Category index over the long term.
For the purposes of this report, however, we have undertaken a backward-looking qualitative and quantitative assessment of whether absolute return bond managers have demonstrated the skill of achieving their multi-objectives, before providing our thoughts for investors.
Heatmap Assessment of Absolute Return Bond Strategies Relative to their Objectives
Across the spectrum of absolute return bond strategies listed in Exhibit 1, there is broad commonality across the high-level multi-objectives relating to achieving cash plus returns, limiting downside risk and provision of a stable income. However, there are variances across managers in terms of the level of alpha sought and the level of conservatism to tolerating negative returns. Investment managers seeking to deliver higher levels of alpha generally need to assume a greater level of investment risk when taking on views on the direction of investment markets as well as idiosyncratic risks from security selection, which naturally increases the likelihood of capital drawdowns.
The following exhibits provide a manager summary and a backward-looking heatmap assessment of Morningstar’s rated absolute return bond strategies in terms of their performance relative to their multiobjectives to March 31, 2023. In Exhibit 2, objectives that have been clearly met over the relevant horizon have been shaded green; amber reflects objectives that have been nearly met or not consistently met; and red means objectives have been clearly not met. It should be noted that the downside risk assessment has incorporated some qualitative judgment, which considers the magnitude of negative performance in the context of the manager’s broader risk profile.
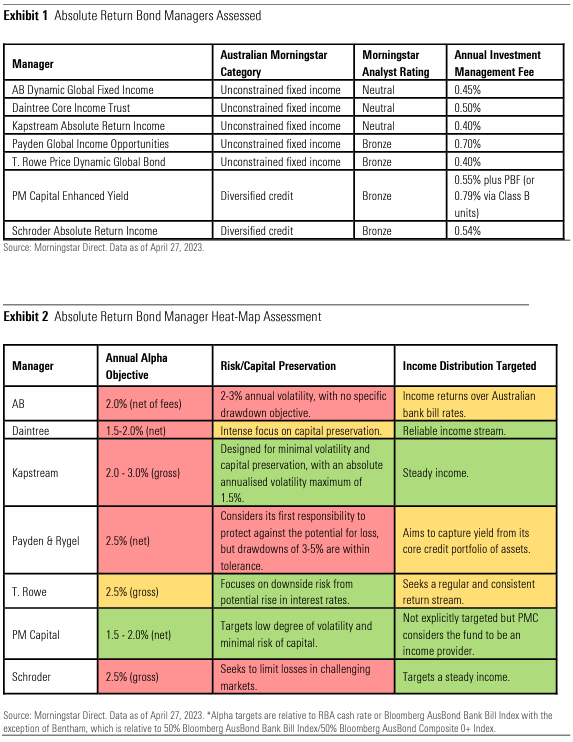
One of the major observations from Exhbit 2 is the challenged track record of Morningstar’s rated absolute return bond managers in terms of meeting their own return objectives. Only one manager in PM Capital Enhanced Yield PMC0103AU is showing as green for meeting its cash plus return objective. PM Capital is an opportunistic credit-oriented manager that had good preparedness to take advantage of valuation opportunities arising from the coronavirus pandemic. With its stronger focus on credit, PM Capital was not immune from drawdowns during the early stage of the pandemic, but all did well to derisk as the credit tide began to turn in early 2022.
There are other similar opportunistic enhanced credit income strategies within the unconstrained fixed income and diversified credit Morningstar Categories that have also performed relatively well, such as Bentham Global Income CSA0038AU and Yarra Enhanced Income JBW0018AU. However, in our view these strategies are overall less absolute-return-oriented and are typically higher credit risk, and were therefore not included in the assessment.
While T. Rowe Price Global Dynamic Bond ETL0398AU is showing as amber for its longer-term performance versus objectives, the manager has performed commendably in terms of its interest duration management over the short to medium term, and is the only manager among the contingent to have exhibited a negative equity correlation with equity markets.
Of the managers listed in the table, T. Rowe Price is one of the heaviest users of interest-rate risk through duration management and countryrelative value trades, which over time tends to be more challenging to consistently deliver alpha for risk relative to credit income investing. However, T. Rowe Price’s differentiated style means that it remains an attractive diversifier, particularly with the local rated manager universe dominated by short duration credit income managers. Of the managers that have struggled to meet return objectives, we have found these have generally included more conservative styles of strategy that were less willing to dial up credit risk (for example, through venturing into lower-rated credit) prior to the COVID-19 pandemic when credit conditions were strong but tightening, or strongly capitalise on valuation opportunities after the COVID-19 pandemic. As a result, these managers have not had the return buffer to compensate for 2022’s widening in credit spreads or increase in bond yields.
From a downside risk perspective, very few absolute return bond managers have had the preparedness to meaningfully short interest-rate or credit duration over time given the impact on running yield. T. Rowe Price is one manager that has. Generally, managers have had mixed success in terms of using credit derivative overlay strategies to protect against downside risk, which can at times be a relatively blunt tool and not always closely provide a tight hedge given the limited availability of derivatives that protect against single-name credit risk.
Finally, the exhibit shows that managers have been able to largely meet expectations around ensuring a stable level of income distribution. However, as noted in Tim Wong’s paper from late last year (“Income Isn’t Fixed”), the recent underperformance of fixed-income markets has led to a shrinkage of income distributions for some managers and a failure to distribute more recently in 2022 as credit markets have turned negative.
Do Absolute Return Bond Strategies Still Offer Value for Money?
It should be recognised that the analysis in the heatmap above is time-period-sensitive and affected by one of the largest bond selloffs in recent memory following the sharp rise in inflation and bond yields during 2022. We did see a modest easing in this trend in the first quarter of 2023. While from a manager selection decisioning perspective, investors should give stronger weight to the forward-looking views in Morningstar’s Analyst Rating methodology, it does highlight the challenges that managers in this space have faced with respect to meeting their individual performance objectives.
That said, multisector investors with exposure to these funds in lieu of traditional fixed income would have benefited from their diversification in 2022’s rising interest-rate environment. This diversification benefit should continue to persist while inflation remains elevated. We note that the traditional Australian and global active fixed-income manager universes have also had their performance challenges in terms of consistently beating the benchmark, with the median manager in the Australian and global bond categories showing modest underperformance across all major three-, five-, seven-, and 10-year time periods to March 31, 2023.
There has also been the view that the return objectives for absolute return bond managers are set at a relatively ambitious level. This certainly appeared the case in the lead up to the COVID-19 pandemic when credit spreads were tight, and both bond yields and fixed-income market volatility were low. However, while risks remain, fixed-income yields are now at much more attractive levels compared with recent years, which should more strongly support not only traditional fixed-income exposures in terms of their absolute returns, but also absolute return bond managers relative to their return objectives.
Management fees for absolute return bond funds do vary, typically reflecting the level of sophistication and alpha generation of the managers. However, most absolute return managers are generally only priced at a 5- to 10-basis-point fee premium relative to traditional active fixed-income managers, which we consider as reasonable given their increased breadth of alpha focus.
How Should Investors Ideally Gain Exposure to Absolute Return Bonds?
Investors should be mindful that over time most absolute return bond managers will tend to be modestly positively correlated with credit markets and will not always provide positive absolute returns when equity markets are underperforming. An interesting observation is also the higher proportion of short duration credit-income-type products available in the local Australian market compared with lessdirectional relative-value type strategies, which tend to favor the larger global institutional managers due to the increased people resourcing requirements. However, while not immune from modest negative returns, these strategies should still provide greater defensive diversification when interest rates are rising, as we saw in 2022. Given the increased skill-driven nature of absolute return bond manger returns, diversification across suitable highly rated funds and manager styles should help to increase portfolio balances over time.
As equity investors, we make two observations from the recent Silicon Valley Bank, or SVB, collapse in the U.S.
The first is that dangers of “borrowing short, lending long” are always present in the equities market. SVB failed because it borrowed from depositors who can demand their money back at any time. But SVB invested that money in financial instruments, mostly long-term bonds at fixed rates, that mature many years in the future. Consequently, when there was a sudden rush by depositors to withdraw their money, SVB did not have enough money to meet the call, nor could it liquidate the investments fast enough to do so. It did not help that these long-dated fixed-rate financial instruments were worth less because of rising interest rates. To make matters worse, management did away with interest rate hedging and staggering the maturity profiles of its investment portfolio, presumably because it thought its deposit customers were loyal (we will come back to this misplaced belief later).
The whole situation has similarities to a publicly listed company raising equity capital from shareholders who can sell the shares AT ANY TIME, but the company uses that money to pay for acquisitions or to invest in growth projects that deliver returns OVER TIME in the future.
If enough shareholders subsequently sell the shares for whatever reason (frustration with stagnant stock price, need for a house deposit, a tweet questioning the CEO’s recycling habits), the stock price drops.
The key difference in this first observation is this—a bank can literally fold from the “borrowing short, lending long” duration mismatch, with real-life monetary and emotional cost to people, government and the economy. In the case of a share investment, assuming the company has a solid balance sheet and its solvency is not linked to stock price movement (don’t laugh, we’ve seen debt covenants linked to market capitalisation in our time), the only real short-term cost is borne by short term-minded shareholders who sell at a loss.
The second observation from the SVB closure is the importance of the type of people an entity borrows “short” from. A normal bank gets deposits from all types of people, most of whom are foreign to each other and somewhat lackadaisical when it comes to managing the money in their bank accounts. But most of SVB’s deposits were from technology firms, venture capitalists and the Web 2.0 sorts. The bank’s full expanded name provides a big clue as to what industry butters both sides of its bread! The problem with having such a concentrated and highly correlated “techy” customer base is that it is very incestuous, and they talk among themselves more than they talk to their own families. WhatsApp, Slack,
Discord, Twitter, Instagram, texts—the list of instant messaging tools these highly connected tech people use is mindboggling and that doesn’t even include Outlook Email and Facebook which are now considered so analogue! Consequently, when there was just a whiff of liquidity concerns with SVB, the news spread like wildfire among SVB customers in almost an instant, leading to a bank run that was more akin to a bank flash!
That is similar to a publicly listed company that courts short-term investors such as day traders, hedge funds, opportunity funds and others masquerading as long-term investors.
When these investors get impatient and frustrated with the stock price, they gossip and spread rumours like members of a sewing club, causing all kinds of gyration in the company’s shares.
The key difference in this second observation, again, is that a bank can literally collapse from having “flighty” depositors and the confidence game they ignite. In the case of a publicly listed company, however, having short-term shareholders on the register causes stress, only if you let it. As long as the company has a solid balance sheet and earnings fundamentals, the stock price should ultimately reflect its intrinsic value, as long-term investors who seek to exploit the “expectations” mismatch replace short-term investors on the register. The recent string of infrastructure asset sales is a perfect example of such “duration” matching, as pension funds align their long-dated liabilities with assets which generate predictable long-dated returns (see Exhibit 1).
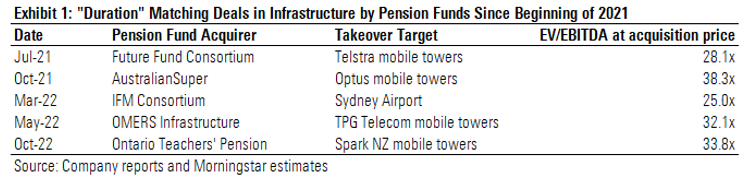
There are two key lessons from these observations for equity investors:
Lesson A—be on the lookout for shares in companies that are suffering from the “borrowing short, lending long” expectations mismatch and languishing stock prices.
Lesson B—exploit that expectations mismatch by focusing on the companies’ maintainable fundamentals and intrinsic values, taking advantage of impetuous actions of shareholders influenced by short-term concerns, news flows and herd behaviour.
Following these lessons do not guarantee investment success. The label “value trap” has been popularised to describe undervalued stocks which stay that way for donkey’s years. However, if a proper fundamental analysis based on mid-cycle margins and returns yields an intrinsic value, a struggling stock price merely increases the odds of success for a long-term investor. Pallet provider Brambles and insurance broker AUB Group, both recently removed from our Australia and New Zealand Best Ideas List due to stock price appreciation, are good real-time examples of this at work.
As a matter of fact, that is basically the modus operandi of private equity firms. Target companies whose shares are in the dumps because investors cannot stomach the pain of the upcoming capex hump or the earnings volatility of a cyclical downturn. After due diligence on the maintainable industry dynamics and company earnings drivers, the private equity firms buy these companies on low multiples on trough earnings, shield them from public scrutiny, load them up with debt, cut costs and then vend the companies back to the public market at high multiples on peak earnings (witness closely how this works, as Virgin looks to relist back on the stock market).
Exhibit 2 lists just some of the opportunistic acquisitions executed by private equity, following this well-thumbed playbook.
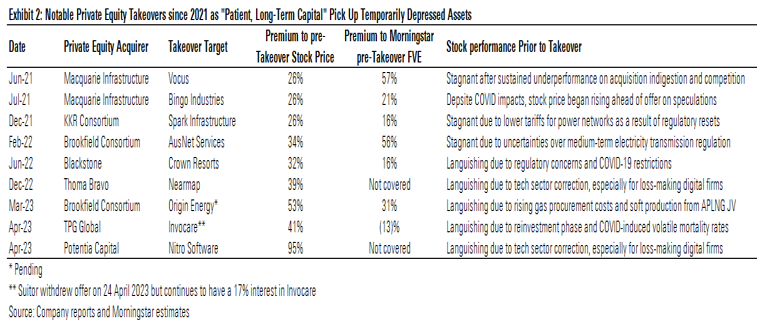
Investors give private equiteers plenty money to do these deals, as can be evidenced by Exhibit 3. This is partly because they believe in the “patient capital” marketing schtick of the leveraged buyout industry. And why not? These private equity firms can trump their typical three-to-five-year investment horizon as “patient capital”, because it is longer than the investment horizon of many fund managers (two-to-three years, at best on average), retail investors (depending on how often she pays attention to broker recommendations) and day traders (subject to how often he checks his Twitter feed).
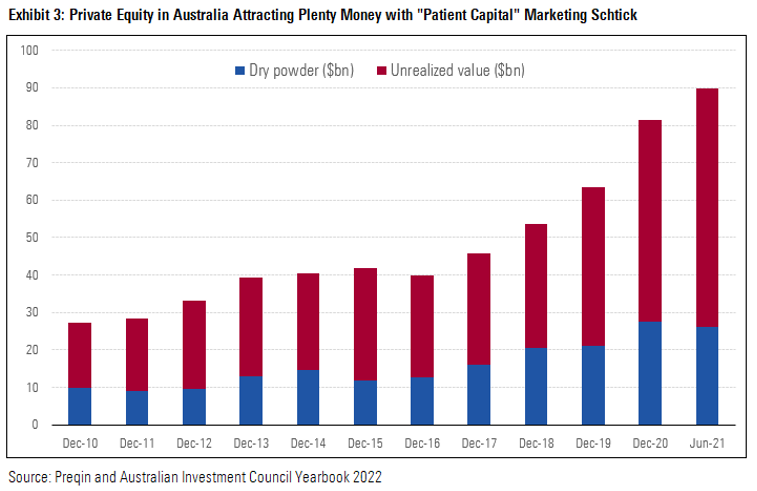
So, at current prices, what are some stocks we can apply our lessons from the SVB collapse? We have filtered Morningstar’s Australia and New Zealand coverage universe for shares trading at more than 20% discount to our fair value estimates. This ticks the “languishing stock prices” box in Lesson A. We then filtered that list for stocks that fit the “borrowing short, lending long” expectations mismatch between the company and its shareholders. Finally, we filtered the list to include only those companies with economic moats and sound balance sheets on Morningstar analysts’ leverage metrics, thereby ticking the “maintainable fundamentals and intrinsic values” box in Lesson B. Exhibit 4 shows the stocks that came through all those filters.
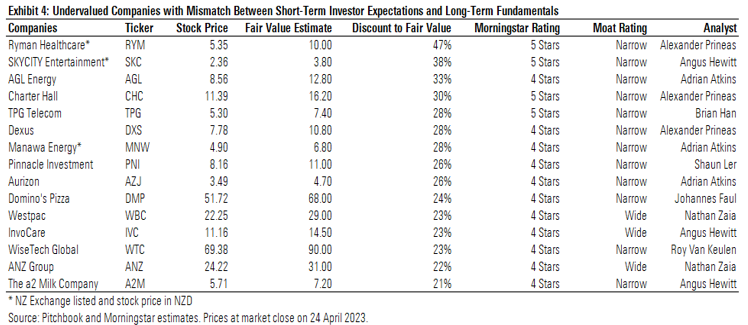
A couple of points to draw out from Exhibit 4. Firstly, given the moat ratings of the companies on the list, it goes without saying our analysts believe they have durable competitive advantages. As such, the current stock price discounts to fair value estimates are akin to the market not seeing the forest for the trees, due to overemphasis on near-term concerns, albeit our analysts’ views could turn out to be incorrect. Secondly, every single company on the list has downside risks, even those with relatively resilient revenue profiles (Aurizon, Manawa Energy, Ryman Healthcare, Invocare, TPG Telecom, ANZ Group, Westpac). The risks may be short-term earnings-, ESG-, interest rate-, capital expenditure or just general market-related. But that is precisely why their shares are at a discount to our fair value estimates. If these companies did not have any risks, their shares would not be cheap, and we wouldn’t be having this conversation!
These names provide a good starting point for investors wishing to take the other side of trades that are currently dominated by shorter term-focused investors. They are the stocks readers may want to look deeper into, as pretend private equity barbarians (but without the debt!), and test the merits of this thing called patient, long-term value investing. It does not guarantee success and untold wealth. But it gives investors a decent shot at doing well, particularly as equity investing has the eighth wonder of the world on its side, the magic of compound earnings. A couple of nonagenarian who run a company called Berkshire Hathaway in the U.S. can attest to it, as can their numerous illustrious disciples all over the world.
Sustainable Investment Flows Plummet Q1 2023 The Australasian (Australia and New Zealand) sustainable funds universe inflows plummeted this quarter, down 91.97% in the previous quarter, or 78.30% adjusted. While a significant one-off boost to flows occurred last quarter due to the merger between Australian Ethical and Christian Super, even when adjusting for this event, sustainable flows were buoyant in the fourth quarter of 2022, attracting AUD 970 million adjusted inflows, or up 110%, in the third quarter of 2022. All in all, this quarter’s flows were significantly lower than the previous quarter—net positive inflows were AUD 214 million, down by AUD 2.459 billion (or AUD 775 million adjusted)—compared with the previous quarter. Given the market volatility experienced this quarter, exacerbated by U.S. regional bank insolvencies, and concerns around the viability of European bank Credit Suisse (since acquired by UBS), it is not surprising that investor confidence was tested. On top of this, interest rates continued to rise, increasing concerns of the risk of recession.
The surprising outcome this quarter was indexing giant Vanguard experiencing net outflows. Vanguard has the second-highest sustainable investment market share, and typically records strong inflows relative to its sustainable peers. Its outflows are at odds with peers who generated positive inflows, albeit at a more anemic pace than the previous quarter. When it comes to sustainable investing, DFA continues to be the firm to watch, accumulating the highest net flow for sustainable investments this quarter.
Passive flows outpaced active flows in the first quarter, attracting AUD 113.29 million, equating to 59.25% of all inflows; active strategies accumulated AUD 77.91 million. This is the opposite experience of the previous quarter where active inflows dominated, securing 80% of all sustainable flows.
The top five fund houses by sustainable funds-under-management market share are Australian Ethical with 17.19%, index provider Vanguard Investments Australia with 12.72%, DFA Australia with 10.36%, ETF provider Beta Shares with 9.31%, and Mercer Investments (Australia) Limited with 5.13%.
This quarterly paper highlights recent flow trends within sustainable retail investments in Australia.
Key Takeaways
- Flows into sustainable assets plummeted in the first quarter of 2023, down by AUD 2.459 billion, or in percentage terms, 91.97% less than the previous quarter (or down AUD 775 million and 78.30% adjusted for merger activity). Although sustainable flows were still net positive, they totaled an anemic AUD 214 million.
- Retail assets invested in Australasian-domiciled sustainable funds, as identified by Morningstar, totaled AUD 46 billion at the end of the first quarter of 2023, which was an increase of more than AUD 2 billion, or an increase of 4.53% from the previous quarter. While the first quarter of 2023 was difficult for sustainable investors, sustainable asset flows have continued to be more resilient when compared with the broader market. × When it comes to sustainable investing, passive strategies were favoured this quarter with 59% of inflows going to passively managed strategies. This bucks the previous quarter’s trend, which saw only 20% of net flows invested into passive strategies.
- Indexing giant Vanguard experienced outflows, which was at odds with its sustainable peers, its previous quarter’s trends, and the slight tilt to passive strategies witnessed this quarter.
Product Launches
Compared with Europe and the Unites States, the sustainable funds market remains relatively small in Australia. There were just two new sustainable funds launched in the first quarter of 2023: both active sustainable credit strategies from Janus Henderson, which included one managed fund and one active ETF. Launches are significantly lower than the previous quarter where there were eight new funds launched—seven active and one passive. We have observed when new sustainable strategies are launched, they tend to be skewed to active approaches.
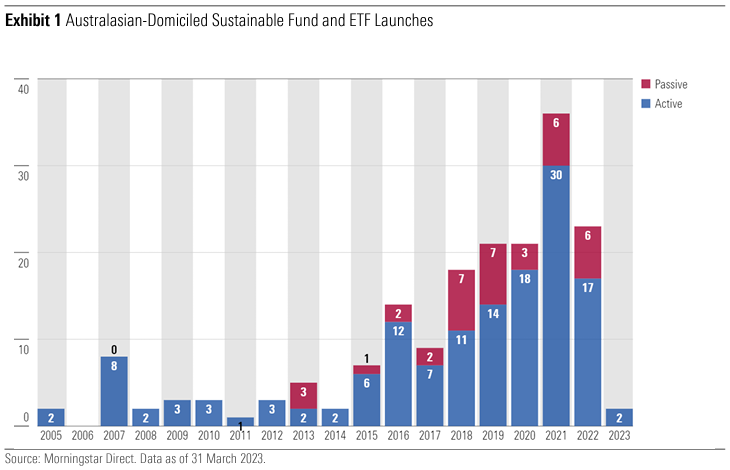
Overall, the trend of new sustainable products being brought to market remains strong. In 2022, we saw a total of 23 new funds launched. While this was 13 fewer funds than in 2021, it was the secondhighest year of fund launches on record. However, this metric does not capture asset managers repurposing and rebranding conventional products into sustainable offerings. Finally, the sustainable funds universe does not contain the growing number of Australasian funds that now formally consider environmental, social, and governance factors in their security selection.
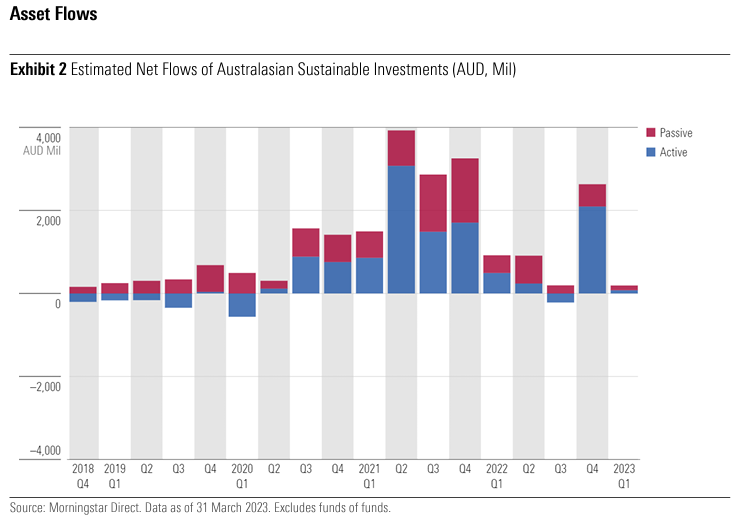
- We saw a steep drop off in flows with an estimated AUD 214 million invested into sustainable strategies, down by AUD 2.459 billion, or in percentage terms, 91.97%, less than the previous quarter (or down AUD 775 million and 78.30% adjusted for merger activity). Given the market volatility we experienced this quarter, exacerbated by U.S. regional bank insolvencies, and concerns around the viability of European bank Credit Suisse (since acquired by UBS) it is not surprising that investor confidence was tested. The continued rising interest rates also increased concerns of the risk of recession.
- To provide context we compared all sustainable investment flows with the broader market flows. The enduring trend of sustainable fund flows being more resilient than the broader market remains intact. Across the three-year period in every quarter except of the first quarter of 2020, when sustainable funds produced a small outflow of AUD 38 million due to the pandemic, sustainable fund flows have been consistently positive. The sustainable funds pandemic outflow was insignificant in comparison to the broader market outflow of AUD 2.184 billion. While the magnitude of sustainable inflows does ebb and flow in line with market conditions, tougher market conditions have tended to correspond with lower inflows, and the resilience of inflows compared with the broader market is indisputable. There have been five-consecutive quarters of outflows from the broader market to date, and during that same time, there have been positive inflows into sustainable investments. Quarters two and three in 2022 were significant examples of this, with the broader market experiencing significant outflows of AUD 12.16 billion and 7.48 billion, respectively, while sustainable strategies were able to maintain net positive flows.
- When it comes to sustainable investing, passive strategies were favoured this quarter with 59% of inflows going to passively managed strategies. This bucks the previous quarter’s trend, which saw only 20% of net flows invested into passive strategies.
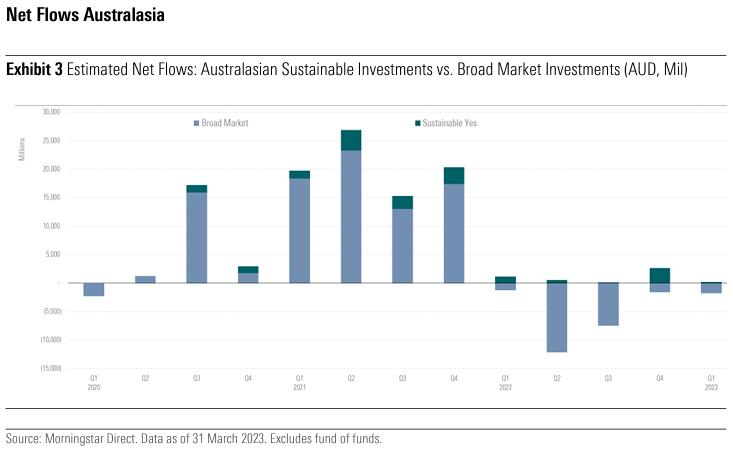
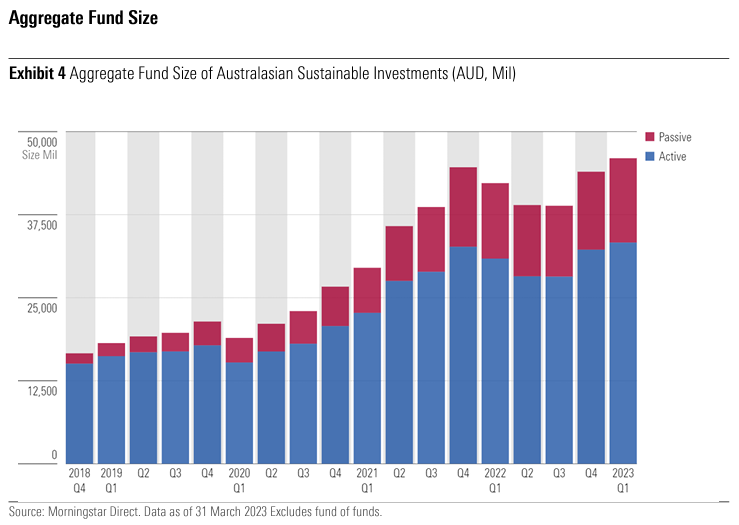
- Despite market challenges likely influencing the significant slowing of inflows experienced this quarter, assets in Australasian sustainable funds increased in size in the first quarter of 2023, up more than AUD 2 billion via a combination of market movements and inflows. The total size of Australasian sustainable investments is estimated to be AUD 46 billion, up from the previous quarter’s record-breaking total of AUD 43.96 billion, equating to an increase of 4.53%.
- Australian Ethical, with total assets of AUD 7.905 billion, is the dominant Australasian provider of sustainable strategies in the Morningstar database, followed by Vanguard Investments Australia with AUD 5.850 billion, and DFA Australia Limited trailing with AUD 4.764 billion. With two new strategies launched in the first quarter of 2023, we count 201 strategies in our Australasian sustainable fund universe.
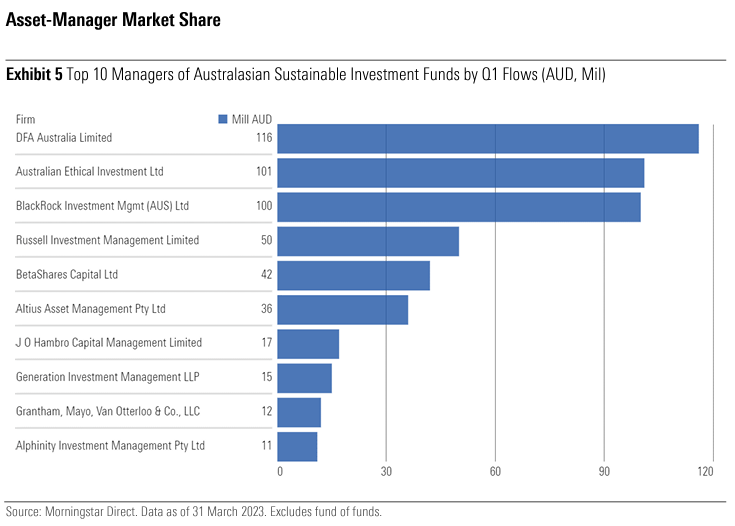
- DFA captured the most inflows of any fund house this quarter and remains the one to watch. They have been steadily growing assets each quarter, culminating in AUD 116 million of net flows—15 million higher than Australian Ethical and 16 million higher than BlackRock. Notable in their absence is indexing giant Vanguard, missing from the top 10 in net flows. Vanguard is typically among the top gatherers of assets each quarter; however, this time it delivered net outflows.
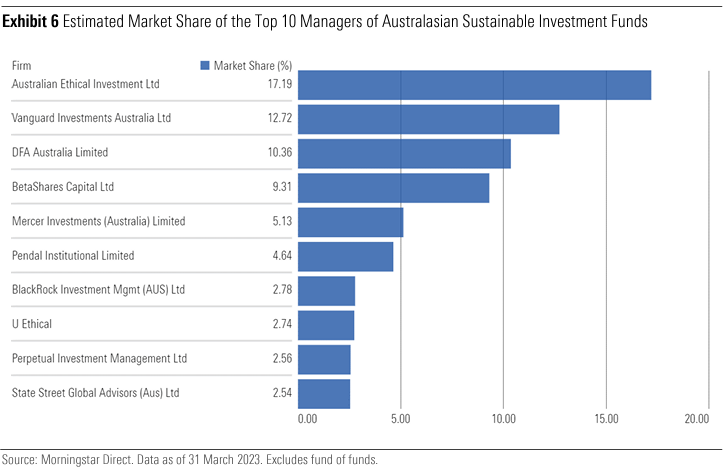
- The Australian sustainable funds market remains concentrated, with the top 10 funds accounting for 70% of total assets in the sustainable fund universe.
- At the fund level, asset managers Australian Ethical (17.19%) and Vanguard (12.72%) continue to dominate, accounting for just under 30% of all Australasian sustainable fund assets in the Morningstar database. However, Dimensional is one to watch; it has been steadily growing assets each quarter maintaining its position in third place for market share (10.58%) and achieved the highest net sustainable flows this quarter.
- Last quarter’s new entrant into the top 10 by market share, SSGA, which debuted at number nine, dropped to 10th spot. U Ethical was a new entrant this quarter, coming in at number eight; Russell dropped out of the table altogether, previously in 10th position, despite delivering solid inflows of AUD 50 million for the quarter.
Despite the very long-term nature of the Australian superannuation system, investors can move between options and super funds on a daily basis.
This liquidity mechanism afforded to investors means the liquidity profile of a fund cannot be ignored. But looking at the level of illiquid assets as a proportion of total assets is only part of the story. Understanding the future cash flow profile and member demographics of the fund also gives an indication of the sustainability of the level of illiquid assets.
While liquidity stress-testing is required to be conducted by funds under SPG530 – Investment Governance, the level of public disclosure on this issue is limited. We attempt to piece together some key metrics of a handful of large funds to see how they stack up.
The five funds selected for the purposes of this analysis are:
- Australian Retirement Trust
- AustralianSuper
- Aware Super
- Cbus
- UniSuper
Of the roughly $2.25 trillion of total fund assets reported to APRA as of June 30, 2022, these five funds reporesented almost 40% of this pool.
Unlisted allocations of the big funds
This analysis uses the Portfolio Holdings Disclosures of super funds, which specifies a fund’s allocation to “unlisted” assets for a particular option. The funds’ larger options, typically in the balanced and growth categories, have been selected for the analysis.
Measuring illiquidity is challenging, and while “unlisted” does not equal “illiquid”, unfortunately the liquidity ladders of super funds are not made available. That is, the assumed proportion of a fund that could be liquidated in one week, four weeks, three months, one year and so in is not disclosed.
So, in the absense of disclosure, “unlisted” will crudely be used as a proxy for “illiquid”.
While the definitions may be imperfect the analysis shows that there are varying levels of unlisted assets held across these large super funds’ options.
Australian Retirement Trust’s Lifecycle Balanced Pool holds the highest level of unlisted assets at 34%; UniSuper’s Balanced Option holds the lowest level at 13%, and AustralianSuper’s Balanced Option sits at around 31%.
The level of illiquid allocations as a percentage of the total portfolio will move around – particularly in periods of volatile listed markets.
When listed markets are declining in value and illiquid markets are either remaining static (due to mark to market pricing stability) or declining to a lesser degree, the illiquid allocation will naturally become a higher proportion of the portfolio through this period.
Mark to market is a method of adjusting assets and liabilities, and considers what an asset would sell for if it were sold on the open market, regardless of what was actually paid for it.
During 2022, we witnessed a strong selloff in both listed equities and bonds, and a weak Australian dollar. This selloff did not impact the asset prices of private markets to the same degree and, as a result, it’s likely that some of these unlisted allocations are slightly higher than fund targets and what you’d expect during more normal market conditions.
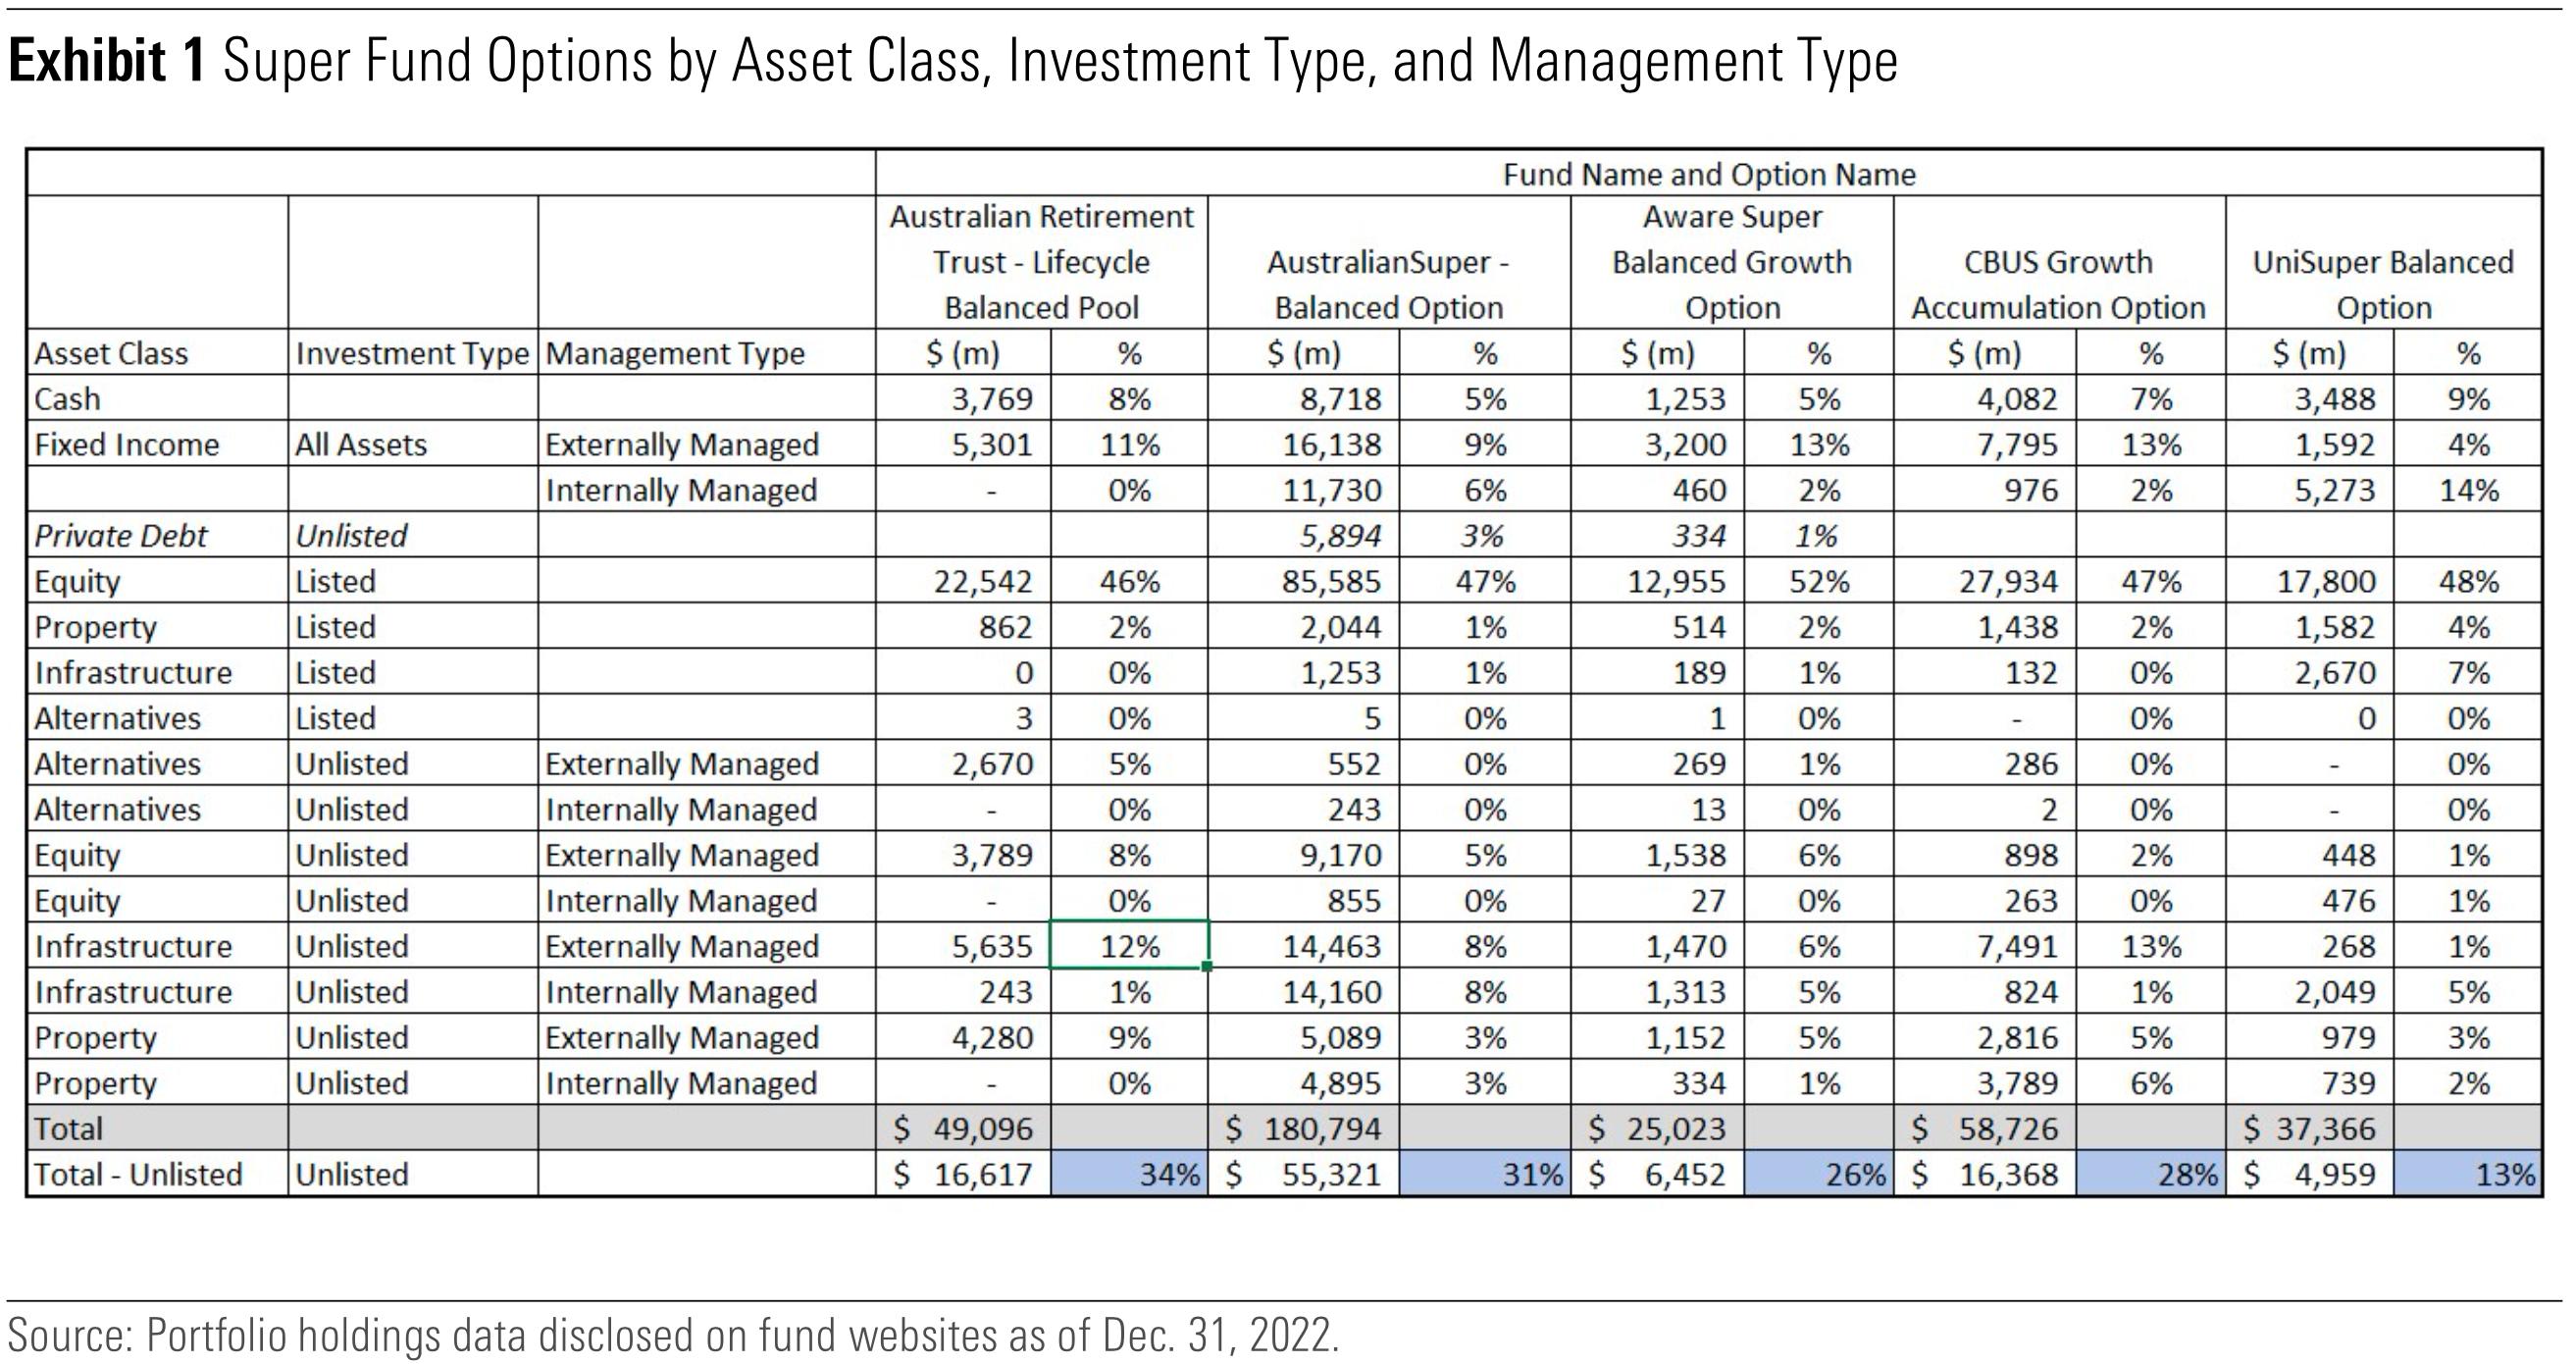
Illiquidity through another lens
Another way of understanding the nature of assets held by superannuation funds is to dig through the annual financial statements where the accounting standards require a breakdown of estimated fair values for different market types using a hierarchy.
The hierarchy basically scales from Level 1 (mainly listed equities where there are readily available quoted market prices) through to Level 3 where there isn’t observable market data and therefore fair values are based on unobservable inputs. The more-illiquid assets such as infrastructure, private credit, property, and private equity are typically included in this third level.
Based on the 2022 financial statements from the five funds, the proportion of Level 3 assets relative to the fund’s total net assets is shown in the table below.
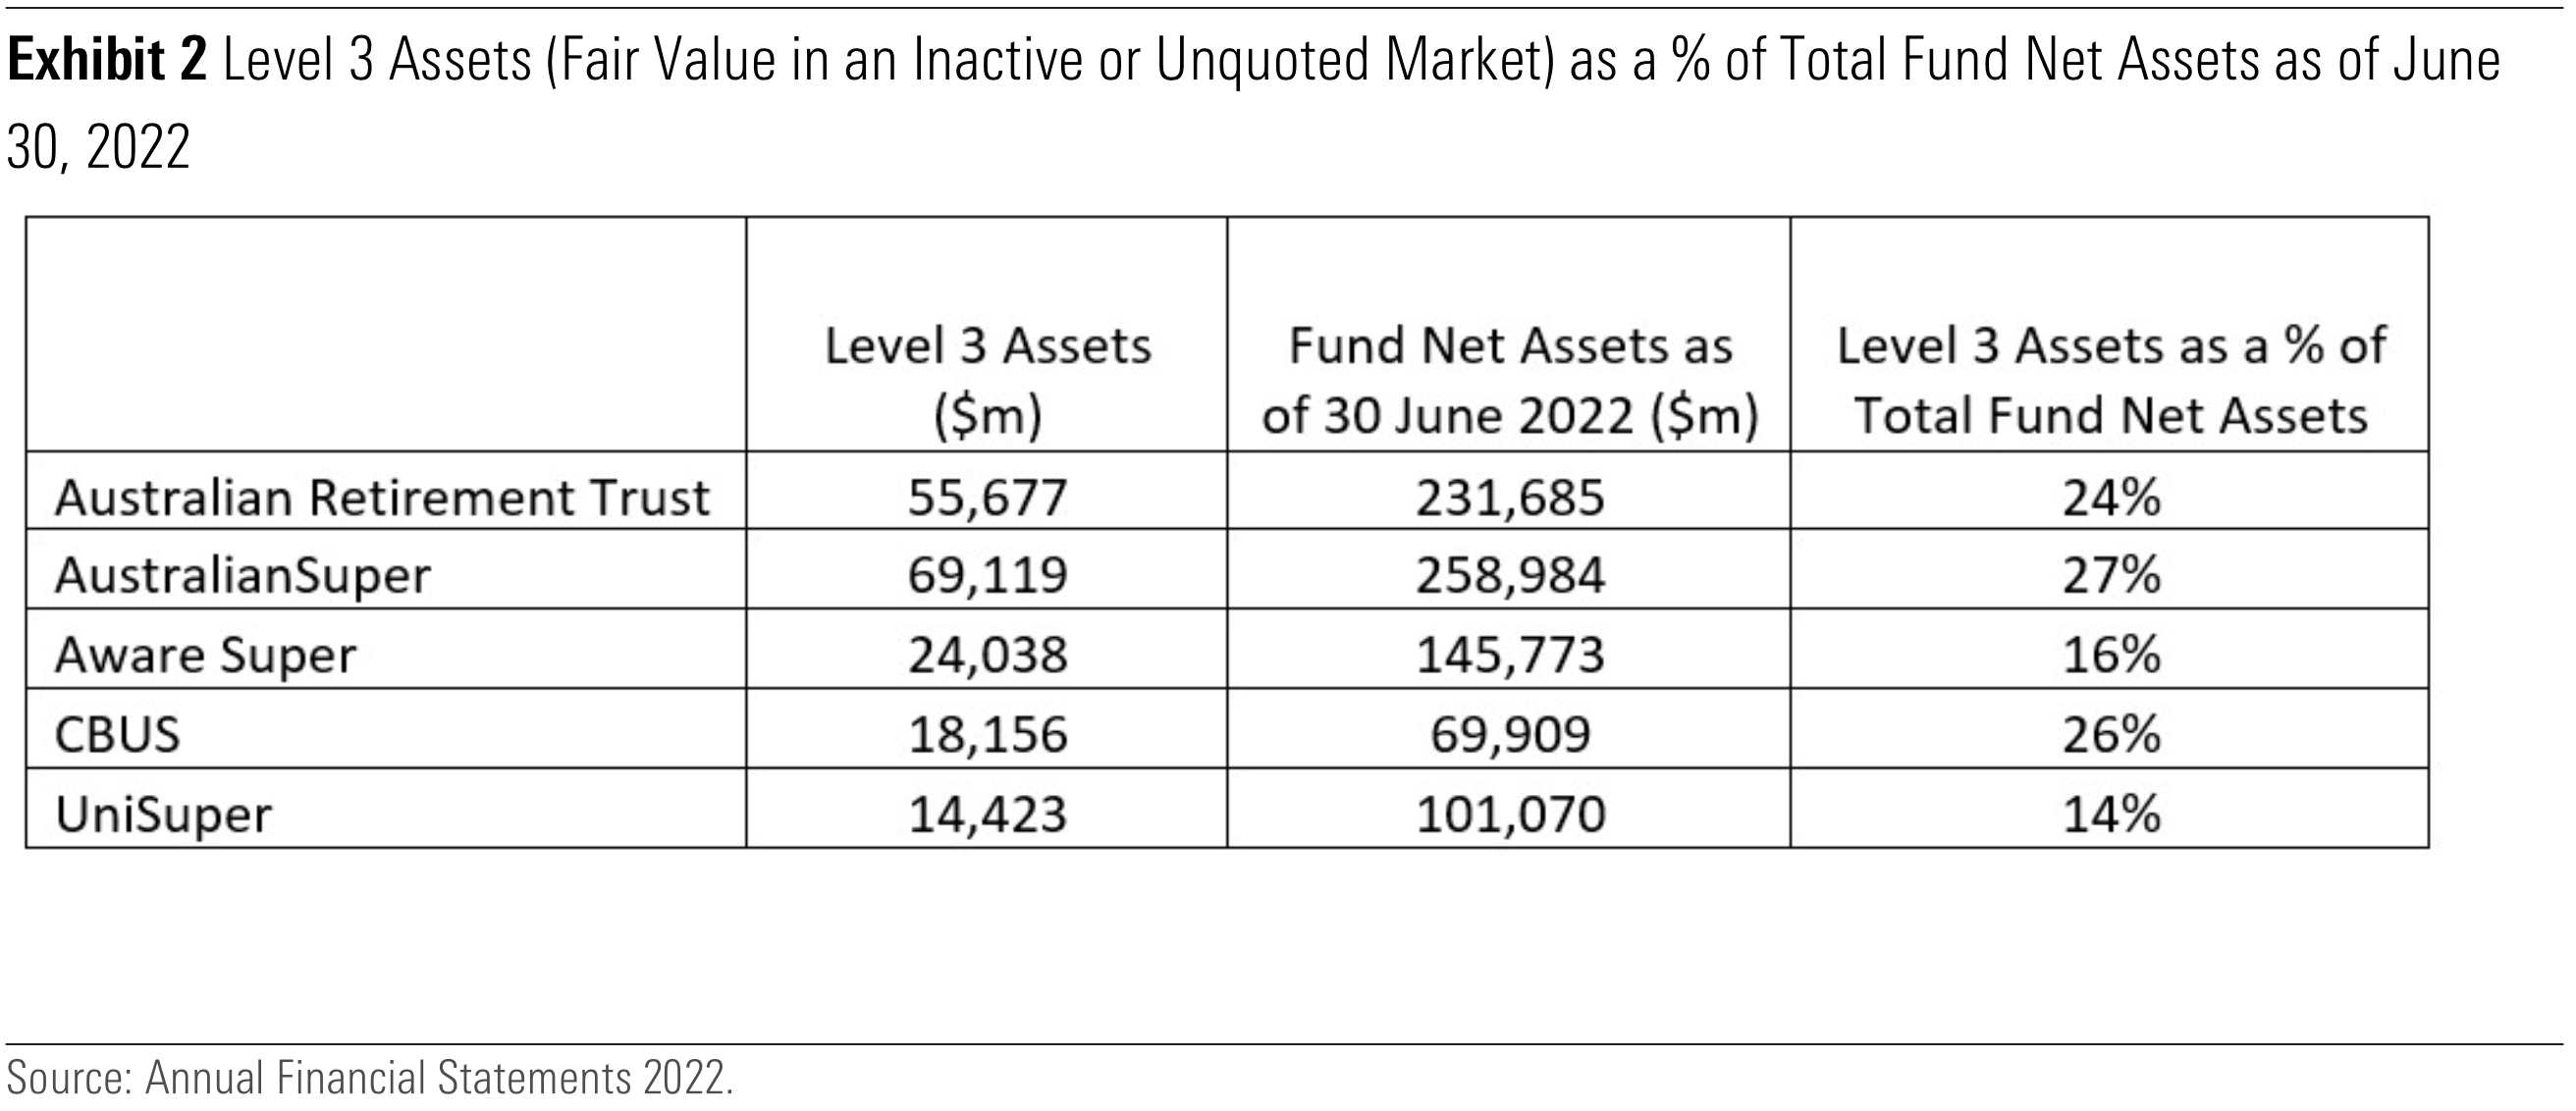
Exhibits 1 and 2 are not perfectly comparable given one considers each fund’s assets invested in Level 3 assets and the other considers a particular funds option’s exposure to unlisted assets. Each fund has a number of other options (including equity-only options that are highly liquid). It makes sense that at a total fund level, there would be a different total of illiquid assets.
What do the funds say?
Of course, the other method of defining levels of liquidity is to just ask the superannuation funds for their interpretation.
Undoubtedly the investment teams have applied some deep thinking to this problem, and their interpretations are displayed in the table below:
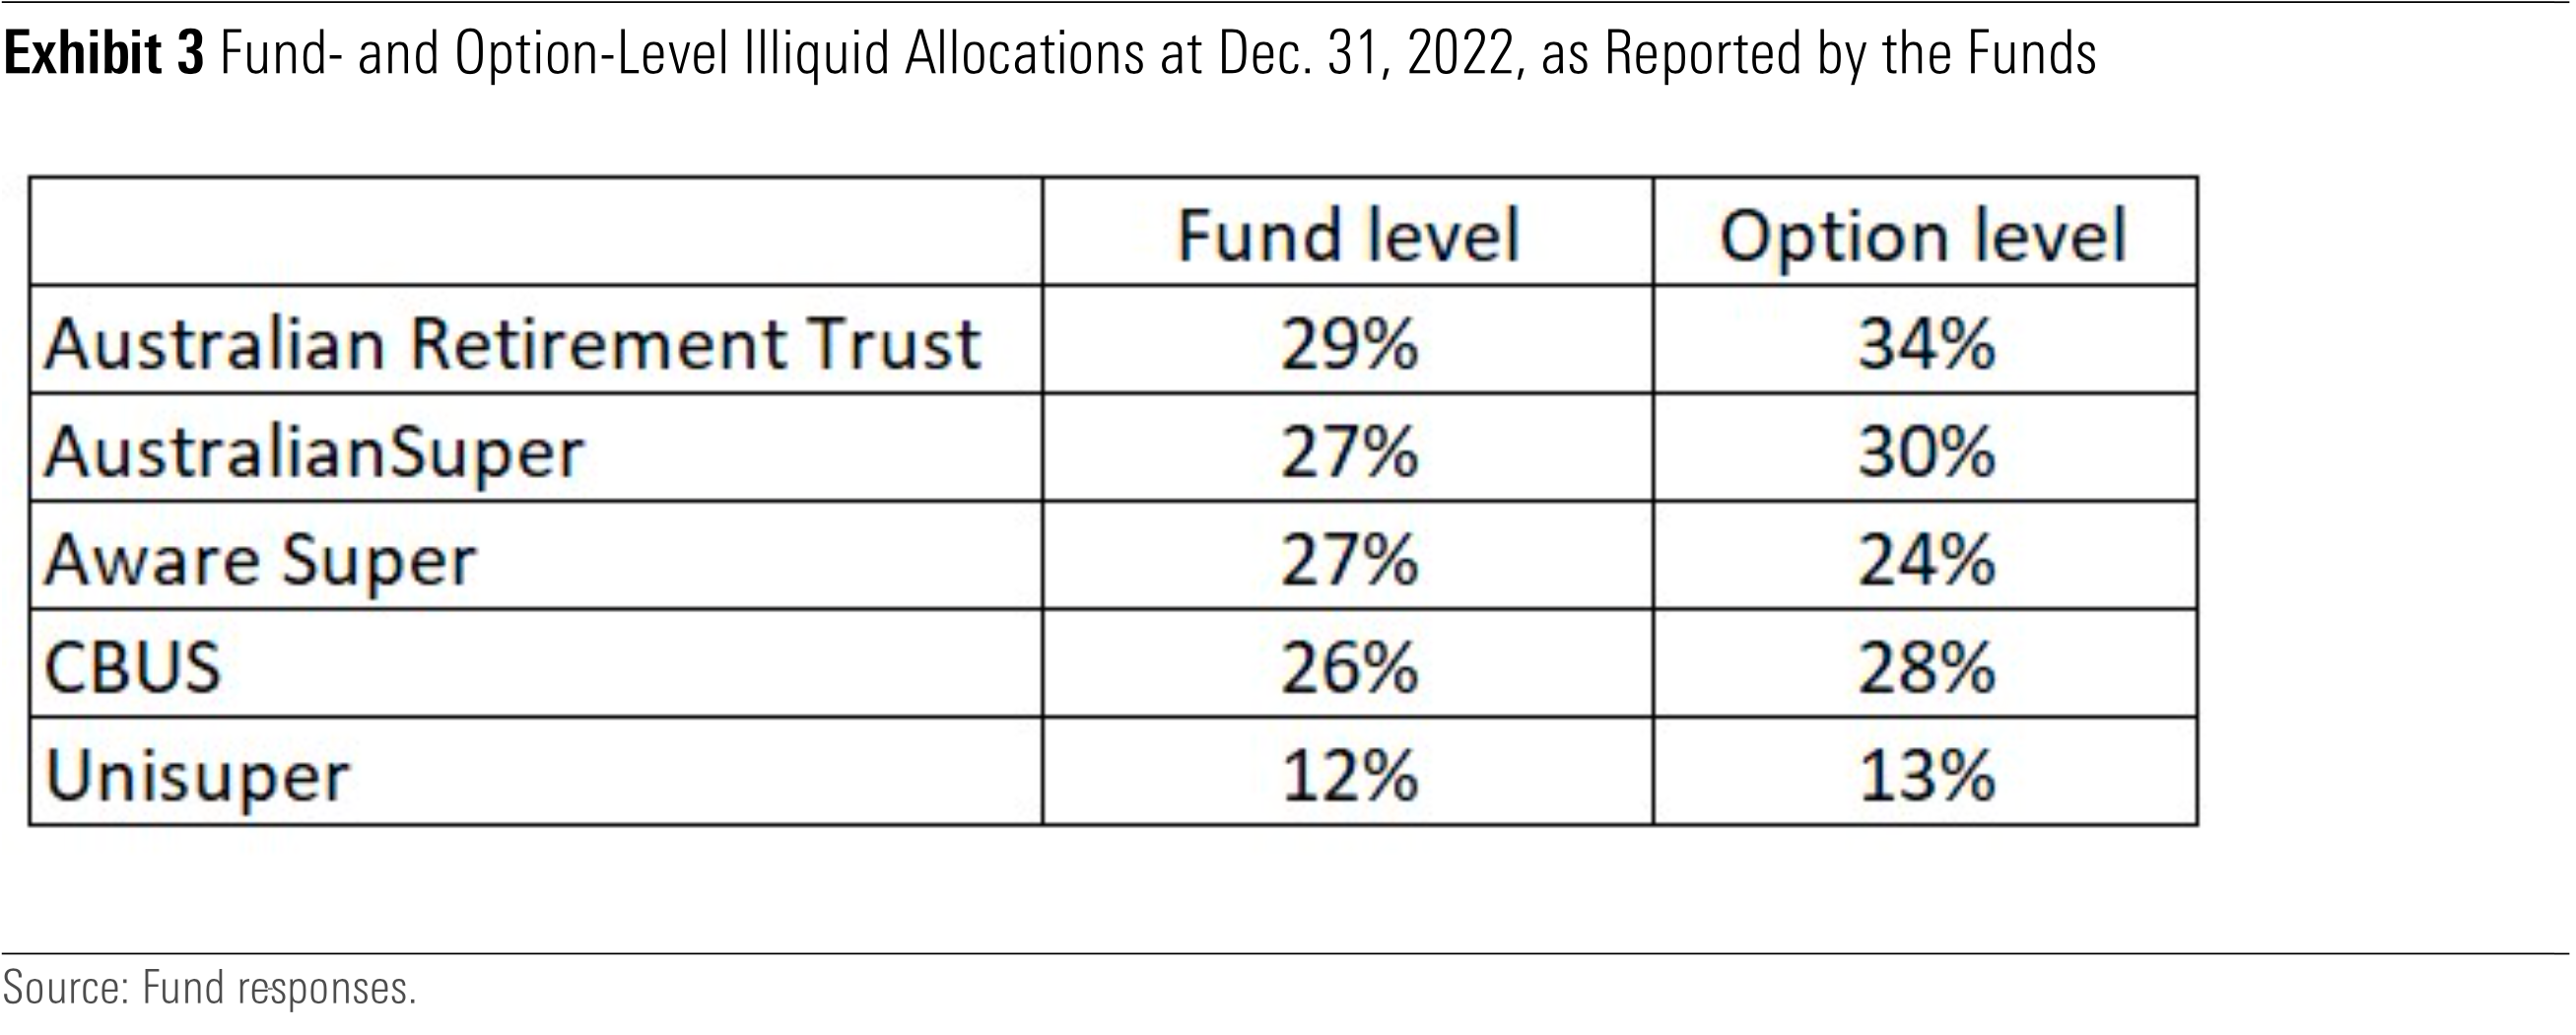
Money coming in; money going out
When it comes to liquidity, the money coming into or moving out of a fund is highly relevant.
To illustrate the point using an extreme example, if a fund has net assets of $100, and in Scenario 1 the net assets double each year, the illiquid allocation diminishes very quickly. Conversely, if a fund has net assets of $100, and in Scenario 2 the net assets halve each year, the illiquid allocation ramps up very quickly.
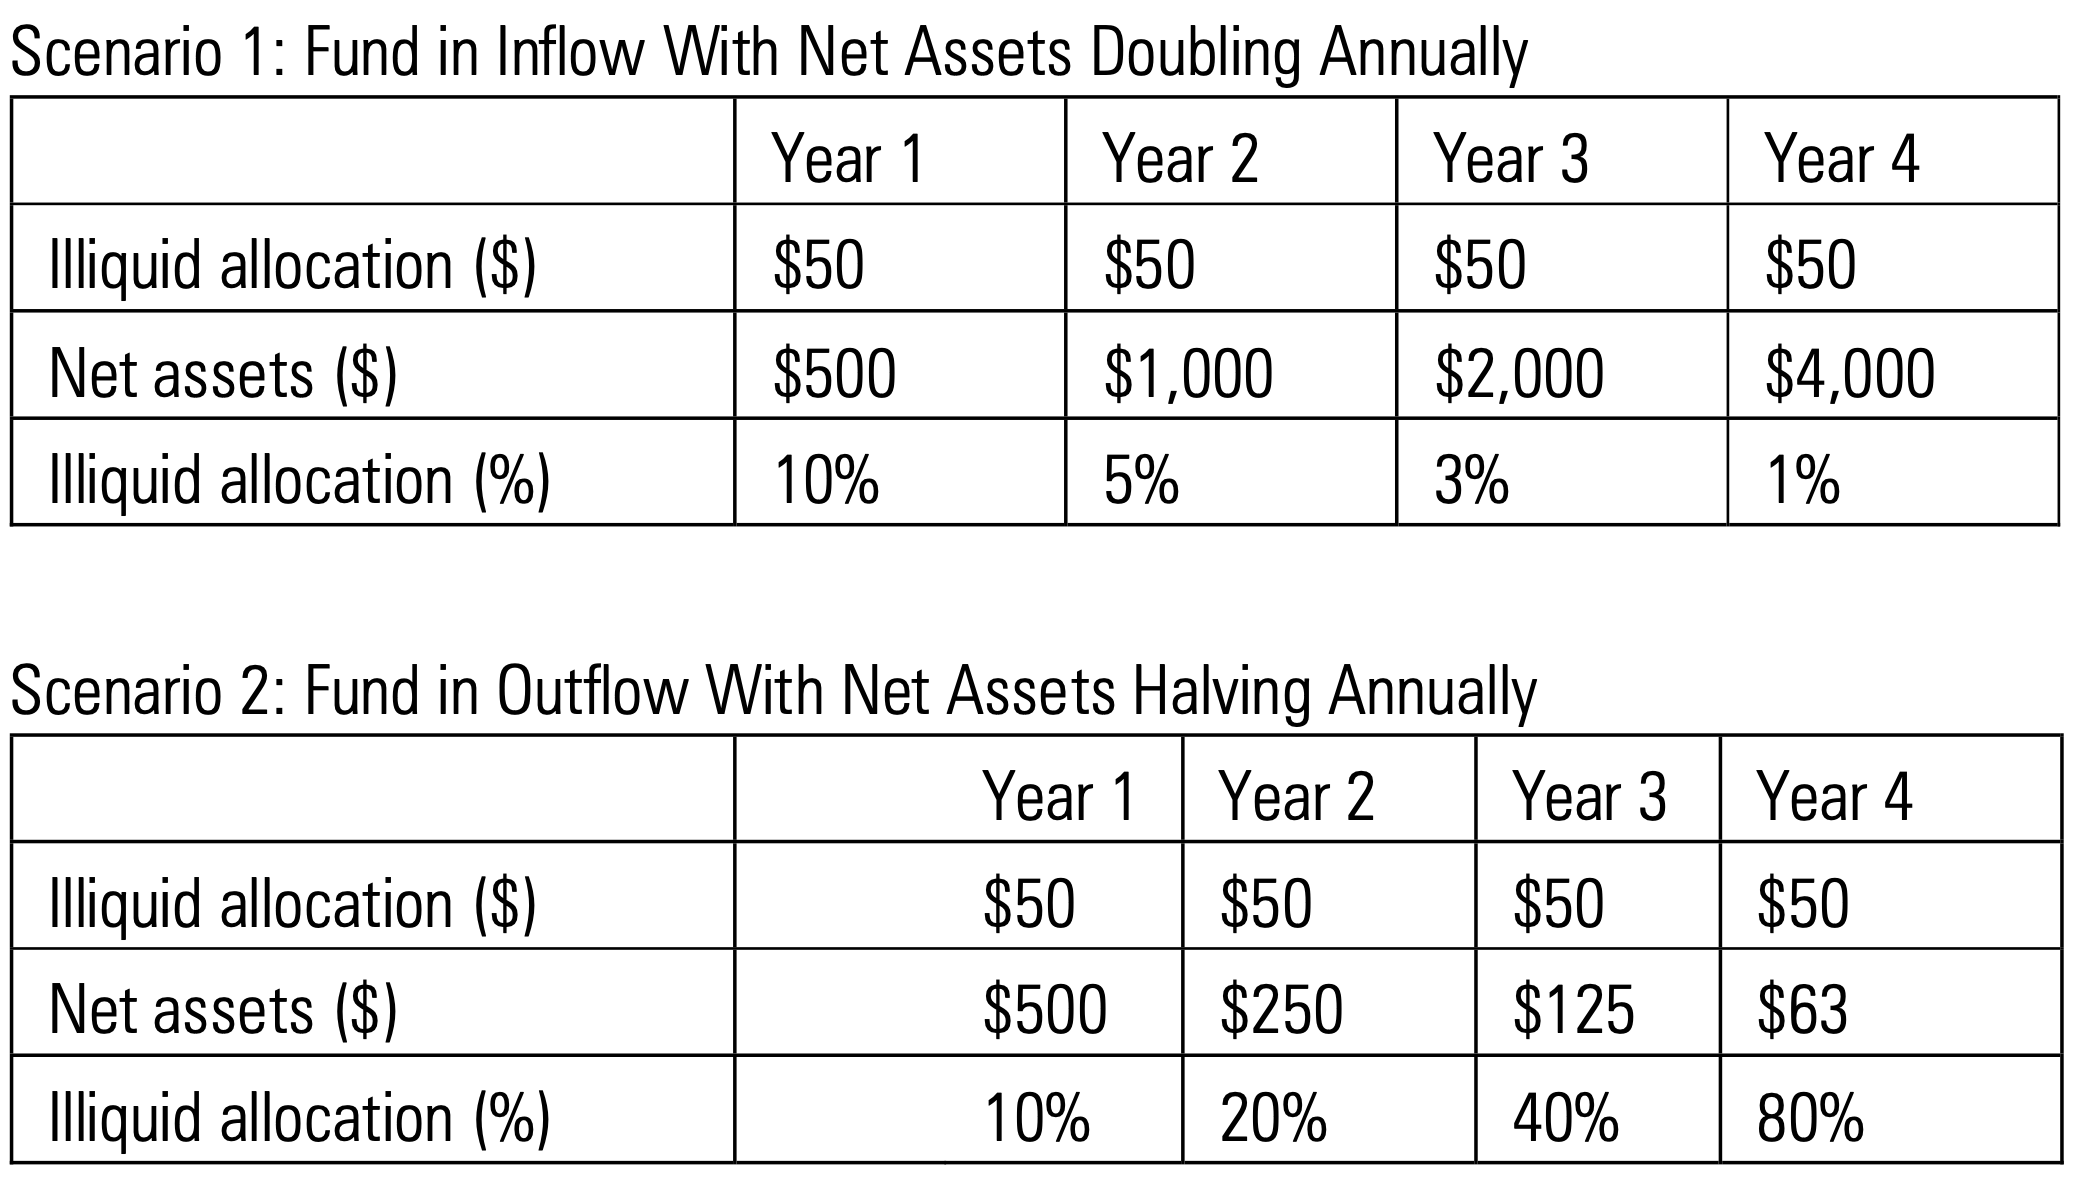
Inflows and outflows matter. And each year under APRA’s annual fund-level superannuation statistics, funds must disclose the level of flows broken down by member contributions (inflow), member benefit payments (outflow), rollovers (inflow/outflow), and flows as a result of merger activity.
The Conexus Institute established a neat framework for thinking about the types of flows in their State of Super 2023 Booklet.
For the purposes of considering the liquidity profile of a fund, the table below considers “total members’ benefit flows in” (that is, superannuation employer and member contributions) and “total benefit payments” (that is, lump-sum withdrawals and pension payments), termed “Natural flows” in the Conexus Institute’s research.
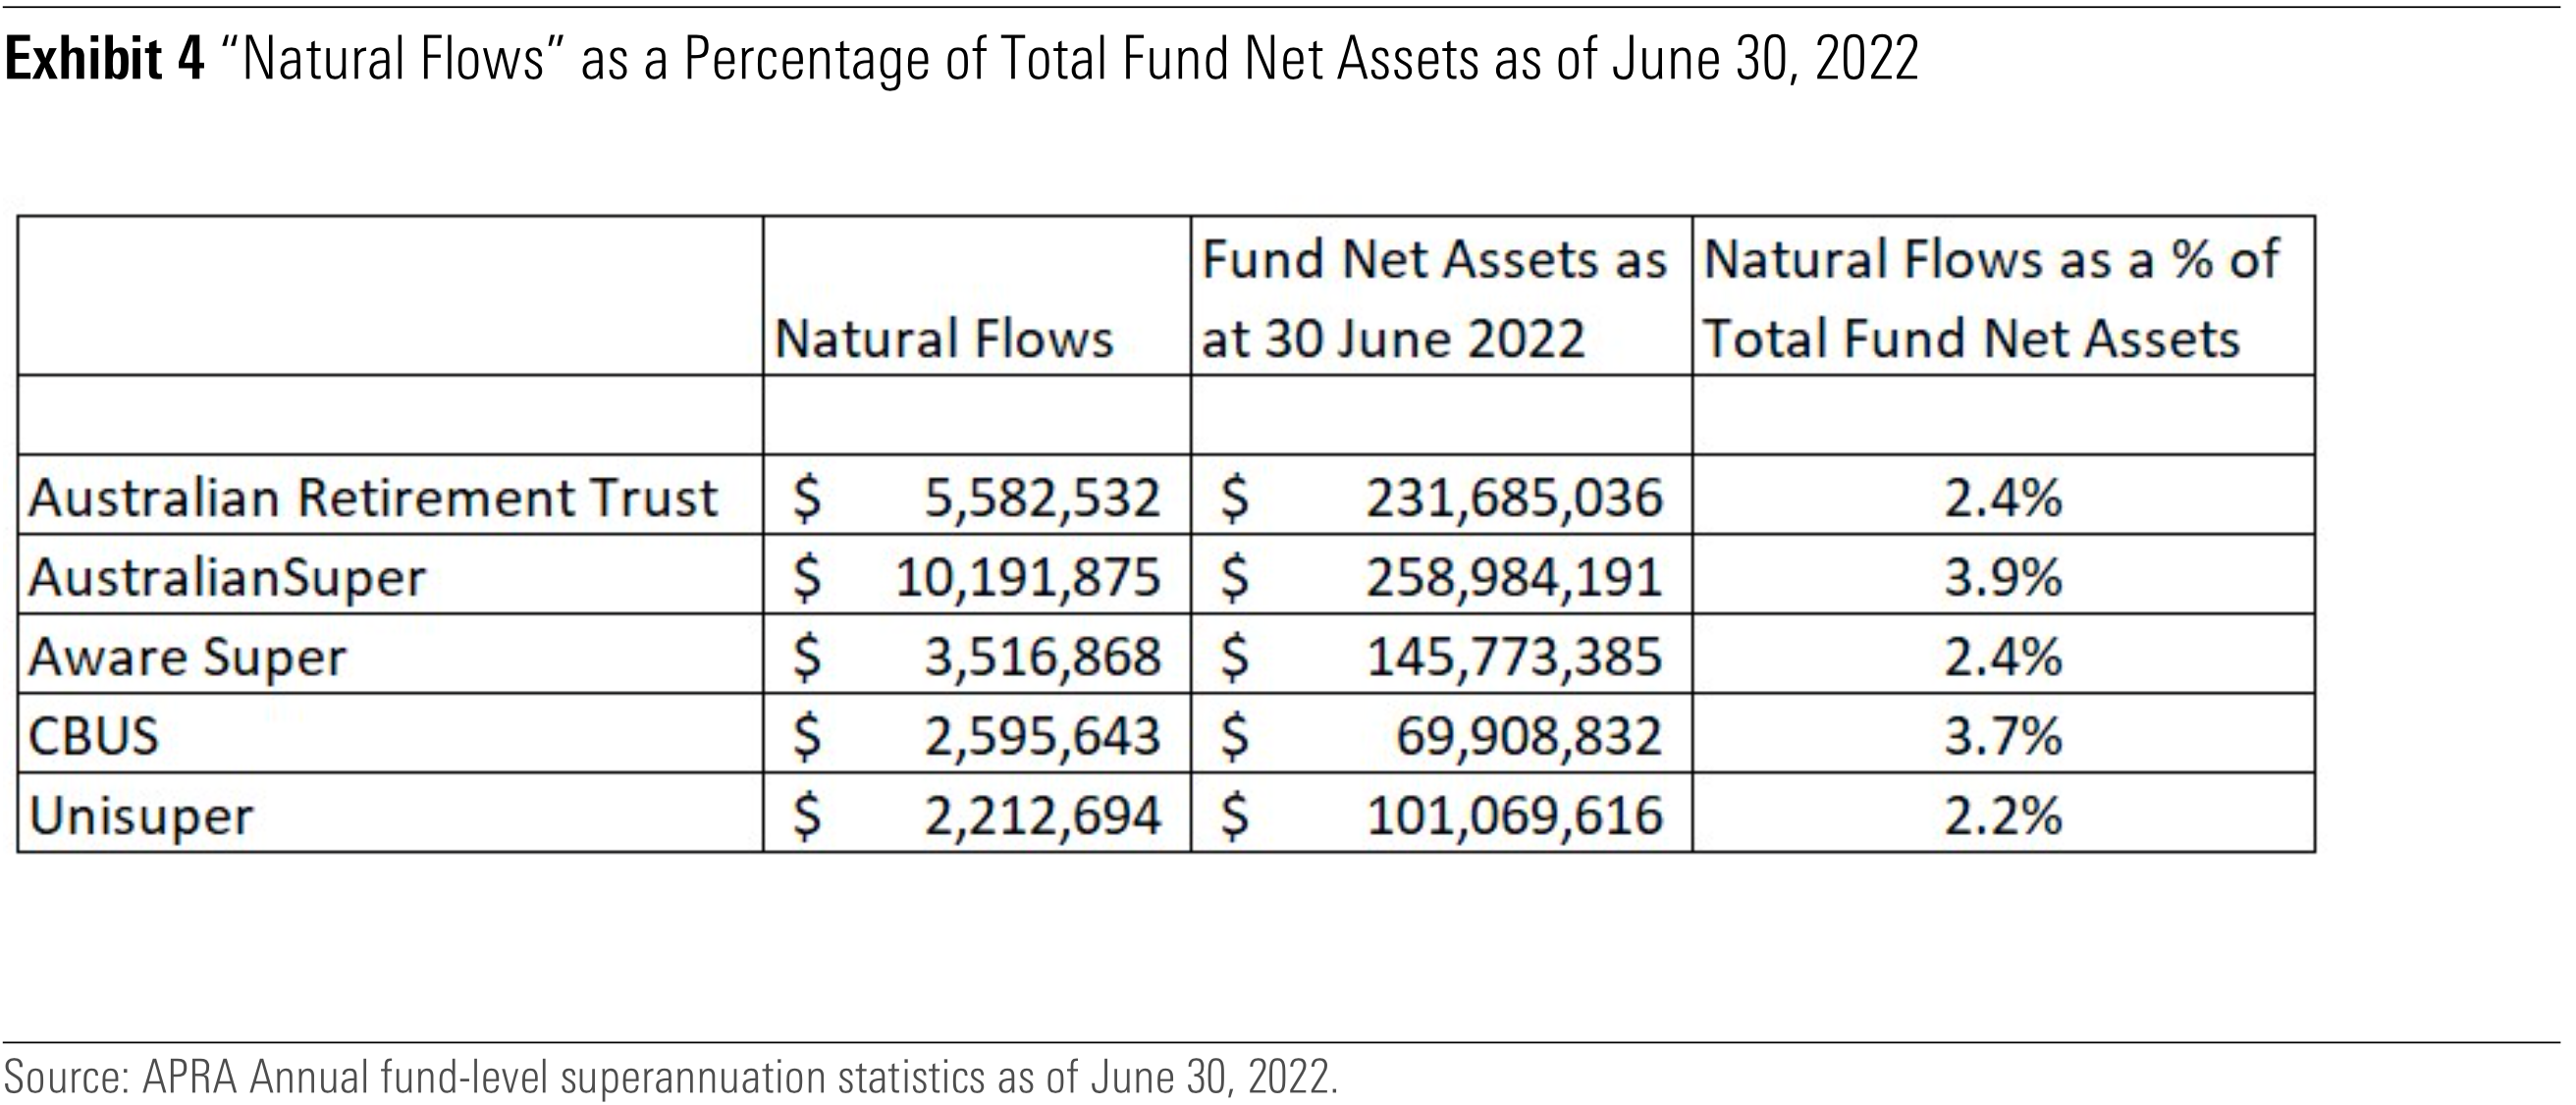
Exhibit 4 shows that when it comes to natural flows, both in absolute terms and as a percentage of total fund net assets, AustralianSuper is winning the war. It’s worth highlighting that Cbus is also doing a very good job of capturing flows as a percentage of its net asset base.
Member demographics and cash flows
“Natural flows” will be impacted by the demographics of a member base.
For example, an older member base will likely be drawing down their superannuation rather than contributing to it. Further, how the profile of a member base changes over time should also impact the liquidity profile of a fund.
If a fund knows that a significant portion of its member base is nearing retirement and will either start drawing down its super balance or switch funds, liquidity levels should shift in response.
As shown in Exhibit 5, some funds have a significantly higher proportion of their member base who are decumulating. Hostplus and Rest superannuation funds have been included in Exhibit 5 to contrast the proportions for funds with a substantially younger member profile.
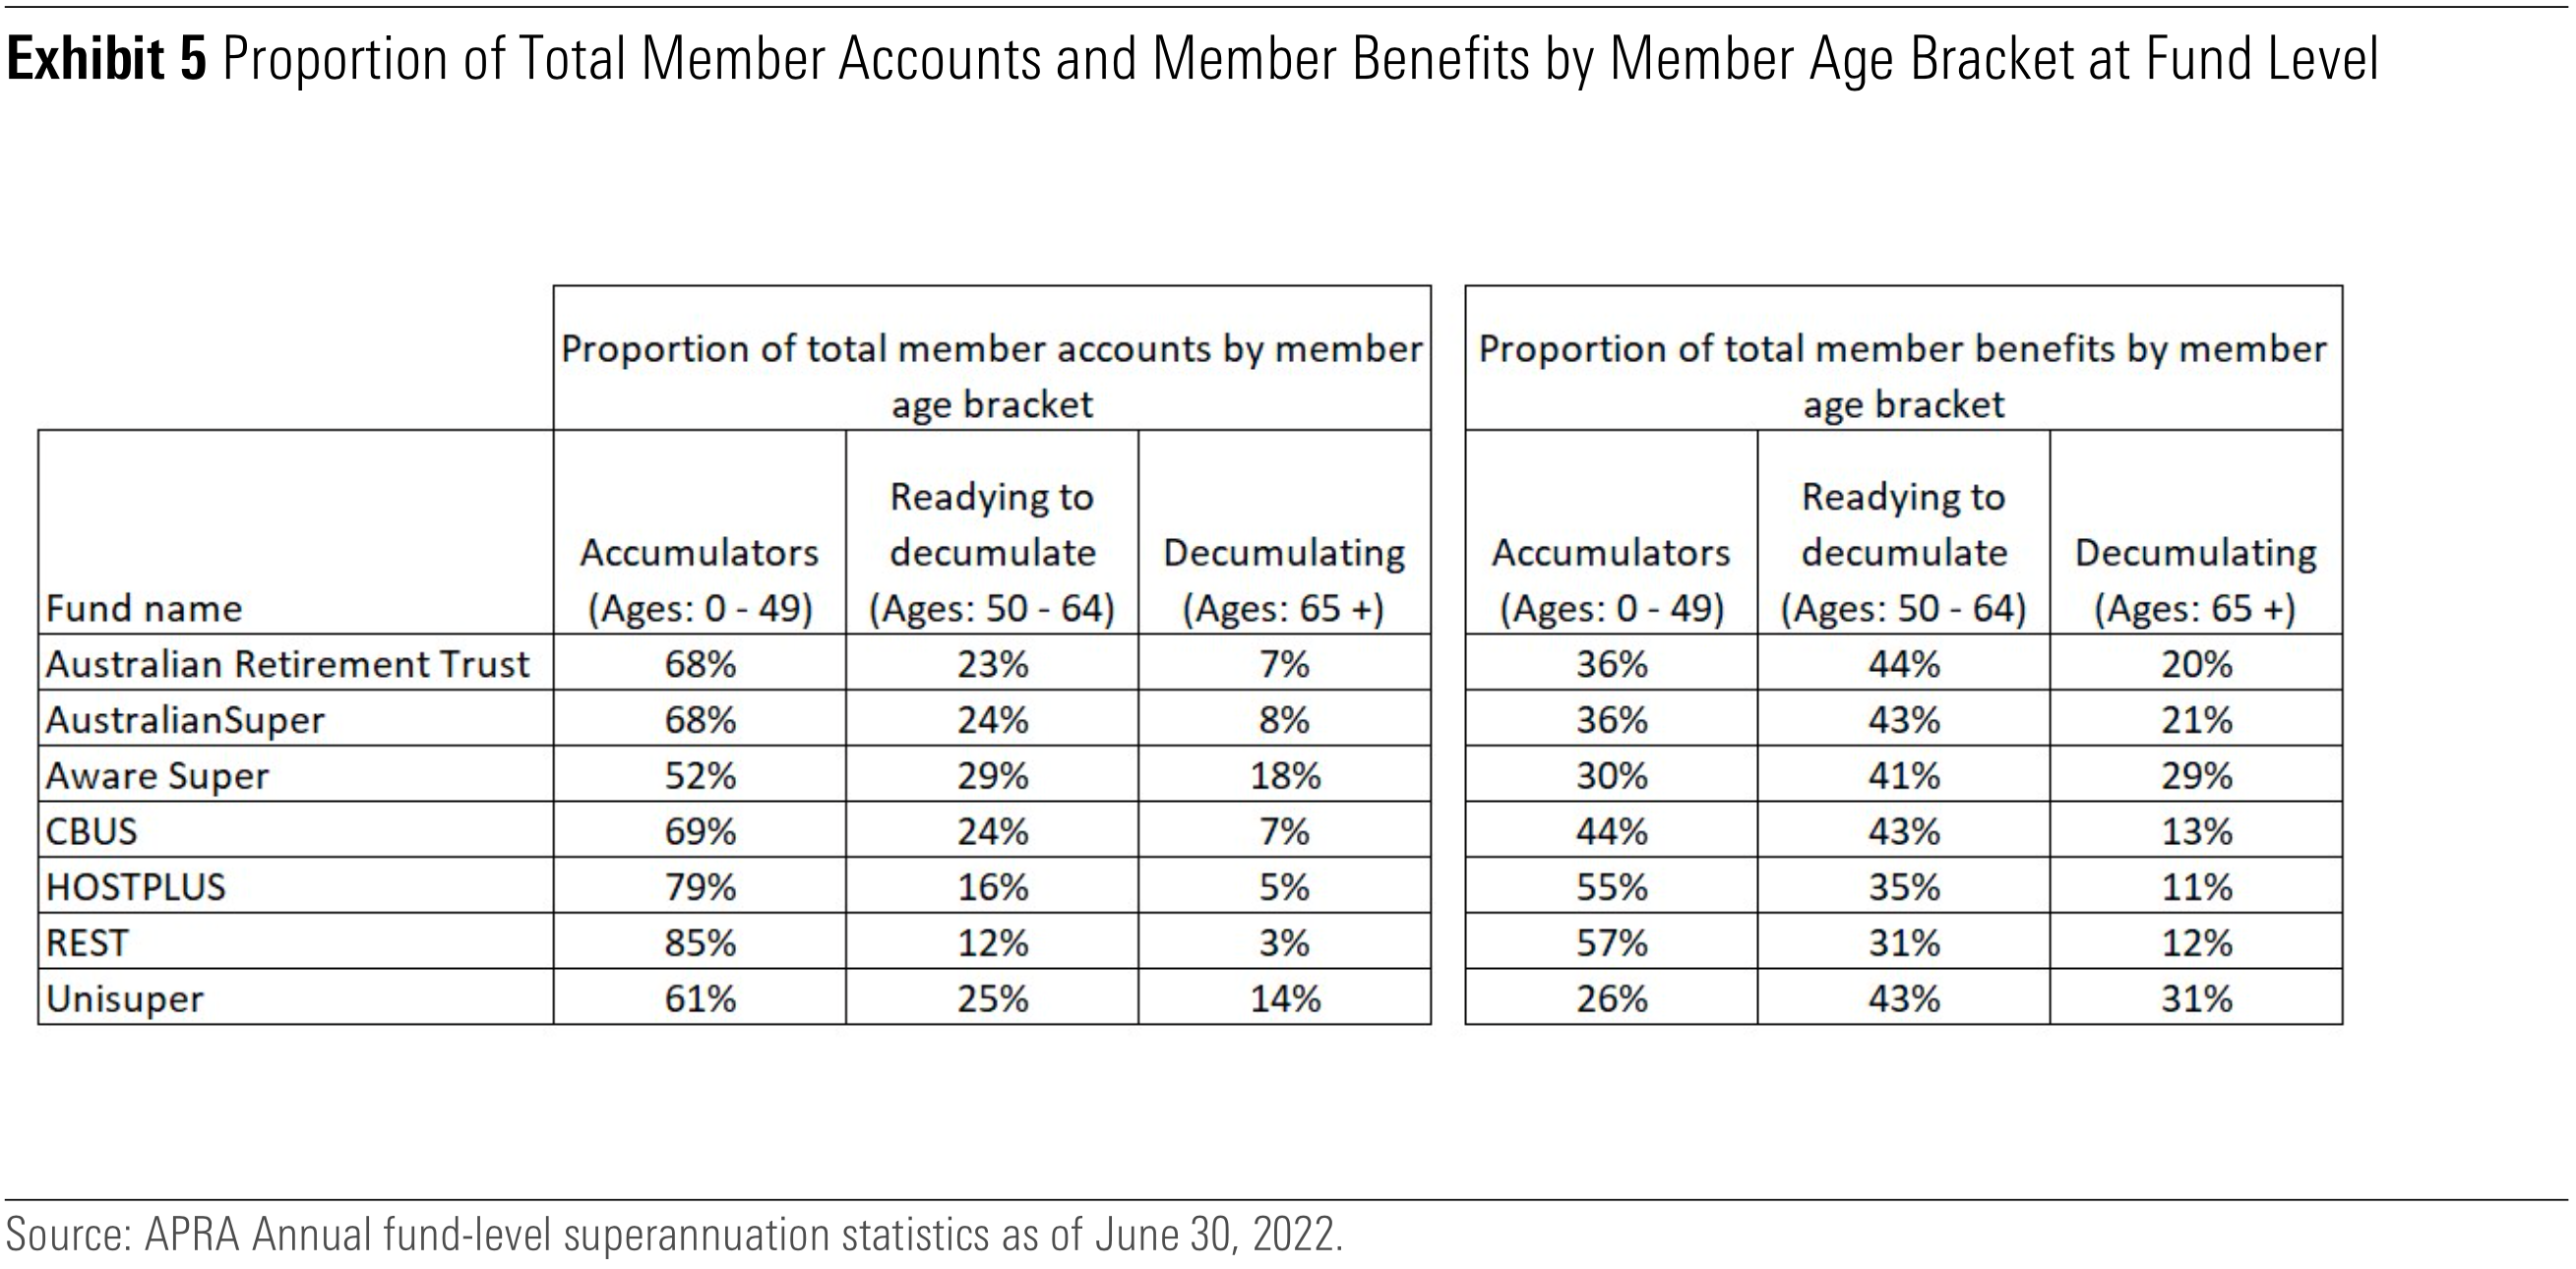
How illiquid is too illiquid?
Interestingly, under the Corporations Act, quite explicit guidance is provided for managed investment schemes. The provision states that “a scheme is liquid if liquid assets account for at least 80% of the value of the scheme property.”
In the absence of explicit guidance, the best we can hope for is that fund trustees are focused on their Liquidity Management Plans and how they stand up to different market conditions. Notably, the funds passed the test handed down in early 2020 – including the Early Release Scheme introduced, the aggressive selloff in listed markets, and the level of switching that occurred in response to volatile markets.
But it would be remiss of us to get too comfortable. A run on a fund (or a bank) can happen at any time —Silicon Valley Bank is a timely reminder. Large member outflows, a risk-off environment where listed markets selloff aggressively, and the Australian dollar in free fall would see funds’ allocations to illiquid assets likely increase as a proportion of total assets. Ongoing regulatory oversight of this issue is critical, and increased public disclosure on funds’ liquidity profiles would be welcome.
With its long-term framework, the retirement system supports the ability of superannuation funds to buy multigenerational (often illiquid) assets, which should deliver great returns for investors over time. However, we need to preserve the sustainability of such a system to ensure the illiquid component of these funds are prudently managed.
But measuring liquidity is complex and it’s important to consider all relevant factors—not just the headline illiquid or unlisted allocations. And based on the data presented, currently there isn’t cause for alarm across these five funds.
There was plenty in Tuesday’s Federal Budget that will impact retirees.
You can also read more on what the budget means for investors and ASX listed company, as well as a deep dive into whether the government’s green hydrogen plan stacks up.
Superannuation measures
The budget confirmed that tax concessions to individuals with a super balance of more than $3 million will be cut from July 1, 2025. The tax rate will go up from 15% to 30% for this group.
The budget suggests the extra tax will impact 80,000 individuals in 2025-2026, equating to 0.5% of people with a super account.
Despite a storm of criticism on the issue, SMSF advisor Meg Heffron notes the budget indicates there’s unlikely to be any change in the way that the Government calculates the tax:
“… we had hoped the Government might adjust the method used to calculate the tax (to avoid a current criticism that the proposed method effectively taxes unrealized gains), might index the $3 million threshold or might allow those who exceed it to withdraw some of their super even if they hadn’t reached the age where this would normally be allowed. It seems that won’t be happening.”
Peter Burgess from the SMSF Association had this to say on the issue:
“If the Government proceeds with the taxation of unrealised gains as proposed in their consultation paper released in late March, given many small business premises and farms are owned by SMSFs, this new tax could drive up their costs substantially at a time of unprecedented cost of living increases. We stand by our position that using a member’s total super balance to calculate earnings is neither simple nor fair. By definition, a member’s total super balance includes unrealised gains and a growing list of items that will need to be excluded to ensure ‘earnings’ for the purposes of this new tax are not overstated. This methodology discriminates against those funds who can identify and report to the ATO actual taxable earnings attributable to each member.”
Non-arm’s length income (NALI) measures
The Government provided an update on proposed amendments to the non-arm’s length income (NALI) rules.
For context, the investment income of both SMSFs and APRA regulated funds is generally taxed at the concessional rate of 15%. But any amounts regarded as NALI are taxed at 45%.
The NALI rules were originally designed to deter taxpayers channelling income, which would otherwise be taxable at company/individual rates, into concessionally taxed superannuation funds.
The rules had been unchanged until 2018 when they were broadened to include a focus on a fund’s expenses as well as income. Put simply, if a fund’s expenses were lower than they would have been in an arm’s length situation (i.e. they were non-arm’s length expenses or NALE), all or part of the fund’s income (including contributions) could be regarded as NALI and taxed at 45%.
NALI has become a hot topic for SMSFs in recent times, and a major focus area for the ATO, with the release of updated compliance guides and rulings.
It appears several years of lobbying by super/SMSF groups for significant changes to the rules have come to little, with the budget including only minor amendments to the rules, such as:
- Large APRA regulated funds will be exempted.
- SMSFs haven’t fared so well. If the general expenditure of an SMSF is lower than what would be expected in an arm length’s scenario, then instead of the fund’s income being taxed as NALI, the NALI amount will be limited to twice the general expense shortfall.
- Also, for the calculation of NALI, fund contributions will be excluded.
It appears SMSFs and their trustees and advisers are in line for increased tax bills because of the changes.
Energy relief
The budget includes $3 billion in one-off energy bill relief (split 50:50 with the states) for five million low-to-middle income households and one million small businesses. Households will receive $500 rebates.
Healthcare assistance
There’s an additional $3.5 billion for Medicare over five years to improve access to bulk billing by tripling the incentive payment to GPs.
The measure will apply to pensioners and other Commonwealth concession card holders. It’s forecast to benefit 7.9 million of these card holders.
The budget also confirmed that the Government will double the length of time (up to two months) for scripts to be issued for stable, chronic health conditions. It will apply to about 300 medicines and will save concession card holders up to $43.80 per eligible medicine each year.
Home care packages
The Government committed to an extra 9,500 home care packages at a cost of $166.8 million.
It will also give $487 million to extend the Disability Support for Older Australian Program.
Reduced minimum pension drawdown rate to end
There was no mention of continuing the current 50% reduction in minimum pension payments beyond July 1, 2023. Therefore, these will return to normal levels next financial year.
The minimum drawdown rates were cut by 50% in the 2020 budget to help retirees during the Covid-19 pandemic.
Jobseeker payment increases
The budget provides $4.9 billion for increased Jobseeker payments over the next five years. The higher Jobseeker rate of $745.20 a fortnight, previously only available to those 60 and over, will be extended to include people 55 and over who have received the payment for 9 or more consecutive months.
The measure will benefit an estimated 52,000 people who will get an increase in their base payment of $46.10 per week.
The minutes of the Reserve Bank’s (RBA) Monetary Policy Meeting of 2 May provided a greater perspective of the array of issues leading to the decision to raise the official cash rate by 25-basis points after the April pause. The increase was a surprise to most market followers and commentators, and while the minutes indicated the arguments for the two options: holding the cash rate unchanged; or increasing the cash rate by 25 basis points were “finely balanced”, I suggest the decision was not, and most likely unanimous. It sends a very definite signal more hikes are likely before the board calls an end to the most aggressive tightening cycle on record.
The factors around inflationary pressures between goods and services were opposing with inflation easing in the March quarter for several “goods-related categories, including consumer durables, groceries, and new dwelling purchases” but “input cost pressures (both labour and non-labour) and strong demand continued to contribute to strong price increases for many services.” The surge in net overseas arrivals, including students, added pressure to an already strained rental market, lifting the rent component in services inflation.
There is an increased focus on the influence of wages and productivity in discussions around the likely path of inflation over the forecast period. The danger of cost-push, driven by wage increases in addition to rising input costs, replacing demand-pull as the main cause of inflation is real. Wages growth was running around an annual rate of 3.5%–4% in the March quarter and the Wage Price Index “was expected to peak around 4% later in 2023, before easing slightly.”
Exhibit 1: Wage price index growth* (%)
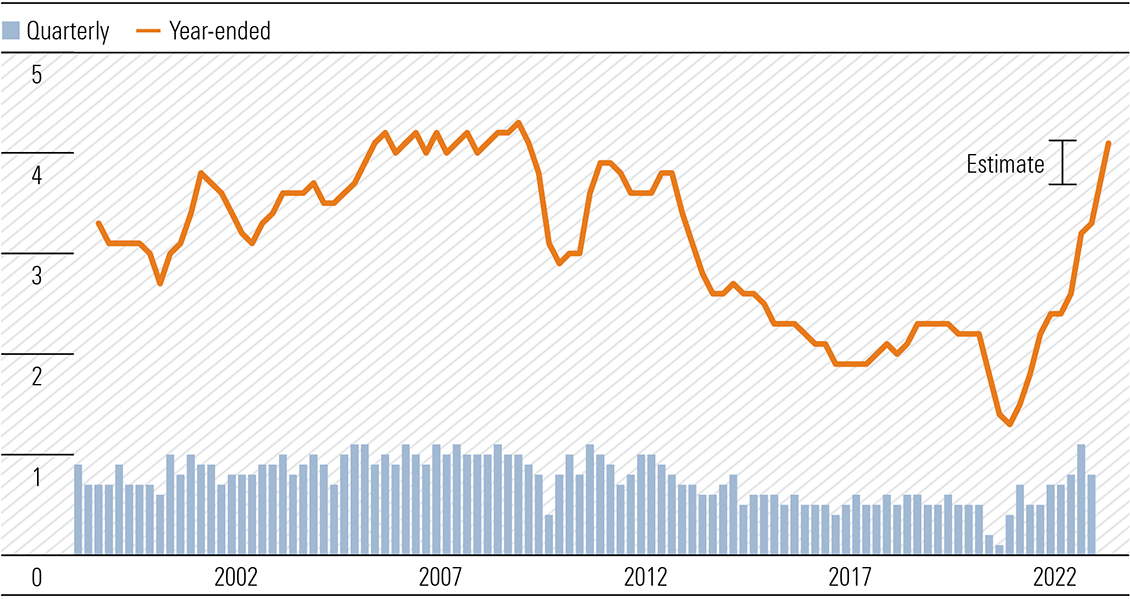
* Total pay excluding bonuses.
Source: ABS
Unit labour costs have been growing strongly, “due in part to very limited productivity growth in the preceding three years.” In fact, labour productivity per hour is currently the lowest for near three decades.
Exhibit 2: Unit labour costs growth, non-farm, year-ended
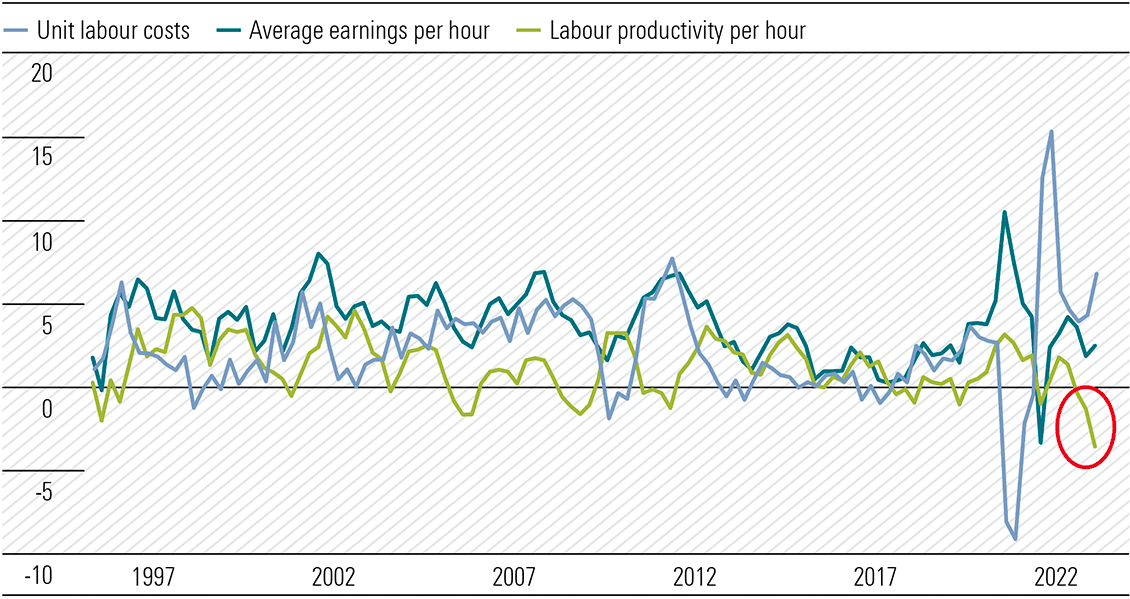
Sources: ABS, RBA
Given the retreat in goods inflation, getting wages growth under control is now critical in getting inflation back within the longer-term 2.5%–3% target range by mid-2025. The upturn in unit labour costs reflects the tight jobs market and continued weakness in productivity, as well as the need for an equitable level of real wages. Until unemployment rises and productivity meaningfully rebounds, it will be an uphill battle to reel in wages growth and win the war against inflation.
The minutes highlighted the wages/productivity issues, “Further disinflation in goods prices was expected to lead to a further decline in overall inflation, as was below-trend growth in aggregate demand. However, growth in unit labour costs, which had been strong in prior quarters, was expected to be a key driver of underlying inflation over the forecast period.” In addition, energy costs are expected to increase in coming years despite measures announced in last week’s budget. Rent inflation is also expected to increase “and add materially to inflation over the forecast period, including the recent increase in net overseas migration.” These two factors will continue to underpin services inflation and Telstra’s mobile and data plan increases adds to the upward pressure.
Wages continue to rise, but broadly as expected
The seasonally adjusted Wage Price Index (WPI) for the March quarter increased by 0.8% and by 3.7% over the year. Expectations were for a quarterly increase of 0.9% and 3.6% for the year and matched the RBA’s recently released forecast in the May Statement of Monetary Policy (SOMP). Private sector wages rose by 0.8% and 3.8% for the year from 3.6% in the December quarter. This was the highest annual growth since the June quarter of 2012. Public sector wages rose by 0.9% and by 3.0% for the year, from 2.5% in the December quarter, recording the highest annual rate since the March quarter of 2013.
While quarterly growth was higher in the public sector, the meaningfully larger size of the private sector pool meant it was the main driver of the growth. March quarter saw 60% of jobs record a higher wage rise compared to a year ago. This is the highest proportion recorded since the start of the Australian Bureau of Statistics analysis in 2003.
Given the WPI was near the RBA’s forecast, in isolation this would not trigger further tightening at the 6 June meeting. The National Minimum Wage Order decision is due early June, but unlikely before the RBA’s 6 June meeting. This will affect about 15% of the workforce on an earnings weighted basis and the increase is likely to be north of 6%. This, together with the recent interim increase of 15% for aged care workers, will impact the WPI for the September quarter, which almost assures an annual WPI reading above 4%. The RBA trimmed its forecast from 4.25% in February SOMP to 4.0% in May.
In the absence of a remarkable flow of data, the RBA will push through another rate increase in either July or August taking the official cash rate to 4.1%. Time and data will tell if that is the final move.
The Westpac Melbourne Institute Consumer Sentiment index reversed gains of April falling from 85.8 to 79.0 in May following the RBA’s surprise rate hike on 2 May and the federal budget. All five sub-indices fell. The largest falls in confidence were by those with mortgages and renters. The reading sits uncomfortably in the very pessimistic range of 76-86, which has been an unpleasant feature for the past year. To put the level in historical context, the May level approaches previous lows at the peak of the pandemic in 2020 and the height of the GFC in 2008, but above the level of the recession in the early 1990s around 65.
April’s Labour Force report was much weaker than consensus estimates and should provide the RBA with some breathing space, with the cash rate unlikely to change at the 6 June (D-Day meeting). After 53,000 jobs were added in March, more than twice consensus of 20,000, some 4,300 jobs were lost in April against market forecasts of a 25,000 rise. Full-time employment fell by 27,100 while part-time increased by 22,800. The unemployment rate increased to 3.7% and is well above consensus and a near 50-year low of 3.5% recorded in both February and March. The participation rate edged down from 66.8% to 66.7%. Monthly hours worked increased by 2.6%.
China’s growth slowing. Is this a concern?
After strict restrictions were lifted in December, optimism around the impact the re-opening of the Chinese economy would have on the global economy has waned. Initial data revealed a strong rebound given the depressed comparable levels of 2022. 1Q23 GDP rebounded at a better-than-expected year-on-year (y/y) clip of 4.5%, up strongly from growth of 2.9% in 4Q22 and consensus estimates of 4%. It was the fastest expansion since 1Q22 as consumer demand increased strongly. Retail sales grew by 5.8% y/y for the quarter and by 10.6% in March from a year earlier, and much stronger than February’s growth of 3.5%. This was the fastest monthly growth since June 2021 and softened the impact of slower than expected contributions from real estate and infrastructure.
In the month following the 1Q23 GDP release on 17 April, the Shanghai Composite index has eased 3% and the CSI 300 by 4.6% against slight increases in the S&P 500 and Nasdaq Composite benchmarks and the local S&P/ASX 200 index. China/Asian influenced commodity prices including iron ore, copper and Brent crude have also retreated by 10.5%, 7.9% and 9.3%, respectively, although there are global recessionary concerns also influencing the more economic-sensitive commodities.
While the trade surplus widened to US90.2bn in April, easily beating estimates US$71.6bn it reflected an unexpected 7.9% decline in imports as domestic demand weakened and commodity prices fell. Exports rose 8.5% to US$295.4bn from April 2022, beating forecast growth of 8%, but well below the 14.8% surge in March.
China’s central bank, The Peoples Bank of China (PBOC), injected more liquidity into the country’s banking system through its medium-term lending facility and reverse repurchases (repos) to boost growth following a spate of lacklustre economic data. The injection of 125 billion yuan (US$18bn) exceeded the May maturities of 100 billion yuan, with the added 25 billion being the 6th consecutive monthly net injection. These are small moves but are a clear indication of support to ensure the economic growth expectations for 2023 are achieved after the disappointment in 2022.
April’s economic data suite missed consensus expectations to the downside and investment in the key property sector also fell in the first four months of 2023. Industrial production increased by 5.6% y/y against expectations of a 10.9% rise. While the rebound in domestic consumption continued at a strong pace, retail sales failed to match expectations of a bullish 21.9% rise, coming in with growth of 18.4% from April 2022 levels. For the first four months of 2023, fixed asset investment increased by 4.7%, slowing from the 5.1% pace of the first three months and below expectations of 5.3%. Investment in the property market fell 6.2% in the four months to April from 5.8% in the March quarter.
Disturbingly, unemployment in the 16–24 age bracket rose to 20.4% from 19.6% in March and has gradually increased from 16.7% in December 2022. While China’s 2023 GDP growth will beat the conservative 5% target, the momentum is slowing and brings an interest rate cut by the PBOC likely, particularly as the CPI rose just 0.1% y/y in April from an 0.7% annual gain in March as demand falters. Clearly should China’s economic recovery stall it will have implications for global growth in 2023.
Observations
While Qantas (ASX:QAN) squeals about almost everything, it is interesting the airline, which has the most slots at Sydney airport is flying half full aircraft, sometimes less, into Australia’s busiest airport to protect the number of slots allocated to the airline. The use-them-or-lose-them rule was modified during the pandemic years but is reverting to the pre-pandemic conditions.
Recently, Geoff Culbert the CEO of Sydney Airport accused both Qantas and Virgin of slot blocking activity, despite fewer flights due to cancellations and the drive by management to lift load factors to capacity. Regional Express (ASX:REX) has been asking for more slots to service its expansion into the busy Sydney/Melbourne route to no avail as the dominant player exercises monopolistic behaviour. Perhaps it’s time the ACCC investigates another part of the operations of Australia’s flag carrier, not just the possible acquisition of Alliance Aviation Services.
Elsewhere, unavailed passenger revenue received in advance was $4.39bn at 30 June 2022 and $4.62bn at 31 December 2022. This includes an estimated $800m from flights booked and not available during the extended COVID restrictions. The $4.62bn at 31 December 2022 exceeds the cash and cash equivalents of $4.15bn. These funds, which were over $1.2bn, should be returned in cash refunds immediately.
Interestingly, the company raised $1.36bn in a placement at $3.65 per share in July 2020 and in 2022 outlaid $400m in a share buyback at prices between $5.02 and $6.34 per share. So far in 2023, another $380m has been spent buying back shares between $6.19 and $6.94. Are the buybacks being funded by unavailed passenger revenue? Qantas chalked up statutory losses of $2.5bn in FY21 and FY22.The group had negative shareholders’ equity of $190m at 30 June 2022 and at 31 December 2022 just $16m and obviously equal to group net assets. No dividends have been paid since FY19. Net capital expenditure was $398m in FY22 and $693m in FY21 compared with an annual average of $1.7bn in the three years FY18–FY20. The company received well over $2bn in government assistance and other subsidy schemes during the pandemic. The Capital Allocation policy requires more explanation.
James Hardie’s (ASX:JHX) FY23 result modestly beat expectations, but it was comments from management that rang a bell. “We expect our continued robust operating cash flows will ensure we maintain this strong liquidity position. Our capital allocation framework remains unchanged and matches who we are, a growth company. The number one and primary focus of our capital allocation framework is to invest in organic growth. Our capacity expansion program is guided by our expectation for sustainable long term profitable share gain.” Add this wide moat company to your wish list, and as the market pulls back over the next few months as I anticipate, initiate a position. The capital allocation policies of Qanats and James Hardie are poles apart and I know which one I prefer.
More upward pressure on Australia’s services inflation with Telstra (ASX:TLS) raising post-paid mobile and data plan charges by 7%.
I noticed in the federal budget, the Heavy Vehicle Road User charge rate will increase by 19.2% from 27.2 cents per litre in 2023–24 to 32.4 cents per litre in 2025–26, raising around $1.1bn, which will reduce the expenditure on the fuel tax credit. Up go road freight costs and everything transported by road. This brought my attention to vehicle weight. In the rush to convert the 20 million plus Australian passenger vehicle fleet from internal combustion (IC) to electric, we will be introducing millions of significantly (up to 50%) heavier vehicles to Australian roads, particularly in metropolitan areas, which will add to road maintenance costs. Presumably registration fees for electric vehicles will reflect the higher tare weight of their lighter IC equivalents or will there be even more subsidies doled out? And the production of road materials, including cement, road base and bitumen uses fossil fuels. Tyre wear will increase in line with vehicle weight. The raw materials—natural rubber, synthetic rubber, carbon black and oil. A virtuous circle it is not.
Nufarm’s (ASX:NUF) 1H23 result was a cracker justifying our long-held positive recommendation. Despite a 13% surge in the share price on the result, the stock remains in four-star territory and analyst Mark Taylor will provide an update next week. Declaration: My super fund holds Nufarm shares.