
Just what the Federal Reserve (the Fed) and financial markets did not want to read was the hotter-than-expected January CPI report from the Bureau of Labor Statistics. Financial markets are all about expectations and they went into meltdown as pent-up expectations for rate cuts evaporated and the froth blew off market tops.
At the intraday lows, the Dow was down 757 or 2%, the S&P 500 off 102, also 2%, and the Nasdaq Composite 200 down 390 or 2.5%. The Russell 2000 (smaller companies) most vulnerable to rate moves slumped 4.6%, its worst session since June 2022. All benchmarks partially recovered but still finished well into the red, with a 9–1 decline/advance on the S&P 500. Investor complacency was shaken with the COBE Volatility Index (VIX) jumping 13%. Rate sensitive regional banks were torched.
It wasn’t much better in the bond market with Treasury yields spiking, led by the 2-year and 5-year maturities up 19-basis points to 4.67% and 4.33%, respectively while the 10-year benchmark rose 14-basis points to 4.32%. The key level is around 4.35% where some resistance could be encountered. It is the level from which yields spiked to over 5% in October 2023.
Headline inflation rose 0.3% month-on-month (m/m) against 0.2% expectations, with the year-on-year (y/y) rate at 3.1% against consensus of 2.9%. The increase in the core print of 0.4% m/m was the highest since May 2023 and above 0.3% consensus, while the annual rate sits uncomfortably at 3.9% hotter than the expected 3.7% (Exhibit 1). There were increases in shelter, motor vehicle insurance, and medical care while prices of used cars and trucks and apparel eased along with energy and energy services. Medical care services increased 0.7% m/m, one of the highest increases in 30 years. The inflation glide path is not as smooth as some anticipated.
Exhibit 1: United States core inflation rate (%)
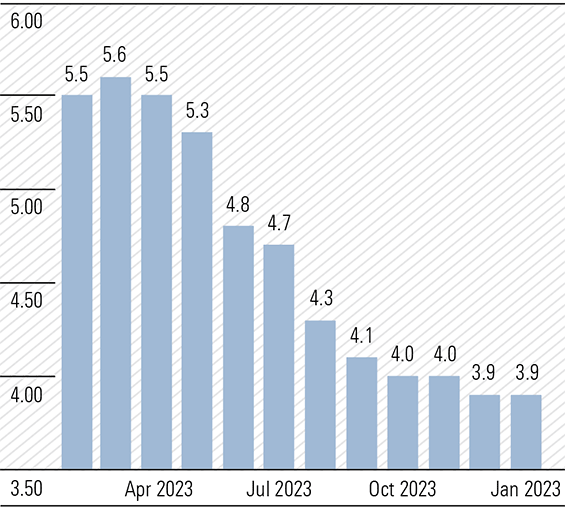
Source: www.tradingeconomics.com, U.S. Bureau of Labor Statistics
The elevated CPI report comes hard on the heels of an above expectations 0.6% m/m increase in average hourly earnings in January which pushed the annual rate to 4.5%. Recall, the January jobs report saw non-farm payrolls jump 353,000 against expectations of 185,000.
The core print is not a good number and worse the super core—ex energy services and rentals—surged 0.85%, the biggest jump since April 2022 with the y/y reading reverting to an eight-month high at 4.4% from 3.9% in December.
The CPI report finally puts a nail in the coffin for a March cut and places in jeopardy a cut in May. The likelihood of a May cut is 35% from 52% prior to the CPI release. It was at certainty odds in January of 100%. (Exhibit 2). As mentioned in previous Overviews certainties sometimes get beaten.
Exhibit 2: Changing expectations for the Fed
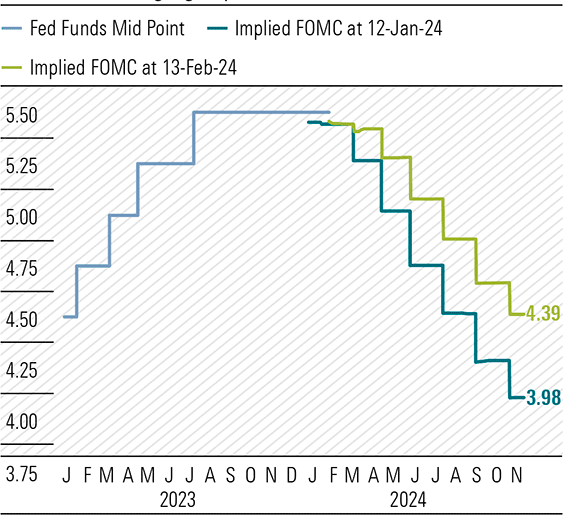
Source: National Australia Bank, Federal Reserve, Account in-house, Bloomberg, Macrobond
Recent Fed speak has been pushing back against cutting too early and this inflation report will only steel the more hawkish FOMC members.
Interestingly, as the S&P 500 hit a new peak last Friday, less than 10% of the stocks in the index hit 52-week highs. When the market has a correction, there could be some excellent opportunities on offer, both in international markets and at home.
Local surveys results send mixed messages
The latest NAB Business Survey and the Westpac-Melbourne Institute Consumer Sentiment Index provided some relief from the depressing tone of late 2023, although most key readings remain well below long-term averages.
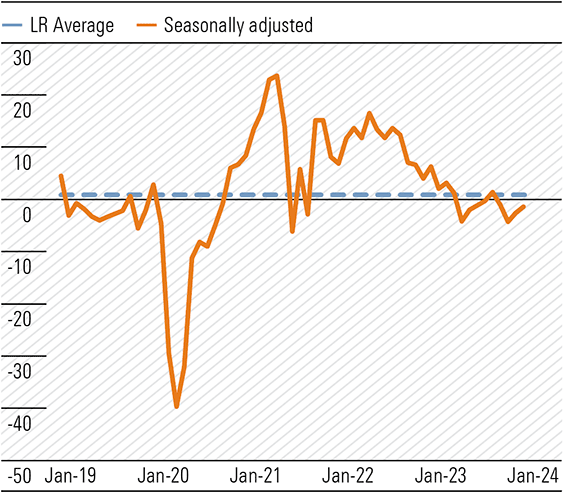
NAB’s survey for January revealed “confidence remained low, and conditions eased to be just below their long-run average, ending a two-year run of above average conditions while forward orders remain soft.” While the 24–31 January survey showed business confidence edging up 1 point to +1 any excitement was muted with the index well below long-term average (Exhibit 3). Across the states, confidence remained negative. There were improvements in manufacturing and construction partially offset by declines in retail and wholesale.
Exhibit 3: Business confidence, SA (net balance)
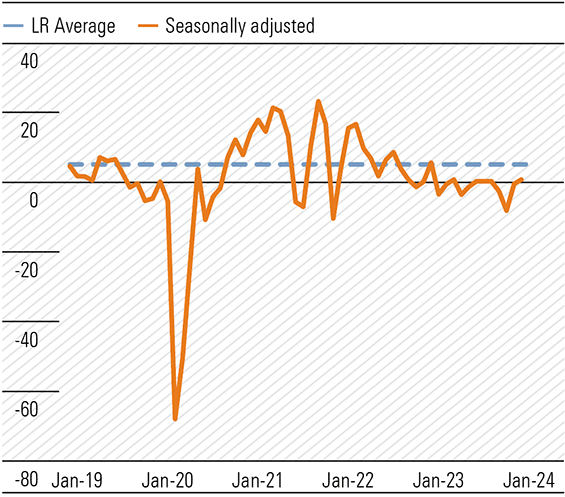
Source: NAB Monthly Business Survey Jan-24
The business conditions index eased 2 points to +6, just below the long-term average of +7, ending a two-year run above the average (Exhibit 4). Trading conditions, profitability and employment all fell. Forward orders edged higher to -1, still below the long-run average, (Exhibit 5) with retail a depressed -19. Capacity utilisation moved higher, remaining elevated and above long-term average. Rates of cost growth for both labour and other inputs increased (Exhibit 6). Inflation is still kicking.
Exhibit 4: Business conditions, SA (net balance)
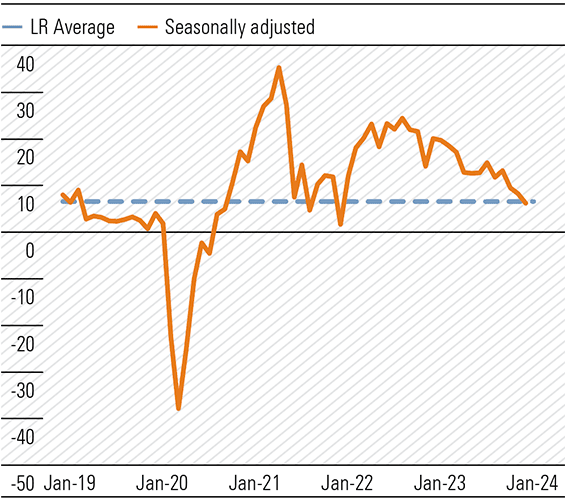
Source: NAB Monthly Business Survey Jan-24
Exhibit 5: Forward orders, SA (net balance)
Source: NAB Monthly Business Survey Jan-24
Exhibit 6: Cost growth, SA (% qtly eq.)
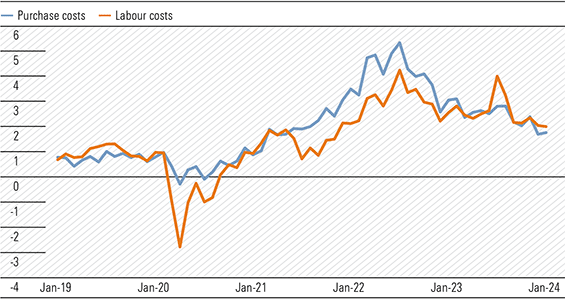
Source: NAB Monthly Business Survey Jan-24
Consumer sentiment bounced off January lows in Westpac’s survey with the index up 6.2% to 86, the largest monthly gain since April 2023 when the Reserve Bank paused hiking (Exhibit 7). The index is at its highest level since June 2022. The drivers were the benign December quarter CPI and the increasing possibility of interest rate cuts later in the year. Despite the rebound, consumer sentiment remains well in the pessimistic zone.
Exhibit 7: Consumer Sentiment Index
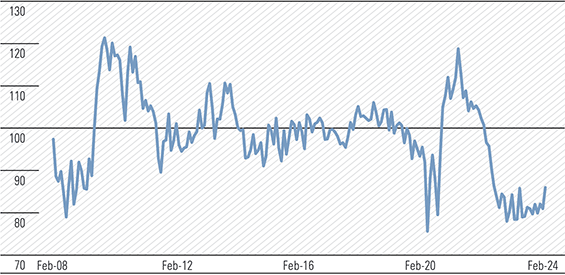
Source: Westpac Economics, Melbourne Institute
Influential in the sentiment rebound were sub-indexes ‘time to buy a major household item’ and the forward looking ‘economic conditions next 12 months’. Rate cut expectations would also have filtered through, although confidence was lower after the RBA’s 6 February meeting than prior. This suggests the less dovish commentary versus expectations were a factor given the survey was conducted between 5 and 9 February. Changes to stage three tax cuts would have helped in the improvement in one-year forward expectations.
The rally appears tentative and despite the change in the ‘time to buy a major household item’, I doubt Gerry Harvey has increased inventory in anticipation. Incidentally, the sub-index bounced 11.3% from 78 to 86.8 but still significantly below the historical average of 124.7. Positive yes, and among the consumer gloom we’ll take it, however, don’t get too excited just yet.
Current conditions reflect the intensity of pressure on household finances. Sub-indexes ‘family finances versus a year ago’ and ‘family finances next 12 months’ increased 4.9% and 2.4%, respectively to 66.1 and 95.3 against historical averages of 88.4 and 106.8, respectively. The unemployment expectations sub-index drifted 2.9% from 130.7 to 126.9 and just below the long-term average of 129. The labour market remains at the tight zone, with an easing bias.
We look forward to the March survey to see whether the improvement is sustainable. Consumer demand is likely to remain weak near term and RBA commentary will be closely monitored, but cuts are likely at least six months away.
Will the consumer psyche change quickly?
The inflationary environment of the past two years has allowed companies to lift prices sometimes by a greater degree than was necessary. While some will have been behind the curve, others got ahead assuming costs would continue to increase. Consumers were conditioned to rising prices and some businesses took advantage of the situation.
This action probably protected margins to some extent. An example comes from Boral’s half yearly report—The strong result reflects margin expansion as price increases across all product lines more than countered cost inflation. Now, with inflation subsiding and the consumer in a much more frugal state of mind, the shoe is on the other foot.
Low-middle income households, those that move the economic needle, have not experienced this intense pressure on budgets for many a long year and frugality is now ingrained in their psyche. JB HiFi’s CEO reported more customer haggling and going forward this is likely to become the norm, rather than the exception.
While consumer sentiment is likely to improve as interest rates and taxes are trimmed and prices stop rising at past rates, the change in spending behaviour is unlikely to V-reverse. As with monetary policy, there is likely to be a lag, possibly of a measurable duration.
Consequently, the rise in consumer frugality may not be good news for corporate profit margins given the operating cost base or cost-of-doing-business is now much higher and unlikely to decline meaningfully. While management will focus on reducing costs, wage increases of the past two years are embedded and wage-related costs will only fall as hours worked decline and/or unemployment rises. This will then have knock-on implications for demand.
Supermarkets are already under investigation for possible price gouging and pricing strategies are under the microscope. Coles has called on some suppliers to reduce prices by up to 14%. As inflationary pressures subside, supermarket operators are planning a discounting blitz to possibly appease the government and regulators. Probably a rearguard action with consequences.
Banks, insurance, utilities, and telecommunications sectors could be added to the regulator’s hit list. Recall, insurance premiums increased by 16.2% in the year ended December 2023, the largest annual rise since 2001. My strong recommendation shop around (see Observations).
Passive investing bleeding managed funds
Exchange-traded funds (ETFs) are dominated by passive funds, those mimicking stated benchmarks, and do not create alpha. There are active ETFs, where the manager overlays strategies within the portfolio to generate alpha, to outperform the stated benchmark, but these are in the minority.
From the vanilla product offering in the 1990s, where all ETFs were tied to a specific index or benchmark, the product suite now resembles a giant size gelato bar where every flavour is on offer. And new ones are added on a whim or sniff of an opportunity to attract any funds looking to chase the next potential winner or fad. Develop, seed, launch and hope funds flow in. If successful, another flavour is added to the gelato bar offerings, now probably in the hundreds.
Momentum and growth-facing ETFs are currently dominating, heightened by what seems an insatiable appetite for anything related to artificial intelligence (AI), led by the mega techs Microsoft, Meta, and the barnstorming Nvidia. Value has been jettisoned and individual stock prices are driven by fund inflows into general or specific ETFs. Strangely, there is an element of Ponzi schemes in ETF behaviour as stock and fund prices are dependent on future fund flows. What would support prices if fund inflows stopped or declined? Would they then be influenced by active managers and investors?
Underperforming active funds are hemorrhaging with some bigger industry funds taking management back in-house and others moving mandates to the passive sector. In recent weeks the question has been asked about Commonwealth Bank’s surge to $120 and an accompanying FY24 P/E multiple of 20. The probable reason is active managers have been underweight Australian banks, including Commonwealth. The switch to passive sees funds flowing into the second largest company by market capitalisation and international funds buying Australia would target leaders.
Generally, ETFs do not heed the plea of The Little Doer Carpet Company—tell em the price, son!
Reporting Season—Winners and Losers
The reporting is on in earnest with individual company reports and guidance being either rewarded or sent to Coventry. Exhibit 8 are the best and worst in our coverage so far.
Exhibit 8: Reporting season winners and losers
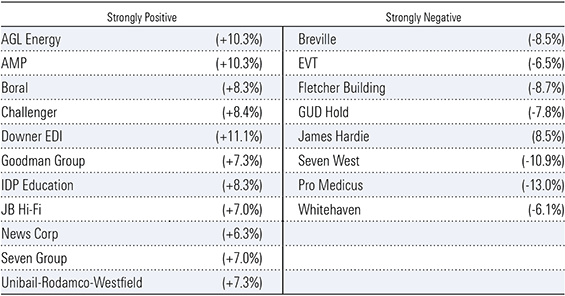
Source: Morningstar
My Initial Market Reaction (IMR) rating monitors the share price reaction to results in the 24 hours after the announcement. Strongly Positive reflects a price rise of over 5%; Strongly Negative a fall of over 5%.
Observations
Recently I received a motor vehicle renewal notice which increased 15.3% to $1,148.78 from the leading domestic insurer who I have been with for 40 years or more and with very long no claim record. I replaced the exact policy with an equally large domestic insurer for $407.74. Do yourself a favour and haggle on every renewal notice.
If your agreed value or market value policy is below $8,000 net of excess, ask yourself, Do I really need comprehensive insurance? Perhaps look at just Third Party cover—Stay alert, drive safely, and save money.
Retirement
After 57 years in the investment industry, I have decided to retire, effective 1 March. My last Overview will be in Your Money Weekly 8 on 29 February.