The headline of Your Money Weekly Issue 1 of 2023 was “Zero to Hero; Can Powell orchestrate a soft landing or is it Mission Impossible?” The year was dominated by inflation, interest rates (rising) and invasion.
A year later we are still awaiting the outcome.
Before exploring the possibilities ahead, a look over the shoulder can be educational.
Against all odds and most forecasts, 2023 was a record-breaking year for financial markets. Santa arrived early and provided a strong boost in November to a waning performance up until October. The excitement around Artificial Intelligence (AI) provided a boost to the now hackneyed Magnificent Seven and their overwhelming influence on the Nasdaq 100 and Composite (200) and the S&P 500 should not be underestimated. In fact, a new index was spawned, the S&P 493.
A quick snapshot of the 10 months to October 2023 reveals a lacklustre performance, excluding Nasdaq and the S&P 500, and did not provide any inkling of the impending and welcome fireworks in store in November and December (Exhibit 1).
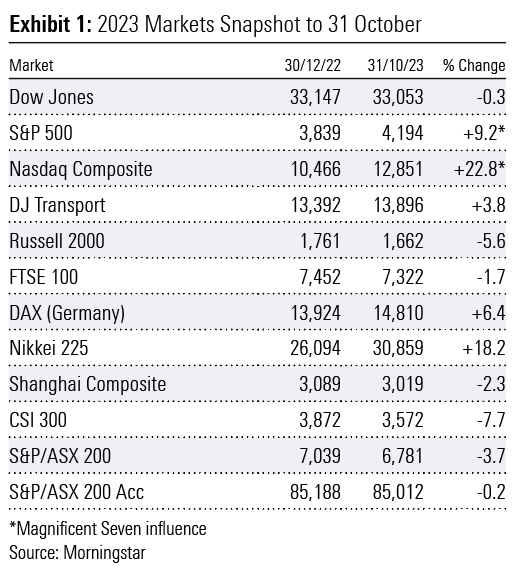
The performance of the Nikkei 225 was driven by a continuation to accommodative monetary policy settings and quantitative easing bond purchases by the Bank of Japan. In contrast, the central banks of other developed economies aggressively raised official cash rates to decade highs to bring inflation to heel.
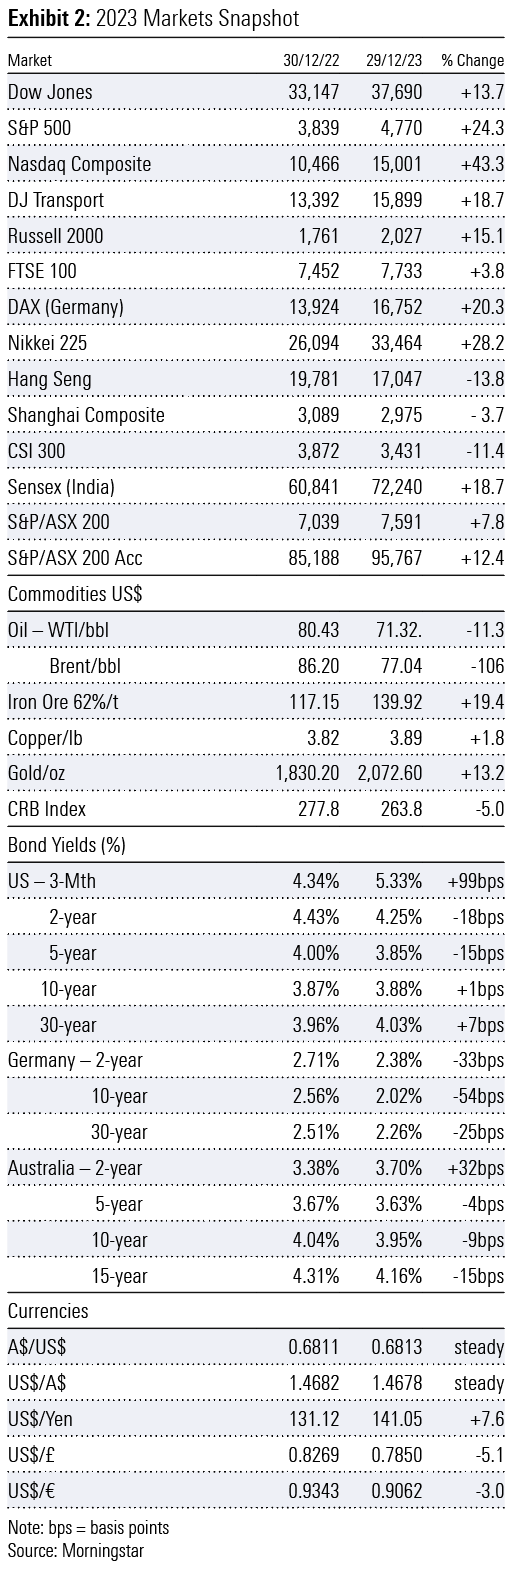
November marked the early arrival of Santa and a meaningful change in sentiment. (Exhibit 2)
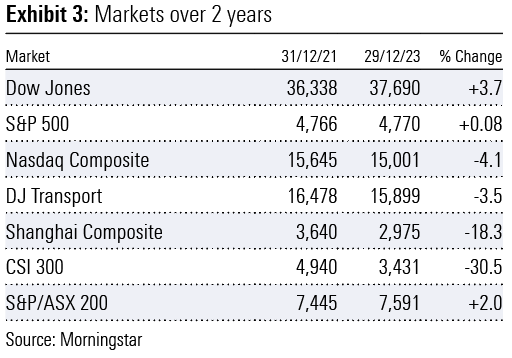
A brief snapshot of the past two years may surprise. China smashed; the rest having gone nowhere. (Exhibit 3)
By the close of 2023, records were broken. In December, all-time closing highs were made by the:
- Dow Jones Industrial Average seven times.
- Nasdaq 100 (NDX) multiple times
- US Semi-Conductor index (SOX)
- US Homebuilder ETF (XHB)
- US Industrial ETF (XLI)
- US Technology ETF (ELK)
- Magnificent Seven Index (MLUSMAG7) multiple times
- DAX Index (Germany) three times
- Sensex Index (India) four times
- S&P/ASX 20
- S&P/ASX 50 three times
- S&P/ASX 100 twice
- S&P/ASX 200 Accumulation (Australia) five times
There are likely many more.
The S&P 500 missed setting a new peak by just 12 points. Australia’s S&P/ASX 200 missed by 15 points, spearheaded to the edge of new heights by the index heavyweights Commonwealth Bank and the iron ore triumvirate BHP (adjusted for the sale of petroleum interests), Rio Tinto and Fortescue Metals Group breaking into record territory. A 21% rebound for CSL, the third largest weighted company in the index, joined the party. Collectively, these five stocks ensured the more concentrated S&P/ASX 20, 50 and 100 indices broke into new ground.
Note the meaningful (negative) underperformance of the Chinese markets. With the reopening of the Chinese economy in December 2022, expectations were high for a robust and sustainable recovery in 2023. Despite many attempts to stimulate the domestic economy, the recovery was overwhelmed by the collapse of the real estate sector which has been the driver of economic activity and wealth creation for decades.
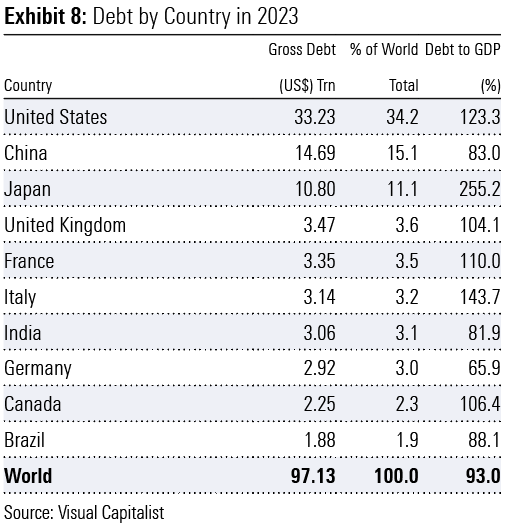
Other not so welcoming records were also broken, including government debt across most developed countries along with associated debt servicing commitments for decades.
2024 – Hope springs eternal
A sample of the year’s opening headlines:
“Bull market set to roar in 2024.”
“The market’s bulls are running.”
So, we start the new year full of anticipation, expectation, and hope. Both equities and bond markets have already borrowed heavily from the Bank of Expectation and the jury is still out as to whether expectations can be met, let alone be exceeded.
Throughout 2024, uncertainty is almost certain to be a constant companion and with it associated financial market volatility.
Issues facing investors include but are not limited to:
- slowing economic growth and possible recession
- tighter monetary conditions despite likely interest rate cuts as excess liquidity is drained from the financial system
- Treasury yields do not return to the average levels of the past 15 years, which was both abnormal and unprecedented
- China’s economy continues to struggle impacting export-orientated economies in the eurozone, particularly Germany
- Lofty expectations of the Magnificent Seven disappoint
- Geopolitical tensions to remain elevated with two conflicts currently raging. The Taiwanese election to be closely watched. The November US presidential election is likely to put democracy under the microscope.
All eyes on the Fed
US Economy flight 2024 is on approach under the control of Captain Jerome Powell. He will be hoping the runway is clear (Japan Airlines) and all cabin door plugs (Alaskan Airlines) are secure as he attempts a widely anticipated trouble-free soft landing.
Remember, markets were pricing in six cuts, presumably of 25-basis points each, to the federal funds rate by the US Federal Reserve (the Fed) in 2024. This suggests the rate range will be slashed from 5.25%-5.50% (mid-point) 5.375% to 3.75%-4.00% (mid-point) 3.875%. I think this is highly unlikely and will only arise should the anticipated soft landing be much harder.
Market enthusiasm gathered momentum in November with a firm conviction the rate hiking cycle was over. Momentum was further supported following a dovish interpretation of commentary from chairman Jerome Powell and Fed speak from various members of the Federal Open Market Committee (FOMC) after the 13 December meeting.
The presumed Powell Pivot at the press conference following the meeting and the release of the economic projections of Federal Reserve Board members and Federal Reserve Bank presidents (dot plot), clearly indicated several cuts were on the cards in 2024. The 2024-year end median projection for the federal funds rate was from the current 5.4% to 4.6% and to 5.1% in the September projections. That is three cuts, not six.
Subsequent release of the minutes of the December meeting on 4 January ruffled the feathers of the doves. FOMC members concluded rate cuts were likely in 2024 with no inkling of timing. “In discussing the policy outlook, participants viewed the policy rate as likely at or near its peak for this tightening cycle, though they noted that the actual policy path will depend on how the economy evolves.” There remains an “unusually elevated degree of uncertainty” surrounding the policy path and “Participants generally stressed the importance of maintaining a careful and data-dependent approach to making monetary policy decisions and reaffirmed that it would be appropriate for policy to remain at a restrictive stance for some time until inflation was clearly moving down sustainably toward the Committee’s objective.”
Chairman Jerome Powell is no Alan Greenspan
Further out, the federal funds rate is projected to reach 2.9% in 2026 and longer run 2.5%. This contrasts to the average effective federal funds rate of 4.6% between 1954 and 2023, incorporating the 10 years between 2009-2016 and 2020-2022 when the rate was zero-bound post-GFC and in the pandemic years. Based on FOMC’s projection for core PCE inflation in 2024, 2025, and 2026 of 2.4%, 2.2%, and 2.0% respectively, the real federal funds rate forecasts are 2.2%, 1.4%, and 0.9%.
I am quite bemused the market has focused on the rate cuts and basically swept aside other important projections including real GDP growth, the unemployment rate, and core PCE inflation (Exhibit 4). I had assumed there was some relationship between all four.
Exhibit 4: Economic projections of Federal Reserve Board members and Federal Reserve Bank presidents, under their individual assumptions of projected appropriate monetary policy, December 2023 (%)
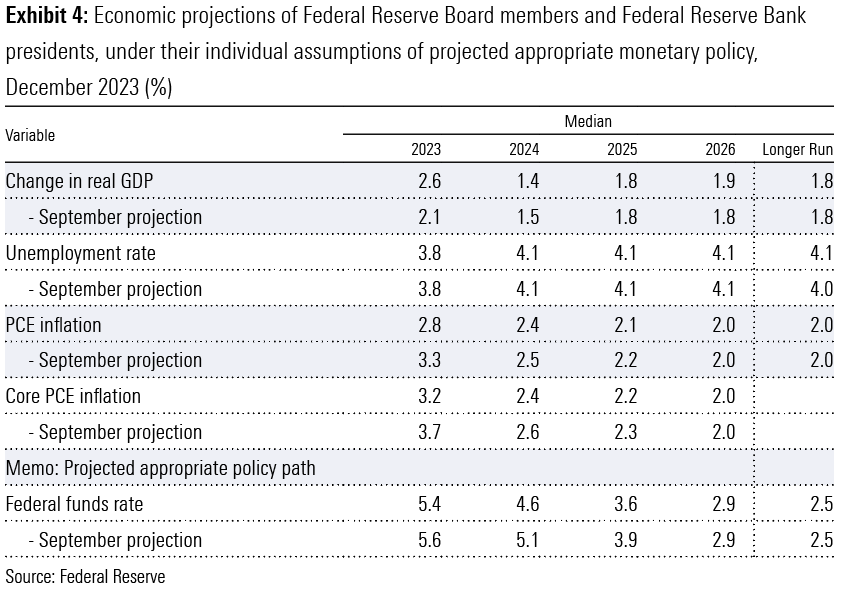
Despite projected rate cuts, real GDP growth is expected to slow from forecast 2.6% in 2023 to 1.4% in 2024, rising to 1.8% in 2025 and along with a further four 25-basis point cuts edging to 1.9% in 2026, with the longer run growth projection at 1.8%. Bank of America, one of the more optimistic forecasters predicts four rate cuts in 2024 and projects real GDP growth of 1.2%, near consensus of 1.3%, before picking up to 1.7% in 2025. In this scenario, what are the expectations around corporate earnings growth with real GDP growth sub-2%?
In the context of projected real GDP growth, FOMC members suggest longer-run real GDP growth of 1.8% against the average of 3.15% between 1948 and 2023. Lower-for-longer?
Valuations stretched?
What I do know is there is a relationship between the valuation of a company and the sustainability of operating cash flow, free cash flow, earnings per share, and shareholder returns, whichever method management chooses to deliver. The foundations of equity markets are based on the sustainability of the above corporate benchmarks. The speculative stocks and ‘fly-by nighters’ come and go and rarely have a lasting influence.
Peter Lynch of “One Up on Wall Street” fame developed the Price to Earnings Growth (PEG) ratio which added earnings growth to the more simplified Price Earnings Multiple (PEM) valuation tool. The PEG is calculated by dividing the current year PEM by the estimated earnings per share (EPS) growth for the next five years – a current PEM of
20 and estimated EPS growth of 10% results in a PEG ratio of 2. Peter Lynch classified companies with a PEG ratio below 1 as undervalued, at 2 meaningfully overvalued.
In my early days as an analyst in the late 1960s and early 1970s at the Bank of New South Wales and Hattersley & Maxwell, we always published the historical EPS growth for 5 and 10 years for well-established profitable companies we covered. These were in the days before discounted cash flow (DCF) models became the norm, although mining analysts did adopt DCF models before the industrial analysts joined in. We would compare the past performance with our future forecasts. Was the company’s EPS growth accelerating, declining or stable? The answer would determine the appropriate PEM (or range) allocated given the projected future growth profile.
According to FactSet, the bottom-up 2024 EPS estimate for the S&P 500 is US$246.30. This reflects the aggregation of the median EPS estimates for 2024 for all 500 companies. The S&P 500 closed 2023 at 4,770 suggesting a PEM of 19.4. While both average and aggregates can be misleading, what are the chances of the S&P 500 companies achieving average annual compound growth of almost 10% – a PEG ratio of 2 – over the next five years, particularly given the economic projections of FOMC members, with real GDP growth of just 1.8% longer run?
The 4Q23 reporting season is about to start. Analysts have already played their quarterly game – trimming estimates and when announcements are released the market is upbeat as results beat reduced expectations. Bloomberg reports 4Q23 EPS expectations for the S&P 500 are US$54.50, down 2.8% on 4Q22 and well below the US$57.70 forecast in September. Forecast 2023 EPS is US$220.90 from US$222.30 in 2022. Recall, year-on-year EPS for the S&P 500 fell in the first two quarters of 2023 from 2022.
In macro terms, to put valuations in perspective, the individual market capitalisations of both Apple and Microsoft exceed the total market capitalisation of the Canadian stock market.
The capitalisation of the Magnificent Seven approximately equals the combined capitalisations of the Japanese, UK and Canadian stock markets.
ETF influence overwhelming
The influence of exchange-traded funds (ETFs) on the surging US equities and bond markets in November and December should not be underestimated. Morningstar research revealed in November “investors piled a whopping $110 bn of new money into ETFs.” Equity ETFs attracted US$77bn (70%) and fixed interest US$30.7bn (28%).
“After a year of touch-and-go flows, ETFs are suddenly poised to blow past the US$500 billion annual inflow threshold that looked well out of reach just a month ago.” In the 11 months to November, inflows totalled US$477 billion, with equity’s share an estimated US$280bn (59%) and fixed interest US$184bn (39%).
In the week ended 15 December, an unprecedented amount of cash flowed into the world’s largest and oldest ETF, as stocks rallied to near-record levels after the Fed indicated rate cuts in 2024. State Street’s US$478bn SPDR S&P 500 ETF (ticker SPY) attracted US$20.8bn on Friday 15 December alone. It was the biggest one-day inflow since the fund’s inception in 1993 and according to Bloomberg Intelligence, the largest one-day inflow for any ETF. For the week the inflow was US$24bn, also a record. (Exhibit 5)
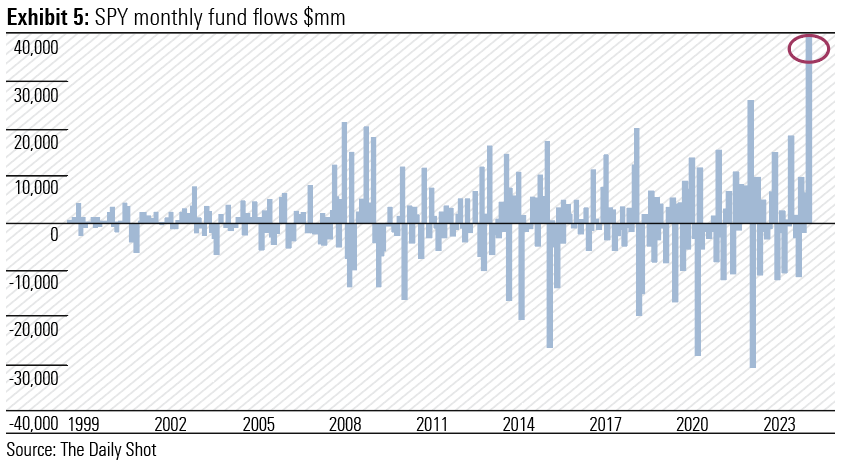
Matthew Bartolini, Managing Director of State Street Global Advisors and Head of SPDR Americas Research said “the flow we saw on Friday was 100% organic from clients, and investors and traders. It also reflects the Santa Claus rally that we have seen in the last few days – so momentum-trading going into the SPY as well.”
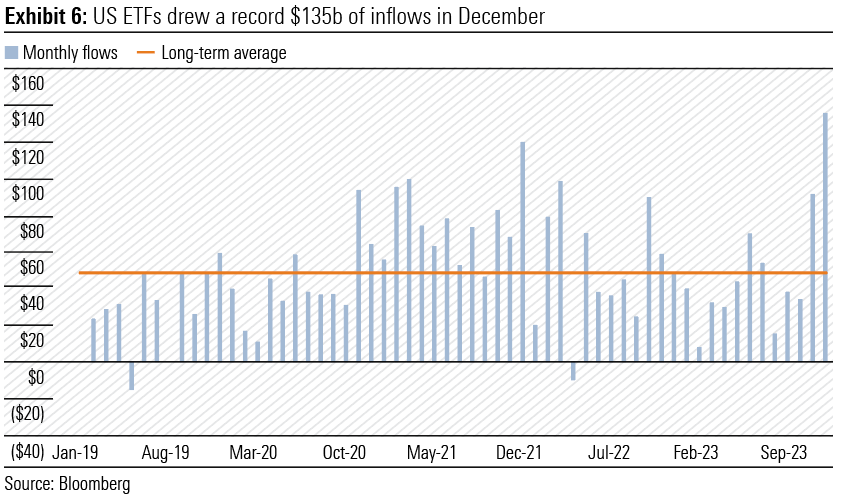
The totals for 2023 are now in. US ETFs attracted a record US$135bn in December (Exhibit 6), closing out 2023 with US$598bn of inflows. Equity ETF inflows were a record US$110bn, with a new monthly peak for US equity ETFs, driven by a record US$15bn into US small caps. The December quarter total was US$263bn. The 2023 total inflows were well short of the record US$903bn in 2021, which included US$670bn in equity ETFs.
Remember most ETF transactions are value agnostic.
The average 2024 closing target for the S&P 500 from 20 leading US forecasters is 4,832, with a range between 4,200 (JP Morgan) to 5,200 (Fundstrat Global Advisors and Oppenheimer). From the 2023 close of 4,770, the average target for 2024 is 1.3% higher.
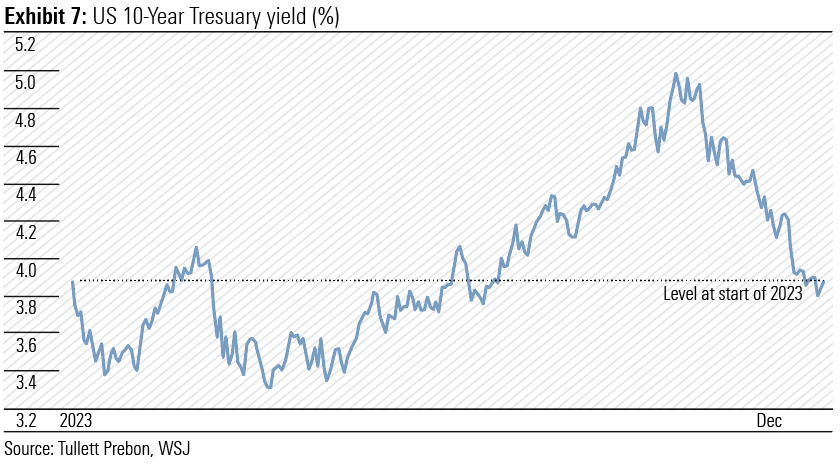
The sharp rally in the US bond market, which saw yields across the 5-year to 30-year section of the yield curve tumble by over 100-basis points in eight weeks from late October, was also assisted by ETF purchases and meaningful short covering. (Exhibit 7) In November, net flows into fixed interest ETFs amounted to some US$31bn . A further US$24bn in December pushed the 2023 total to US$230bn, the second highest on record.
Bond bulls are cheering any sliver of negative news or economic data given inflationary pressures continue to ease although the central bank targets within the 2%-3% range still require vigilance and attention. Strangely, they may prefer a hard landing, although that may trigger added fiscal stimulus and further increase bond issuance. Confusion and uncertainty reign.
Following a better-than-expected headline number in the December jobs report, which saw both bonds and stocks initially sold off initially, the conclusion was “Scratch the surface and you’ll get a recession itch.” The 10-year Treasury yield has moved back over 4.00% to 4.05% (touched 4.07% intraday) from 3.79% on 27 December.
I just don’t see investors being attracted to bonds with a real yield well below 2% in the future. They have put up with negative yields for too long and a return to long-term historical averages is now likely. Recall, the Fed’s quantitative easing bond purchases of US$3.5 trillion between 2020 and 2022 were made at real yields between -3% and -6%. That is the prerogative of central banks, not investors.
Government debt and its servicing
Government debt of developed world countries smashed records in 2023, with the US leading the way. (Exhibit 8)
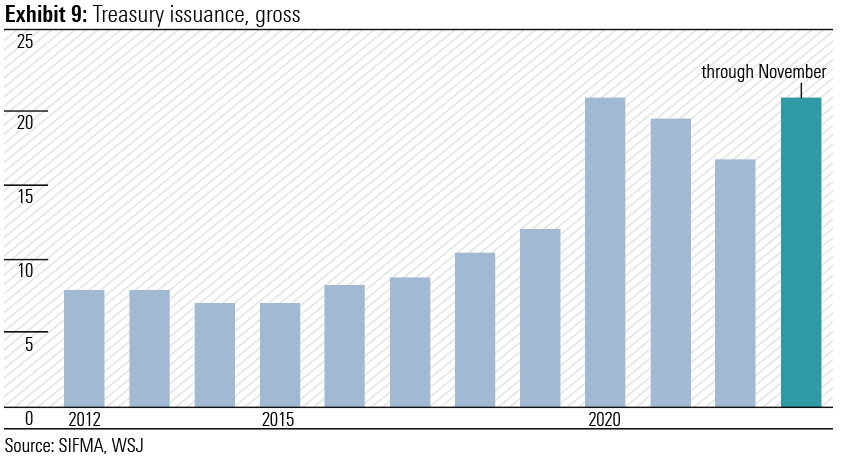
The market’s focus on Jerome Powell and the Fed is overwhelming while Janet Yellen and the US Treasury’s record bond issuance and liberal fiscal policies pass under the radar. With a presidential election in November, reining in of government spending is unlikely in 2024. (Exhibit 9)
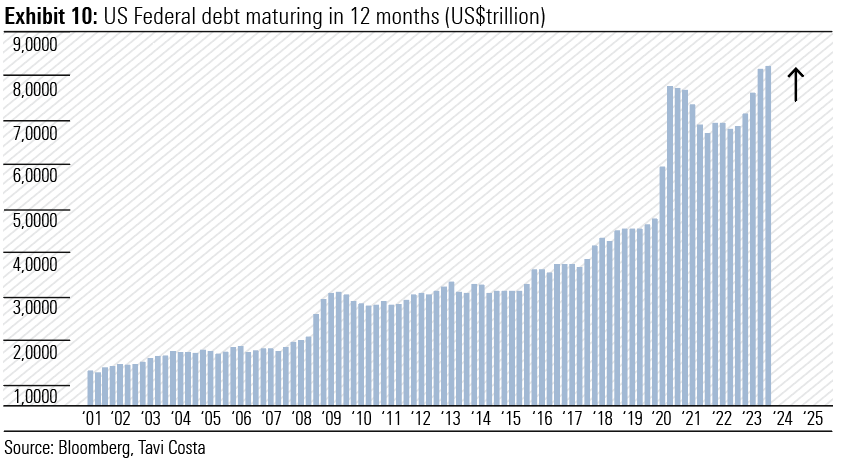
Apollo Global Management’s chief economist Torsten Slok succinctly sums up the situation. “There’s a tug of war between the Fed at one end of the rope and the supply of Treasurys at the other end. The market needs to take the bond supply more seriously, and in my view, it will be paying more attention to Treasury auctions than ever before.” (Exhibit 10)
While the rise in term premia, which sent the 10-year US Treasury yield to over 5.0% in late October, was seen as assisting the Fed in keeping financial conditions tight without a further lift in the federal funds rate, the subsequent slide to 3.8% is having the opposite effect. Dallas Fed president Lorie Logan was one of the first Fed policymakers to suggest higher bond yields were doing some of the Fed’s work.
With commercial banks tightening credit policies and credit card and auto loan delinquencies on the rise, Logan has indicated it could be time for the Fed to ease the pace of shrinking its balance sheet. Recall, the Fed is already well behind the planned monthly rate of quantitative tightening of US$95bn effective 1 September 2022.
Australia – Can’t wait for September
Pleasingly, November’s Monthly CPI Indicator showed the annual headline inflation rate slowing from 5.6% in September and 4.9% in October to 4.3%. This was below consensus expectations of 4.4%. The Reserve Bank’s (RBA) favoured trimmed mean fell more sharply from 5.3% in October to 4.6%, but still sits near twice the midpoint of the longer-term target of 2%-3%.
While the trend is comforting, the internals are a little more disconcerting. The November reading includes up-to-date price information for 76% of the weight of the quarterly CPI. Consequently, the December quarter CPI, to be released on 31 January, will be more meaningful and will be released just prior to the RBA’s first monetary policy meeting for 2024 on 6 February. It is likely the December quarter trimmed mean will come in below the RBA’s November Statement of Monetary Policy forecast of 1.0%.
Closer examination of the November release reveals increases of the more critical non-discretionary cost-of-living categories are equal to or above the headline (4.3%) and trimmed mean (4.6%) readings. These include Food and non-alcoholic beverages (+4.6%); Housing (+6.6%) – including rent (+7.1%), electricity (+10.7%), Gas and other household fuels (+12.9%); Health (+5.2%); Education (+4.8%); and Insurance and financial services (+8.8%).
Disinflationary pressures were evident in discretionary categories, including Furnishings, household equipment (-0.3%); Clothing and footwear (-0.9%); and Holiday travel and accommodation (-0.3%). The 13% fall in Brent crude prices in October and November saw automotive fuel prices increase just 2.3% on November 2022, well below the 8.6% in October and 19.7% in September. This dampened the Transport segment rise to 3.6% year-on-year from 5.9% in October and 9.4% in September.
Given the quarterly CPI-linked increases in road tolls, the biannual increase in excise on tobacco, alcohol and transport fuel and the stickiness of non-discretionary inflation in both goods and services, household budgets will continue to be stretched and real disposable income will shrink despite wages growing at 4% over the past year. The savings buffer boosted by the fiscal stimulus packages of 2020 and 2021 has been spent with the household savings rate falling to 1.1% in the September quarter. While immigration will support aggregate household consumption, the per capita standard of living will continue to decline through 2024.
A tight labour market remains supportive of household incomes and despite a 0.7% decline in job vacancies in the quarter ended November, vacancies are still 68.6% above pre-pandemic levels. The surge in immigration over the past year should see vacancies continue to fall as newcomers are absorbed into a slowing economy.
Cost-of-living pressures are likely to persist for most of 2024 as The Australian Financial Review’s headline of 2 January 2024 trumpeted “RBA set for September cash rate cut”. While the pace of inflation eases, households must deal with overall price increases of near 20% over the past two years, effectively a meaningful salary cut. Prices are unlikely to decline. And while Stage 3 tax cuts from 1 July will help, it won’t be until mortgage payments start falling that the pressure will ease on households. Unfortunately, there will be many Australian households singing Pyramid’s 1970 hit “Can’t Wait for September.”
Government subsidies on electricity, rent, childcare, renewables, electric vehicles, and road toll caps will ultimately need to be trimmed adding to eventual increased calls on household finances.
Observations
- BHP is committed to achieving net zero emissions. “Our operational greenhouse gas (GHG) emission reduction strategy continues to prioritise structural abatement in areas that are technically and commercially feasible, while working in collaboration with our suppliers, partners, and peers on accelerating the development of other potential decarbonisation technologies. Our medium-term target is to reduce operational GHG emissions by at least 30 per cent from FY2020 levels by FY2030, and our long-term goal is to achieve net zero operational GHG emissions by 2050.” In major transactions BHP has divested its petroleum interests to Woodside Energy and the metallurgical coal operations in Queensland’s Bowen Basin to Whitehaven Coal. Whitehaven “will assume economic and operating control of the Daunia and Blackwater mines on completion of the sale, including all current and future environmental liabilities and rehabilitation obligations.” Is this BHP’s way to net zero?
- As far back as I can remember, Treasury’s iron ore price forecast has been conservative with a capital C. The forecast for the year to June 2024 is US$70 per tonne (62%Fe). The current price is near US$140 and in the financial year to date has not been below US$100 per tonne. The late Julius Sumner Miller would have asked “Why is it so?” Canberra spies suggest the conservative forecast provides a meaningful buffer in the budget for the government to use to reduce debt. However, since the Howard/Costello era the buffer has either been squandered or swallowed by events like the GFC and COVID requiring unforeseen fiscal stimulus.