
This document provides important detail for “Phase 3” of the Morningstar Medalist Rating rollout. Please refer to the updates on “Phases 1 and 2”.
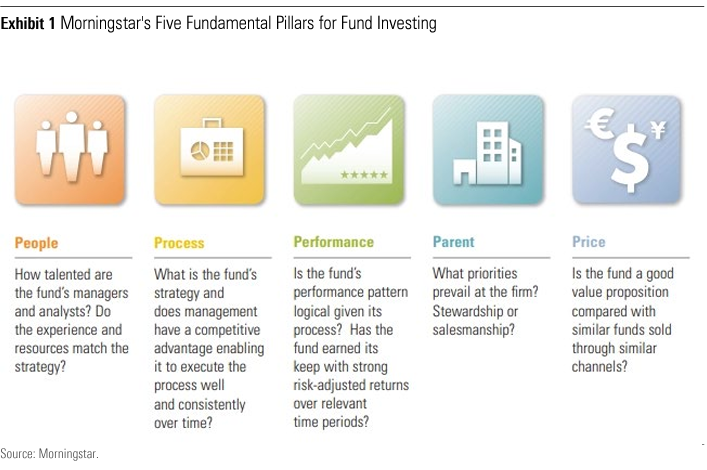
The Morningstar Medalist Rating is underpinned by the three pillars — People, Process, and Parent. Morningstar’s global analyst team believes these three pillars are crucial to predicting the future gross performance of strategies and their associated vehicles.
In accordance with the Morningstar Medalist Rating Methodology, Morningstar assigns pillar ratings to vehicles in one of three ways: “Directly, by Analysts”; “Indirectly, by Analysts”; or “Directly, by Algorithm.”
The Morningstar Medalist Rating is accompanied by two newly implemented data points: Data Coverage % and Analyst-Driven %. The Data Coverage % data point is a summary metric describing the level of data completeness used to generate the overall rating. The Analyst-Driven % data point displays the weighted percentage of a vehicle’s pillar ratings assigned.
Morningstar Medalist Ratings in Australia have been released in a phased manner in the third and fourth quarters in 2023 (based on calendar year).
In Phase 3, commencing on the 1st of November 2023, vehicles expected to receive a Morningstar Medalist Rating should meet the following criteria:
- All three pillar ratings will be either directly or indirectly assigned by an analyst; or
- If an analyst assessment is absent on any Pillar the machine-learning model will assign the Pillar Rating. A Medalist Rating will be produced when 80% or greater Data Coverage exists at the fund level.
Example 1: All three pillar ratings directly or indirectly assigned by an analyst
The following example is illustrative. It uses the Perpetual Diversified Real Return strategy and associated vehicle to demonstrate how inheritance of analyst pillar ratings operate in practice. The Perpetual Diversified Real Return strategy is analyst- covered. The Perpetual Diversified Real Return Funds listed below will inherit all three pillar ratings (People, Process, and Parent Pillars) assigned by analysts, and as such, the Analyst-Driven % = 100% and Data Coverage % = 100%. This example highlights the power of Morningstar’s inheritance logic whereby a primary fund is reviewed by an analyst and these pillar ratings are cascaded to associated vehicles.
Under the Morningstar Medalist Rating system, the analyst typically focuses on the strategy itself to assign pillar ratings and uses the primary vehicle to undertake fund-level analysis (such as performance attribution), given there could be dozens of associated vehicles attached to a particular strategy. The vehicle level is typically only differentiated by the fee load, which may lead to different Medalist Ratings awarded.
In the case of the Perpetual Diversified Real Return strategy, the People and Parent Pillars awarded by analysts are Above Average and the Process Pillar awarded by the analyst is High (as at 8 September 2023).
The example shows the relationship between a primary vehicle and an associated vehicle using the Perpetual Diversified Real Return strategy (StrategyID STUSA05ULS):
- Vehicle 1 (Primary vehicle): Perpetual Diversified Real Return W (Total Cost Ratio – Prospective = 0.92% per year) − Three pillars directly assigned by the analyst
- Vehicle 2 (Associated vehicle): CFS First Choice – Perpetual W Diversified Real Return (Total Cost Ratio – Prospective = 1.25% per year) − Three pillars indirectly assigned by the analyst
Morningstar’s internal systems need to “map” the pillar ratings assigned by the analyst from the primary vehicle to the associated vehicles (in this case, Vehicle 2). This mapping process is not instantaneous. In fact, there may be a lag of up to a month (or in some cases longer) between an analyst publishing a pillar rating for a strategy and the up-to-date rating appearing across all associated vehicles. As such, for the most up-to-date analyst views, we strongly recommend that investors check the primary vehicle’s pillar ratings.
Example 2: If an analyst assessment is absent on any Pillar the machine-learning model will assign the Pillar Rating. A Medalist Rating will be produced when 80% or greater Data Coverage exists at the fund vehicle level.
The following example is illustrative. It uses the T. Rowe Price Australian Equity strategy to demonstrate how this operates in practice. The T. Rowe Price Australian Equity is not fully analyst-covered but does receive a Medalist Rating. The Parent Pillar is indirectly assigned by an analyst. The Process and People Pillars are assigned by the algorithm given 80% or greater Data Coverage exists at the fund vehicle level.
Superannuation, Pension, and Annuities Universes
For the superannuation, pension, and annuities universes, a Morningstar Medalist Rating can be available only for vehicles that have all three pillar ratings directly or indirectly assigned by an analyst.
Phase 1 Refresh: Retirement of the Flagship Fund Rating
The Morningstar Flagship Fund Medalist Rating was specifically designed to ensure that platform vehicles did not receive a separate rating. Instead, the platform vehicle inherited the rating of the primary vehicle, regardless of the fees and costs associated with the platform vehicle. This is inconsistent to how platform vehicles are treated globally.
As such, recall for Phase 1, the Morningstar Flagship Fund Medalist Rating was retired. All vehicles, primary or associated (whether that is a platform vehicle or associated vehicles with different fee arrangements) now receive a Morningstar Medalist Rating. The impact is that different vehicles nested under a strategy may receive different Morningstar Medalist Ratings depending on the fees and costs at the vehicle level.
For example, a Master Trust’s administrative fees and costs will be considered for the Medalist Rating. This is broadly consistent with how the Australian Prudential Regulatory Authority is approaching its Choice and Superannuation Heatmaps where all Total Fees and Costs (that is, both investment and administration fees) are considered. In other words, all fees and costs charged by a vehicle that reduce an investor’s return should be considered. It is also consistent with how Morningstar rates vehicles globally.
The impact of this change is best demonstrated with another example.
Example 3: Impact of Morningstar Flagship Fund Medalist Rating Retirement The following example is illustrative based on ratings outcomes as at 1 November 2023. It uses the Perpetual Diversified Real Return strategy to demonstrate how the retirement of the Flagship Fund Medalist Rating is expected to operate in practice. The example shows three vehicles that are nested under the Perpetual Diversified Real Return strategy (StrategyID STUSA05ULS):
- Vehicle 1: Perpetual Diversified Real Return W (Total Cost Ratio – Prospective = 0.92% per year) − Medalist Rating: Gold − Fees and costs relate to investment management fees and costs
- Vehicle 3: CFS FC-Perpetual W Div Real Return (Total Cost Ratio – Prospective = 1.25% per year) − Medalist Rating: Neutral − Fees and costs relate to investment management and administration fees and costs.
As evidenced above, the Morningstar Medalist Rating reflects the views of the People, Process, and Parent Pillars and the full fee load of the vehicle. The Morningstar Medalist Ratings awarded differ depending on the full fee load of the vehicle.
Importantly, the Morningstar Medalist Rating does not assess or express any opinion about the investment access point (that is, the Master Trust in this case) from a features and benefits perspective. Therefore, to the extent an investor wishes to understand Morningstar’s view of a strategy excluding any administrative fees and costs, in most cases, the primary vehicle’s rating should be considered. In the superannuation and pension universes, there may be some vehicles where the primary vehicle includes administration fees and costs.
Eligibility Requirements
In Australia and New Zealand, there are a number of eligibility requirements that need to be met for a vehicle to receive a Morningstar Medalist Rating. These requirements are in addition to the requirements set out in Appendix D of the Morningstar Medalist Rating Methodology.
- New Zealand vehicles are not eligible for pillar ratings assigned by the algorithm
- Managed account and managed portfolio vehicles are not eligible for pillar ratings assigned by the algorithm
- Superannuation, pension, and annuities universes are not eligible for pillar ratings assigned by the algorithm
- The following categories are not eligible for pillar ratings assigned by the algorithm: Bonds, Emerging-Markets Debt, Bonds – Inflation-Linked, Equity Australia Derivative Income, Equity Europe, Equity Global Technology, Equity Greater China, Equity Japan, Multisector Life Stages – 1940s and earlier; 1950s; 1960s; 1970s; 1980s; 1990s and later, Alternative – Macro Trading, Alternative – Multistrategy, Alternative – Private Debt, Alternative – Other, Alternative – Systematic Trend, Commodities & Precious Metals, Equity Global Resources, Equity Australia Large Geared, Equity Australia Long Short, Equity Australia Other, Equity World Other, Equity World Long Short, Miscellaneous categories, Mortgages, Mortgages Aggressive, Unlisted and Direct Property
- Certain vehicle types that do not provide portfolio holdings disclosures will be capped at a Morningstar Medalist Rating of Bronze.
Supplementary Information to Appendix G: Special Cases in the Morningstar Medalist Rating
Listed Investment Companies
In accordance with the Morningstar Medalist Rating Methodology, Listed Invested Companies may receive a Morningstar Medalist Rating. The rating is derived using the matrix set out in the methodology. As such, ratings on LICs are expected to be entirely analyst-derived. That is, the Analyst-Driven % data point is expected to display 100%. LICs are typically closed-end vehicles, and their share prices may trade at a premium or discount to their net tangible assets. The Morningstar Medalist Rating expresses a view of an active strategy’s ability to add value over the long term when comparing the underlying NTA with a relevant Morningstar Category index after accounting for fees and risk. However, the Medalist Rating does not dynamically change in line with the share-price moves of the strategy relative to its NTA. As such, investors should assess whether the strategy’s share price has deviated materially from its NTA and the impact this may have on longterm return outcomes.
As part of the Medalist Rating rollout, Listed Investment Company reports transitioned to the standard Morningstar Investment Reports. The Morningstar Medalist Rating aims to leverage our global scale and a consistent reporting template supports this objective. As such, investors and advisors should combine the Morningstar Medalist Rating Investment Report with the “LIC Profile Report” to assess both:
- Morningstar’s forward looking view on the strategy’s ability to add value over the long term when comparing the underlying NTA with a relevant Morningstar Category index after accounting for fees and risk; and
- Key performance data and NTA metrics relevant to the assessment of the investment and whether it is trading at a premium or discount to net tangible assets.
After the decision of the Federal Open Market Committee (FOMC) to leave the federal funds rate unchanged at the 1 December meeting, the discussion has turned to when it will start trimming rates. Market pricing is for cuts of around 90-basis points in 2024, with the probability of the first cut in May set at 50%.
Perversely, the topic of rate cuts follows closely on the heels of the hot US 3QGDP growth of 4.9%. With markets basically convinced the Fed has stopped hiking, rate cuts are now openly being discussed despite the higher-for-longer mantra. The six months between now and May 2024 can hardly be described as ‘longer’!
Let’s assume US equity markets flat line over the next six months. Why then would the Fed be thinking about cutting rates with the Dow Jones Industrial Average just 7.2% off its all-time high and the S&P 500 8.7%? And remember the Fed’s balance sheet sits at US$7.9 trillion and by May 2024 will be around US$7.3 trillion as the quantitative tightening program shaves at the designated rate of US$95bn per month. There is still excess liquidity in the financial system to the tune of at least US$3 trillion. Cutting rates too early risks the possibility of reigniting inflation, a risk the Fed is unlikely to embrace.
Unless there is a significant black swan event investors should factor in interest rates and bond yields sitting around the long-term averages. Remember, the 15-year period between the GFC and 2022 was both abnormal and unprecedented. Central banks manipulated global bond markets with quantitative easing programs during the GFC and the COVID-19 pandemic removing the key purpose of free markets to set prices without interference. These actions were conveniently described as central bank Puts and proved expensive. But those days are now over as conditions start to normalise with prospects of mean reversion increasing.
It is hard to imagine a return to zero-bound interest rates and quantitative easing programs given central bank balance sheets are still bloated. The Fed currently owns over 20% of US government debt on issue. The supply of treasuries is set to remain elevated. The US Treasury plans to borrow US$776bn in the current quarter and US$816bn in the March quarter of 2024. These plans were announced after the US government indicated the budget deficit for 2023 would be about US$1.7 trillion.
Current interest rate settings and bond yields are not in rarefied air. They are near long-term averages of the past 50 or so years. They are not like mountaineers, who on reaching the peak then descend quickly. Elevated supply and subdued demand are likely to support Treasury yields for perhaps several years. Bloomberg reports estimated annualised interest payments on US government debt climbed past US$1trn at the end of October having doubled in the past 19 months to the equivalent of 15.9% of the entire Federal budget for the 2022 fiscal year.
With slower economic growth on the cards, corporate earnings are also likely to come under pressure. The recent quarterly results from the Magnificent Seven alluded to slower consumer activity. Last week, Apple warned revenue in 4Q23 will be about the same as last year, disappointing investors banking on a rebound in growth. Cash flow and earnings are more important to equity valuation than the discount factor used, and should they weaken, and the discount factor mirror the risk free 10-year Treasury yield, valuations will be questioned.
A recent report from Glenmede revealed 11.5% of listed US stocks are card carrying members of the zombie network. The Glenmede strategy team calculated their zombie figure by looking at the share of companies in the Russell 3000 index whose earnings before interest, taxes, depreciation, and amortisation (EBITDA) did not cover interest costs in the past three years. As its name suggests, the Russell 3000 tracks the 3,000 largest publicly listed companies, weighted by market capitalisation, and is the widest proxy for the US stock market. The S&P 500 tracks the largest 500.
While the number is below the peak reached in the aftermath of the COVID-19 pandemic (Exhibit 1), interest rates are now over 500-basis points (5%) higher than the then zero-bound. The combination of higher interest rates and a recession would potentially decimate the zombie tribe.
Exhibit 1: The number of serially unprofitable companies in the U.S. remains elevated
“Zombie” companies as a share of listed U.S. companies
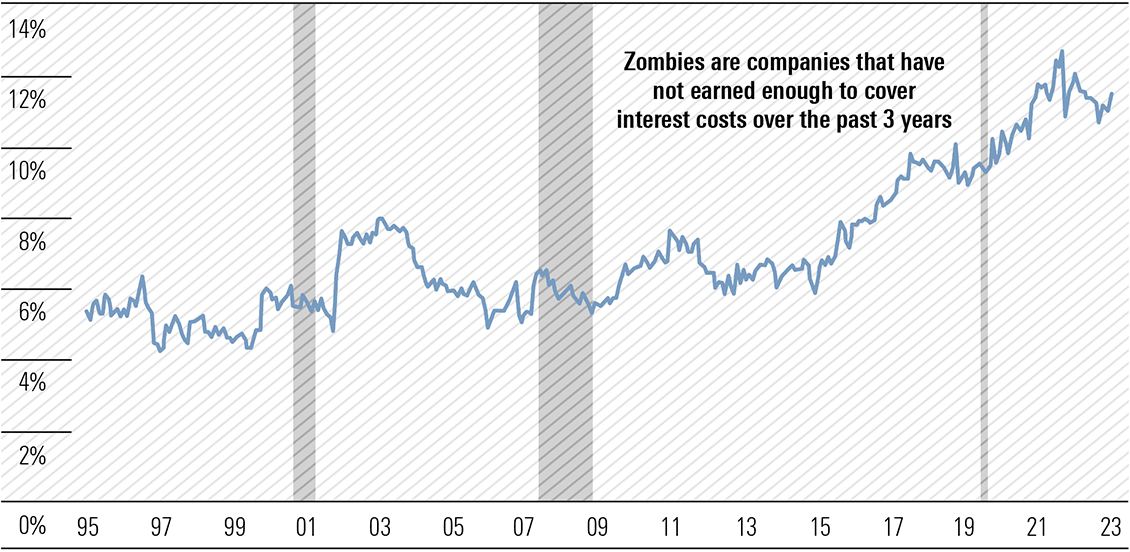
Data through 9/30/2023
Source: Glenmede, FactSet, Bank of International Settlements
Data show is the percentage of companies in the Russell 3000 Index whose earnings before interest, taxes, depreciation and amortization (ie. EBITDA), did not cover their interest costs over the past three years, otherwise referred to as “Zombie Companies.
Berkshire’s cash pile swells to US$157bn
Patience is a virtue and Berkshire Hathaway’s dynamic duo have repeatedly demonstrated they can wait for something. Money is certainly not burning a hole in their pockets as the company’s holdings of cash, cash equivalents and short-term US Treasury securities swelled to US$157.2bn at 30 September. This was near $10bn higher than 30 June and almost US$29bn above holdings at 31 December 2022.
The attraction of risk-free 5%-plus yields on US Treasury securities with maturities of 12 months or less saw holdings of cash and cash equivalents decline by near US$19bn while holdings of Treasury securities jumped by US$29bn to US$126.4bn in the September quarter. Over the quarter, the S&P 500 fell 3.6% and Nasdaq Composite 4.1%. On a risk-adjusted basis the returns were relatively strong and comfortably beating inflation. The investment in Treasuries has a contractual risk with Uncle Sam, no equity market risk.
It was not all one-way traffic. The average yield on the 3-to-12-month Treasuries rose about 20-basis points so there is a small mark-to-market loss as bond prices fall as yields rise. But in the overall context, the capital loss is minimal. A different picture has emerged in the December quarter to date as yields have eased slightly, bond prices edging higher.
The strategy suggests these investment gurus see few opportunities in the market. One of Warren Buffett’s many classic investment quotes “to be fearful when others are greedy and to be greedy only when others are fearful” is well worth remembering.
I noticed Microsoft (NAS:MSFT) reached an untrumpeted all-time high on 8 November. I also note Apple’s (NAS:AAPL) annual free cash flow is near US$100bn but seems to be stalling. Apple is the world’s largest company with a market capitalisation of US$2.8 trillion, selling on a free cash flow multiple of 28. Any company on a multiple, whether free cash flow or earnings, over 20 needs to continually shoot out the lights. There are some suggesting Apple’s free cash flow multiple should be closer to 15. You do the math. Short interest in the Magnificent Seven is at an all-time low.
Heat coming out of the US economy
October’s non-farm payrolls missed on the downside with 150,000 jobs added against expectations of 180,000 and the lowest since June. September’s original 336,000 was revised down to 297,000 and August from 227,000 to 165,000, a total of 101,000 less than previously reported. The October number was well below the 12-month average of 243,000.
Health care (+58,000), government (+51,000) and construction (+23,000) were the main contributors. The struggling manufacturing sector lost 35,000, although 33,000 of the decline was in motor vehicles and parts largely to due strike activity, but still negative. The economically sensitive transportation/warehousing segment lost 12,000 jobs, not needle-moving in the overall context, but has now shed jobs in four of the past five months. Leisure and hospitality added 19,000, well down on the monthly average of 52,000 over the past year.
The private sector added a net 99,000 jobs from 246,000 in September and 299,000 in October 2022. The 3-month moving average for total non-farm jobs was 204,000 and for the private sector 153,000 and is still relatively solid but, there are clear signs the labour market is cooling. Despite a slight fall in the participation rate from 62.8% to 62.7%, the unemployment rate edged higher from 3.8% in both August and September to 3.9% and expectations of 3.8%. This is up 0.5% from April’s 3.4% and like inflation, it is the rate of change that is the focus not the level and it is of some concern.
The average workweek for all employees on private non-farm payrolls edged down by 0.1 hour to 34.3 hours. Average hourly earnings rose 0.2% to US$34.00 month-on-month versus expectations of a 0.3% rise, while the annual rate increased by 4.1% against an expected 4%.
Bond bulls were all over the jobs report and were more excited by worse than expected ISM Manufacturing and Services readings for October, reinforcing the decision of the Federal Open Market Committee to leave the federal funds rate unchanged on 1 November and now convinced the Fed’s hiking days are over. As could be expected, the US$ has weakened with Treasury yields falling, bringing interest rate differentials into play.
China’s mixed trade data asks questions
The October trade data of the world’s largest trading operation and second largest economy provided a mixed picture and was reflective of the world economy. China’s economy is still struggling. The trade surplus fell almost 28% from US$77.7bn in September to US$56.5bn, the lowest monthly surplus in 17 months.
Surprisingly, in US$ terms, imports lifted 3% from a year ago, the first monthly increase since September 2022 led by soybeans and crude oil. Exports fell 6.4% from October 2022 which was by hamstrung by zero-tolerance controls and the consequent disruption to logistics and production. The data confirms the disappointing manufacturing and services PMIs released last week.
The turnaround in imports provided some hope domestic demand is improving after a string of stimulus programs, but the fall in exports indicates offshore demand for Chinese products remains weak. This year, trade with the US, the European Union, Japan, and Southeast Asia has declined. What’s left?
In the first 10 months of 2023, crude oil imports by volume are up 14.4% from 2022 while coal volumes are up 66.8%. Natural gas imports are also meaningfully higher as winter approaches. There appears to be an element of stockpiling (Exhibit 2).
Exhibit 2: China commodity imports (YoY YTD %)
Volume YoY Ytd%
Source: CEIC, ING
Interestingly, 3QGDP growth of both China and the US was the same at 4.9%.
The housing slump continues to shake the struggling property sector as the government tries to prevent the problems from spiraling out of control. China Vanke, one of the oldest and largest real-estate companies in the country, is the latest developer to fall victim to a market selloff joining a growing list of major developers with outsized cash flow problems. Financial restructuring is now commonplace across the sector as bond holders fret and equity holders lose all.
Aussie rate rise came without a fight
The September quarter CPI effectively pushed the RBA board over the line to hike the official cash rate for the 13th time in the tightening cycle to 4.35%. Perversely, it was on Melbourne Cup Day in 2020 the rate was cut to its all-time low of 0.10%. A lot of water has passed under the bridge since then. There will be no further increase in 2023.
Delaying the rise to the December meeting, just three weeks prior to Christmas, was not an option and waiting until February was also off the cards. The increase came after a four-month hiatus where the rate was unchanged at 4.10%. Meetings in 2024 reduce from 11 to eight and will follow key data releases including quarterly CPI or national accounts.
All banks, particularly the big four, should be on notice to raise the deposit rates on all, not selected accounts, by 25-basis points simultaneously with lending rates. There is no discrimination between loan accounts when increases are implemented.
Perhaps in justifying the increase, the RBA has raised its inflation expectations to be around 3.5% by the end of 2024 and at the top of the target range of 2–3% by the end of 2025. “While the central forecast is for CPI inflation to continue to decline, progress looks to be slower than earlier expected.”
Updated information on inflation, the labour market, and economic activity since the August meeting suggested the risk of inflation remaining higher for longer had increased. Despite economic growth being below trend it was also stronger than expected in the first half of the year. The forecast unemployment rate has been trimmed from around 4.5% to 4.25% in 2024. While wages growth has accelerated moderately it remains within the range consistent with the inflation target however it is dependent on an improvement in productivity growth.
The language around further tightening has softened and there was no reference in Governor Michele Bullock’s statement as to the discussions around the two options, hold or raise. Significant uncertainties around the outlook prevail and until some or most recede, the board will remain vigilant in its fight to get inflation contained within the target range.
The 4Q23 CPI data to be released on 31 January 2024 and before the first RBA board meeting on 6 February will be critical as to whether a further rate increase is required. The November Statement on Monetary Policy will be released tomorrow—10 November.
Markets were oversold in late October. Markets rarely rise or fall in a straight line. Meaningful rallies are a normal occurrence. The outlook remains clouded and economic activity will slow as will company profit growth. SEEK job advertising fell 5% in October, the pace of decline accelerating in recent months. Advertising levels are now 30% below the May 2022 peak. Commodity prices are symptomatic of global demand concerns. Mario Draghi, the former president of the European Central Bank, says the European Zone will be in recession by year-end.
Uncertainties abound. Retain a cautious stance and hold cash positions.
The September jobs report ensured volatility remains to the fore in financial markets. The Dow Jones Industrial Average gyrated over a 711-point intraday journey following the revelation 336,000 non-farm payrolls were added in September, the highest monthly increase since January. The S&P 500 and Nasdaq Composite mirrored the volatility with intraday peak to trough moves of 104 and 373 points, respectively. No maturity (day only) options have been a favoured gamble over the past few months in the US market increasing daily volatility.
Expectations of 170,000 were blown away and meaningful revisions to July and August reports of 79,000 and 40,000, respectively added to the apparent tightness in the labour market. The revisions were the first of an upward nature for the year and were all in the public sector, with private sector payrolls trimmed by 12,000.
Despite the surge, the unemployment rate edged up from 3.7% to 3.8%, with the participation rate unchanged at 62.8%. The private sector added 263,000 payrolls, well ahead of the ADP private sector data earlier in the week showing 89,000 jobs were added in the month, continuing its unreliable trait.
The services sector added 234,000 positions, with goods-producing just 29,000 as the manufacturing sector continues to take a back seat. Leisure/hospitality was the main contributor with 96,000 (food services and drinking places 61,000), healthcare 41,000 and the government sector 73,000. Full-time jobs fell for the third consecutive month and have lost 692,000 since June to 134.2 million. The Trading Economics model forecasts full-time employment declines to 133.7 million at year end.
Initially, equity markets dived, and bond yields spiked, but a focus on tame average hourly earnings, which rose 0.2% month-on-month and year-on-year by 4.2% (unchanged from August) versus expectations of 0.3% and 4.3%, calmed anxiety and markets reversed. Strong immigration is adding to labour supply helping to reduce upward pressure on wages rates. The futures pricing for a hike by the Federal Open Market Committee (FOMC) on 1 November increased from 22% to 30%, with 13 December at 50/50 from 35/65 prior. The robust jobs number adds to the higher for longer scenario.
After the dovish dose of Fed speak, the pricing for a November increase slumped from 30% after the robust jobs report to 14% as Treasury yields on the 5–30-year maturity slumped 15 basis points, the sharpest decline since March. Short covering from hedge funds added to the spike in bond prices.
Fed speakers flag a change in sentiment
While the market was digesting the jobs report, Fed speakers suggested the recent surge in bond yields and tightening credit conditions may mean the central bank is less likely to hike.
In a speech to the National Association of business Economics, Dallas Fed President Lorie Logan indicated the increase in term premiums was the main driver behind the surge in yields on longer-dated Treasuries concluding, “if long-term interest rates remain elevated because of higher term premiums, there may be less need to raise the fed funds rate.” A caveat was added—“However, to the extent that strength in the economy is behind the increase in long-term interest rates, the FOMC may need to do more.”
At the same conference, Fed Vice Chair Philip Jefferson expressed his own opinion referring to the impact of the recent rise in real long-term Treasury yields. Part of the upward movement in real yields could reflect the markets’ assessment the underlying momentum of the economy is stronger than previously thought. Consequently, he was “also mindful that increases in real yields can arise from changes in investors’ attitudes toward risk and uncertainty. Looking ahead, I will remain cognizant of the tightening in financial conditions through higher bond yields and will keep that in mind as I assess the future path of policy.”
Markets have interpreted Fed speak as suggesting the surge in bond yields is now past and higher yields have replaced the need for the Fed to hike again. The rise in term premia reflects the expectations of a higher return for increased risk and uncertainty. To suggest yields are about to meaningfully retrace, particularly for longer-dated maturities, seems premature. Higher for longer and reversion to the long-term mean for US Treasury yields is possible, particularly given the supply being created by the US Treasury to fund ongoing significant government deficits. Neither political party has demonstrated it is prepared to address rampant government spending.
The US Treasury wrongfooted financial markets earlier in the year by upgrading its expected borrowing in the September quarter from US$733bn to US$1 trillion. With the quarter now over, on a net basis Treasury has added over US$1.76 trillion to the US government bond pool in the first nine months of 2023. This is higher than any full year over the past decade and at a time when both demand from foreign central banks and sovereign funds has faltered. Both Japan and China have reduced their exposure to US Treasuries since June while supporting their currencies against a surging US$.
Long-term Treasury yields around 4.8% will make the US Treasury’s job of financing net government debt of some US$26.5 trillion (US$33.2 trillion less US$6.8 trillion in intergovernmental holdings—what the government owes itself) challenging to say the least. Annual debt servicing will rise from near US$800bn currently to some US$1.3 trillion, a level that is unsustainable. Treasury Secretary Janet Yellen should already be yelling at Capitol Hill. The US debt bomb is real and one of the reasons long-term premia have increased.
The ISM Services index for September met expectations at 53.6 against 53.5 but eased from August’s 54.5. The services sector has been the mainstay of the economy for the past year or so and the sharp decline in the new orders component from 57.5 to 51.8 requires close monitoring. Perhaps a canary?
The 3Q23 earnings season starts with bank reports on Friday (US time). Earnings growth is likely to have slowed from 3Q22 levels. Estimates have been pared but it would be shortsighted for stocks to rally on reduced earnings beats and lower growth for the third consecutive quarter.
Australia—Consumer sentiment still weak, business a little better
Despite a small improvement, a pessimistic bias continued to dominate the Westpac-Melbourne Institute’s October Consumer Sentiment survey with Senior Economist Matthew Hassan describing it as another “sombre read.”
The index rose 2.9% from 79.7 in September to 82.0 but is still 20 points below its long-term average. The low reading is consistent with falling per capita spending. The survey period of 2–5 October straddled the Reserve Bank’s (RBA) decision to leave rates unchanged on 3 October. Recall, Australia has posted negative per capita GDP growth in two consecutive quarters of March and June. The September quarter will be the third.
Concerns over interest rate increases resurfaced with consumers wary of further rate hikes. Only 7% expect rate cuts over the next year with the annual trimmed mean inflation rate at 5.6% in August. While registering a slight improvement, family finances remained under intense cost-of-living pressure although unemployment expectations provided a rare positive. Depositors are looking for higher rates.
The National Australia Bank’s Monthly Business Survey was much more upbeat with results pointing to ongoing resilience in activity. While business confidence was steady it remains well below average. Capacity utilisation remained high at 84.2% and while forward orders registered a gradual improvement, they remain depressed. There were positive signs around inflation with both input cost pressures and price growth easing, reflecting reduced consumer demand.
Domestic market interest is now focused on the 25 October release of the September quarter CPI. I expect a rise of 1%–1.1% quarter-on quarter (q/q) which would see both the headline and trimmed mean with a 5 in front on a year-on-year basis. Beating the RBA’s forecast for a trimmed mean of 0.9% q/q outlined in the August Statement on Monetary Policy would probably trigger an upgrade to inflation forecasts and drag the board from the interest rate sideline.
The RBA meeting on Melbourne Cup Day 7 November would be live.
Bonds—A lesson worth putting in the vault
Recall the headline in Overview 13 2023 of 13 April: “In an uncertain world, how defensive are bonds?” In September 2022, then Deputy Governor of the RBA Michele Bullock said the bank had taken a mark-to-market valuation loss of $44.9bn on its bond holdings in 2021/22. The losses exceeded 2021/22’s underlying earnings of $8.2bn and wiped-out accumulated reserves of $24.3bn, leaving the central bank with negative equity of $12.4bn.
Most of the bonds were accumulated under the emergency programs which ran from November 2020 to February 2022. In total, the RBA outlaid $361bn to support the yield target comprising $36bn on Yield Curve Control, $44bn on market function purchases and $281bn on the bond purchase program designed to manipulate the market and keep yields close to the official cash rate. Purchases included maturities from July 2022 to April 2033, with April 2024 and November 2024 maturities bought at yields as low as 0.10%.
On 30 June 2022, the yields on the 2, 5 and 10-year maturities were 2.58%, 3.33% and 3.85%, respectively, now 3.94%, 4.04%, and 4.45%. Currently, the yield on the April 2024 and November 2024 maturities are 4.16% and 4.15%.
The central bank’s balance sheet peaked at $647bn in March 2022. On 4 October, the total assets were $542bn, with most of the reduction being the repayment of the first tranche of the Term Funding Facility of $76bn and insignificant maturities.
The ability to hold bonds to maturity will not save the RBA on April 2024 Australian Government bonds. These were purchased around $110 at a yield below 0.20% (Exhibit 1). At maturity, the $100 face value will be returned, and losses realised. The exercise is likely to be repeated in November 2024.
Exhibit 1: Australia AUGOVT 2.75, 21 April 2024
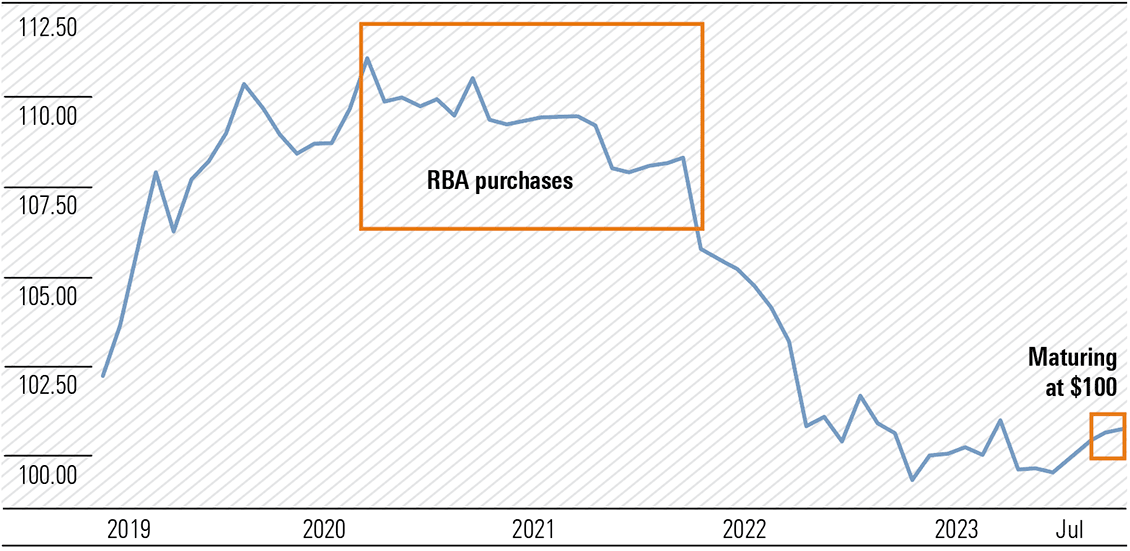
Source: investing.com
The RBA is not alone. Between late January 2020 and the 13 April 2022 when the Fed’s balance sheet peaked just under US$9 trillion the holdings of Treasuries with maturities between one and five years increased from US$908bn to US$2.17 trillion. Exhibit 2 reveals what subsequently occurred, with the 2-year yield soaring, the price deflating. Those 2-year treasuries purchased between October 2021 and April 2022 are maturing or rapidly approaching maturity when losses will be realised.
Exhibit 2: US 2-year treasury bond note yield (%)
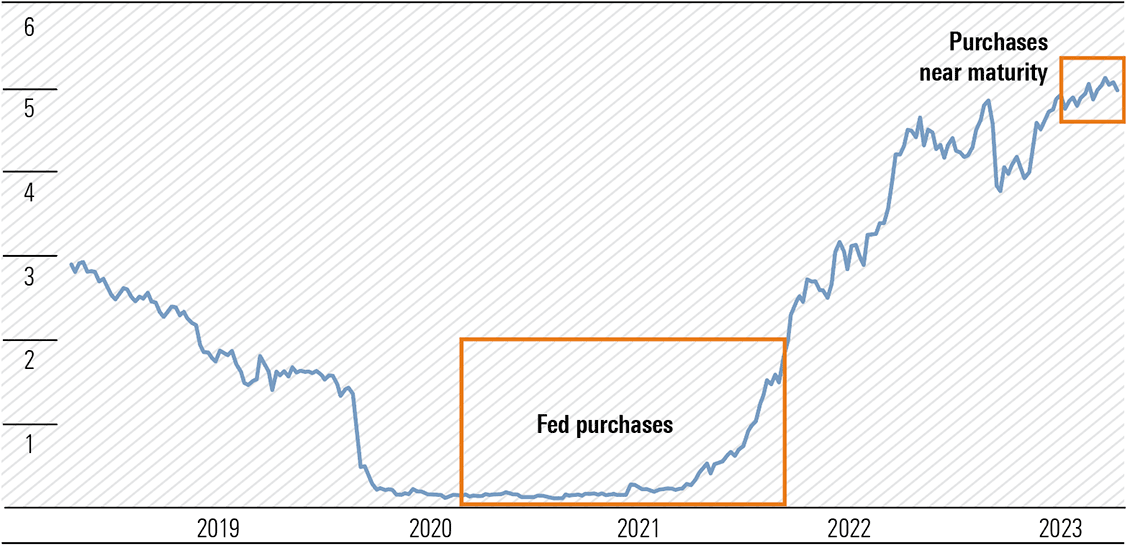
Source: tradingeconomics.com
Introduction
PitchBook’s recent “An LP’s Guide to Manager Selection” offered a framework for private-market manager selection to allow investors to look beyond the sectors’ limited and opaque performance data. This framework consists of six P’s (and a bonus seventh) that are not dissimilar to Morningstar’s five fundamentals of fund investing: People, Process, Performance, Parent, and Price. Many accredited investors may not get the same level of access or disclosure as institutions, so this paper attempts to adapt the PitchBook framework for those examining evergreen, interval, and retail-oriented products.
Many private-market funds are offered in overlapping sequences of open and closed products. A fund of fund or feeder may access one or more of these products. Most marketing documents promote a track record based on prior offerings that are closed with all holdings liquidated, but these offer little in terms of predictability. This doesn’t change whether that’s the most, second-, or third-most recent. In fact, the most recent offering has the weakest predictability, as often some holdings are caused by estimated valuations, which move significantly in the last years of a fund’s life. The dispersion of category returns then is large between quartiles. With a greater level of opaqueness and with investments often being made before the portfolio is known, manager risk is exacerbated, especially with those offering a limited track record or an unfamiliar name. Like hedge funds, smaller, newer managers often provide outsize returns, but fear of the unknown causes many investors stick to a “brand name.” So, with a limited track record and recent fund performance being unpredictive, how should an investor approach the private markets?
The Five Fundamentals of Fund Investing
In our broad categorization of alternative investments, most private-market offerings fall in our Modifiers grouping. In risk factor terms, this means many strategies contain the standard equity, rates, and credit factors but in modified form. Investors reduce the reliance on these factors and instead introduce complexity risk—the need for specific skills coupled with a complex investment that requires them—to generate value. An allocation may come from traditional asset classes and so, in reading this guide, many points of consideration may appear as extensions of those used in mutual fund assessments. Morningstar considers there are five fundamentals of fund investing: People, Process, Performance, Parent, and Price. These five P’s form the backbone of our manager ratings process where thinking about the whole picture can ensure that an investor has gone beyond a performance ranking to gain a better view of the overall capabilities of a manager. This is not an exhaustive list, and there are plenty of other frameworks, but it should be useful for teasing out potential red flags.
Fundamental One: People
The first P, People, looks at the overall quality of a strategy’s investment team—those who make the portfolio decisions. If there is more than one person in charge, it looks at how conflict is managed, and decisions are shared. It considers resource allocation within and in support of the team and the expertise and relevance of those resources. Smaller firms have a large overlap between the investment and management teams, but this is not the case for firms with multiple strategies on offer.,
- Composition—How is the team composed, both in roles and in its complementarity? Private-market firms are a well-trodden path for many recent MBAs after spending their formative years in similar investment banking roles. Groupthink is a risk. Does the manager have the collective capabilities to maximize the value of an investment through the structuring of a deal, the operation of a company, and the exiting of an investment—often in newer industries or markets different from their prior experience?
- Key-Person Risk—A long-term partnership is on the table here, so it needs to be bilateral. There must be comfort that the people they put their trust in will be there throughout the life of the fund. Many mutual fund products do not have the Key-Person Clause seen in direct investments, and an imbalance may exist on investment terms between investor segments or one large investor could affect all investors.
- Longevity—A new fund launching based on a partner’s long tenure in private-market investing needs the same succession-planning consideration as any mutual fund offering.
- Background Checks—Many portfolio managers are unknown, and relationship databases tracking the general partners running older funds are scarce. Realistically, this is hard to do unless an investment consulting firm has recommended a fund, but if employment histories seem vague, be concerned.
- Turnover—It is uncommon for teams to remain intact between capital raisings, and it may be unclear as to the contribution of individuals to any prior successes. New firms wait for asset growth before hiring, so a clear hiring plan should be in place to avoid overworking existing staff.
- Outsourcing—As with mutual fund managers, external research may be used to inform views, and other professionals may be engaged to perform fund-related functions. What is different is the other outside roles often performed by private-market portfolio managers—such as sitting on portfolio company board seats or bankruptcy workout committees. Clarity is required on the extent of such external commitments.
- Experience—Cumulative numbers can be misleading, with one older partner dominating or team members all having the same years of experience but only across one investment cycle. Firms tend to call any employment as experience, including periods when analysts may have no hands-on exposure to a fund or its assets. Time in the market and actual investment experience are two different things.
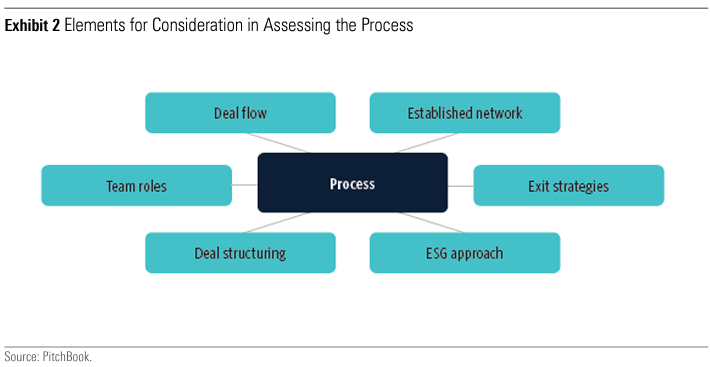
Fundamental Two: Process
Process is the end-to-end description of how deals are sourced and closed, managed, and profitably divested. Many private-market managers talk about their networks and deal-sourcing acumen but little about how they will then manage the portfolios and even less about the exit. A level of macro awareness is required, as holding a company slated for IPO or a loan to a cyclical company may be quickly affected by a change in macro scenario.
Selection and Sourcing
- Networks—Almost every manager claims proprietary deal flow, but can it be substantiated? While vertical or channel integration can be an aid, most deal sourcing is not done in a way that others cannot mimic. The same applies to networks—will it really generate enough quality deals to fill and support a fund, or is it more ad hoc and opportunistic?
- Decision-Making—This is an understanding of how, and by whom, each deal is decided. If decisions are made by committee, how is voting decided? Democracy can introduce tardiness, while limiting decisions to key executives can result in too great a distance between them and the proposed industries or sectors to realize the value proposition. Some firms pass the investment proposal docket along the line between those introducing, assessing, and managing the deal, while others seek continuity.
- Experience—Does the team have experience in structuring deals or in working out distressed holdings? The portfolio manager needs to bring more than just capital to the table. Is there any experience with diverse boards or working with other investors to achieve the best price for an asset?
- Depth—Extensive human capital is required along the value chain. Can the team really be experts from sourcing to managing to divesting? For funds with company holdings, can the individuals really adding value to a board, and how many boards can they bring that value to at once? Much like a stock portfolio, it is important to know that a manager has the capacity to be on top of every asset in a portfolio.
- ESG—If ESG is an investor utility, can material nonfinancial risks be understood and mitigated to create a more durable long-term business model?
Portfolio Construction
- Portfolio Diversity—How diverse will the offering be, and how long will it take to get there? Unlike for mutual funds, many managers are unaware of competitor positioning. Position sizing should be about more than the likely investment size and number of target companies in the portfolio.
- Portfolio Size—What is the target portfolio size? Whether it is loans, companies, or properties, this should logically connect to the capacity of each member of the investment team—not just in asset selection but also in ongoing management and divestment of the assets.
- Concentration—How much can be invested in one company/asset class/sector/issuer? These limits are often tested as a fund grows, so early investors are usually most at risk. The manager also has the temptation to get the ball rolling and generate returns, bringing an immediacy to capital deployment that may not align with that stated process.
- Specialisms—Is the fund a specialist or generalist? Those specializing can be hit by exogenous factors, such as supply chain disruptions, adverse regulatory or judicial decisions, or a massive firm utilizing tremendous resources to block potential disrupters, impacting the whole portfolio.
- Deployment—How quickly will the fund’s capital be invested? There is a fine line in the ramp-up of a fund: Too quickly may highlight a lack of selectivity, while too long could be too much model dependency. Knowing the indicative timeline can mean the managers can be held accountable.
Fundamental Three: Performance
As mentioned earlier, despite what some older studies suggest, the third P, performance, is not a predictor of future success. Within private markets, given the duration of the investments, it is very hard to ascribe any fully realized portfolio to the exact team, philosophy, and process currently being promoted. A portfolio manager with 15 years’ experience may only have had a glancing impact on the portfolio in her first role. A manager taking credit for a deal that occurred within a completely different infrastructure should be met with skepticism. So, what is needed?
- Direct Performance Attribution—There should be clarity on existing deals completed by the current team at the current firm. New managers may come to market with a couple of deals funded by seed investors to show proof of concept. They should be able to discuss how the team sourced these deals,
- how they are progressing, and how its actions have affected this progression. While exits from these deals may be years away, the team must show it has the expertise and network to affect the outcome.
- Prior (External) Fund Performance—If the team was intact during the life span of another fund, the conversation is the same as that of a boutique spinning out of an asset manager. What has changed between that fund and this? What the manager cites as impediments may have been necessary guardrails for investors that are now no longer in place.
- Case Studies—For a completely new manager bringing together a new team in a new firm, evaluation is even harder. Are investors providing money for this manager to learn with? While an energetic and knowledgeable portfolio manager may offer gravitas, with private markets, a much broader contribution is required, and investors should be on guard against any individual overstating their contribution.
- Valuations—Valuation methodology should be an explicit conversation, especially in relation to the prior portfolios being held up as evidence of skill with separate evaluations of realized and unrealized assets.
- Return Composition—There must be a clear articulation as to the future composition of returns. Private markets are more than just buying, improving (valuation or operationally), and selling. Unless it is venture capitll, one or two outsize returns shouldn’t drive performance.
Fundamental Four: Parent
The fourth P, Parent, includes everything about a firm: why it exists, who owns it, how firm-level decisions are made, and so on. Although some of the other P’s offer greater impact, a strategy is not durable without backing from the parent. The firm’s management sets the tone for an evaluation including capacity management, risk management, recruitment, and retention of talent, as well as firmwide policies that align the firm’s interests with those of its investors. Morningstar prefers firms that have a culture of stewardship that are not heavily weighted to salesmanship. These tend to operate within their circle of competence, do a good job of aligning interests, and treat investors’ capital as if it were their own, while firms oriented to prioritizing their own interests view investors as sales opportunities.
- Philosophy—Often new firms are created by the general partners of a bigger firm seeking a greater share of the economics, a change in culture, or a choice of specialism. Although this may be better for the manager, does it benefit the investor? Does the jettisoning of perceived negatives overcome the differing support structures, business management responsibilities, and changed access to talent and deals? As many private-market firms are being gobbled up, at large valuations, by traditional asset managers, questions of autonomy and product development must be at the forefront of mind as these firms seek to generate a return on those acquisitions.
- Ownership—With new ownership comes questions of how the firm is managed. Compared with publicmarket operators, many private-market firms gloss over the details, often thinking that running an assetmanagement firm is about doing deals. If the same people are handling the investing, managing, fundraising, and investor-relations functions, they are perhaps spread too thin.
- Alignment—How well are the individuals managing the fund aligned with the performance experience of the investors? Both the upside and downside need to be shared. This tends to be more asymmetric with private-market firms. Any form of carried interest incentives must align with maximizing investment performance for both investors and the firm.
- Skin in the Game—For newer managers, if the team does not have the financial resources to collectively commit to a material percentage of the fund size, the team members should be willing to prove that what is being committed is a significant personal stake. While it may be uncomfortable, managers are asking investors to tie up capital should be prepared to answer how they are aligned with their partners.
- Competitive Advantage—Like any fund manager, they must bring more than a checkbook. A competitive advantage must exist as both a fund manager for investors and as a capital partner for potential portfolio investments. Claimed specialisms may just be their view of their talents.
Fundamental Five: Price
Noninstitutional private-market investors have limited pricing power. New product launches tend to anchor themselves to competitors’ pricing models on the assumption that this is what the market will bear. This type of approach was witnessed with hedge funds, inhibiting broad adoption. Within offerings for accredited investors, we do see more nuance. Private-debt offerings converge around similar price points, as does venture capital and real estate. PitchBook noted in a 2020 report that emerging managers, just like any fledgling business, should try to be more investor-friendly to get their firms off the ground. The issue for many is they must partner with third-party distributors, and with an extra mouth to feed, even matching large firms with in-house distribution teams is a stretch. This isn’t dissimilar to taking on an anchor investor in exchange for a reduced management fee—the deal must not be so advantageous to the outside investor that the firm cannot run its business.
- Some managers may feel that higher fees are acceptable if the expected returns are better than cheaper options. Others figure a bird in the hand—or a lower fee for the life of a fund—is better than two in the bush—or potential gains from this long-term investment. PitchBook data shows that more than half of private-market funds charge less than 2% for their management fees—this is at the institutional level, so before any periodic liquidity structures are formed, or capital introduction fees are paid.
- In private equity, there is often a hurdle rate at around 8% or so before performance fees are paid. This may have had some flexibility when interest rates were at record lows, but now that rates have risen, investors should not have to accept anything less.
- In a similar vein to the bad old days of hedge funds, there are a myriad of fund expenses that are apportioned in a manner to that seen with public-market investments. The Securities and Exchange Commission is seeking to rectify this and has in 2023 set rules for funds to disclose in greater detail their quarterly fees and expenses to investors. There will also be greater restrictions on allowing favored investors the opportunity to exit on easier terms than others.
Summary
Many private-market companies only operate in the institutional realm. The media tends to highlight only the largest managers, while hundreds more concurrently raising capital cannot attract this sort of attention. Many of these are specialist firms offered by distributors that only focus on private markets. As products are increasingly being marketed to accredited, or wholesale, investors, this is being done by distributors that, again, may not be well known to investors. Many are themselves new to private markets and not related to, or in day-to-day contact with, the actual asset manager. Finding smaller newer managers, or a sector specialist, and not settling for one of the behemoths requires increased diligence. Turning to investment consultants and research houses brings exposure to more managers and a deeper sense of the marketplace. These, too, have capacity limitations, and in many instances, the depth of experience runs dry very quickly in assessing what are new investments to most. Clarity around their processes, assessments, and recommendations is key, rather than blind acceptance of outcomes.
The 5 P’s provide a framework to help organize areas of focus for a potential investment. This framework is not prescriptive, and if there was only one way to run a fund, then the investment industry would be very boring. Ultimately, investors must do their own due diligence. While seeing a name in the media, in the holdings of pension funds, or with a fund rating may provide reassurance, remember that both Bernie Madoff and FTX successfully raised capital because of such a halo effect. Buying a brand name doesn’t alleviate this onus. If this all seems too much, question why private markets are required in your portfolio in the first place to meet your investment goals.
Good Things, Small-Cap Packages
They say good things come in small packages—at least that’s been the dominant mode of thinking in the financial industry for nearly four decades. The concept of a small-cap premium has woven itself into the fabric of decision-making frameworks and investment processes, though there is a small minority out there who suggest it’s more a cliché than market reality. Fund managers continue to make the case both for and against investing in Australian small caps, and while the phenomenon is generally accepted globally, it has been capricious in the Australian market. This paper delves into the historical performance of the Australian small-cap and large-cap indexes, seeking to shed light on whether investors can anticipate superior returns from small caps, and if a passive approach is the most efficient way to gain exposure to the asset class.
Key Takeaways
- The S&P/ASX Small Ordinaries has generally delivered lower returns with more risk than the S&P/ASX 200, which runs counter to the long-entrenched expectations of a small-cap premium.
- The probability of excess returns from the S&P/ASX Small Ordinaries relative to the S&P/ASX 200 is less than 50% using rolling periods of one to 10 years.
- While over the long-term the S&P/ASX 200 has outperformed the S&P/ASX Small Ordinaries, there are periods of small-cap outperformance, implying potential pockets of value add from the asset class.
- Active management may be the key to accessing the premium given the benchmark shortcomings, which will be explored in a follow-up paper.
Benchmarks and Performance
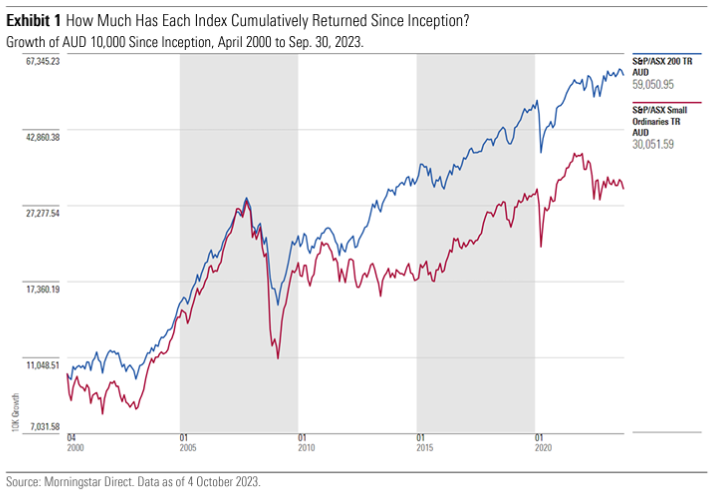
For the purposes of this analysis, the S&P/ASX Small Ordinaries and S&P/ASX 200 represent the small- and large-cap markets in Australia, and both were incepted on April 3, 2000. These are the indexes against which Morningstar assesses Australian small- and large-cap fund managers. Looking at the historical returns of these indexes allows an examination of whether small-cap stocks have outperformed large caps, as would be expected given the premise of a small-cap premium.
Since inception, the S&P/ASX 200 is significantly ahead of the S&P/ASX Small Ordinaries. An investor placing AUD 10,000 into the S&P/ASX Small Ordinaires and S&P/ASX 200 would have seen that sum grow to roughly AUD 30,000 and AUD 60,000, respectively. The S&P/ASX 200 has generated close to an excess of AUD 30,000 since these indexes were launched. Exhibit 1 highlights the cumulative growth of both benchmarks.
Removing the end-point dependency of the growth calculation and looking at returns over rolling periods also indicates that the S&P/ASX Small Ordinaries has not generated a consistent small-cap premium over the S&P/ASX 200. The frequency with which small caps are ahead of their large-cap peers in a given month, using rolling periods of one to 10 years, is consistently below 50%. Over one- and three-year rolling periods an investor has the highest probability of realizing outperformance, and this declines rapidly as you move the rolling period out toward 10 years. Exhibit 2 below shows the historical frequency that a given rolling period has seen small caps outperform large caps.
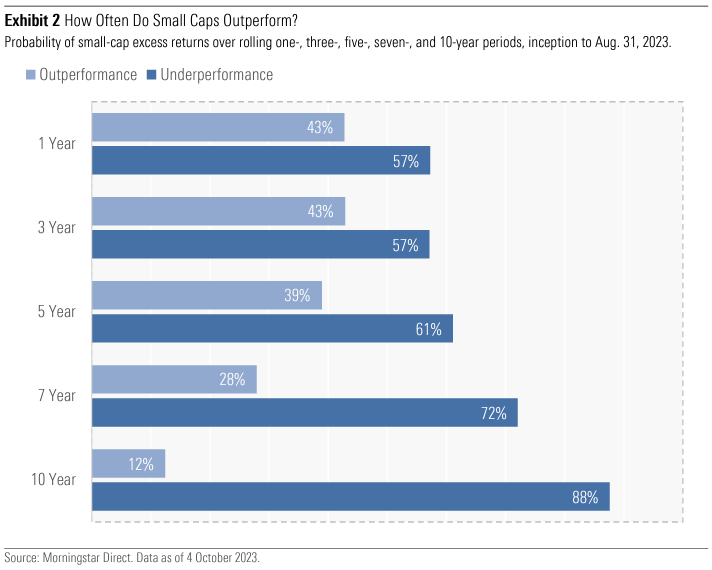
Exhibit 3 below plots the monthly return and volatility of the S&P/ASX Small Ordinaries relative to the S&P/ASX 200 across the same rolling periods. While there are 12 rolling one-year observations where the volatility of returns was lower, for the most part, small-cap volatility was higher than large caps. Returns, though, are skewed to the downside. Based on the historical benchmark data, it seems as though the naysayers may be right.
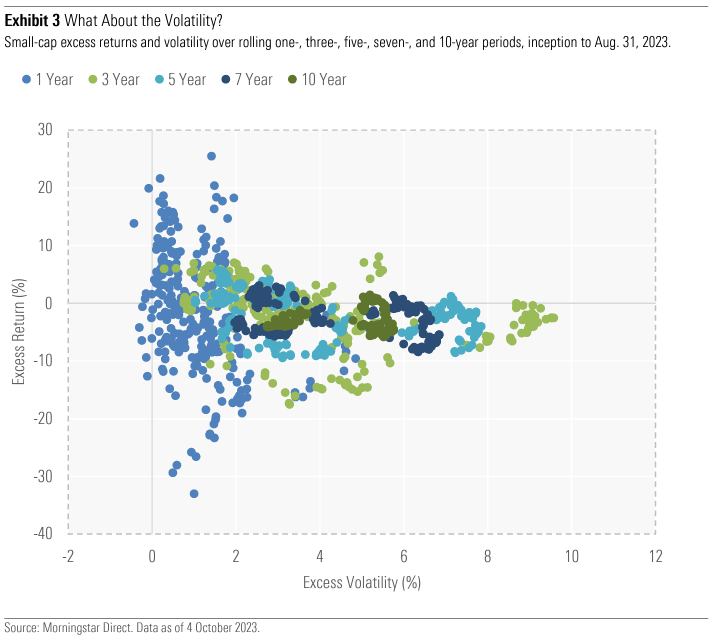
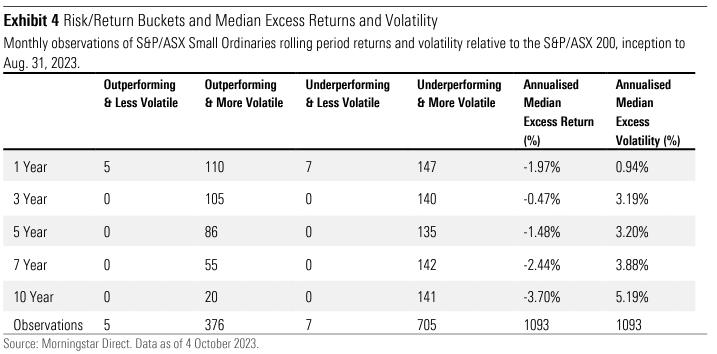
Placing return and volatility outcomes into buckets shows the skew toward lower returns with higher volatility. There are 376 monthly observations across the various rolling periods where small-cap returns outperform the ASX 200 with higher volatility, while there are 705 observations where small-cap returns underperform the ASX 200, again with higher volatility. Annualised median excess returns are negative for all the rolling periods, while the annualised median volatility is higher than the ASX 200 over all rolling periods. Exhibit 4 below displays the risk and return buckets, as well as the annualised median return and volatility figures.
Based on the historical time periods examined, Australian small caps, as measured by the S&P/ASX Small Ordinaries, have generally offered lower returns and more volatility. Lower returns with higher risk, at least the risk side of the equation, makes sense.
Asset Allocation
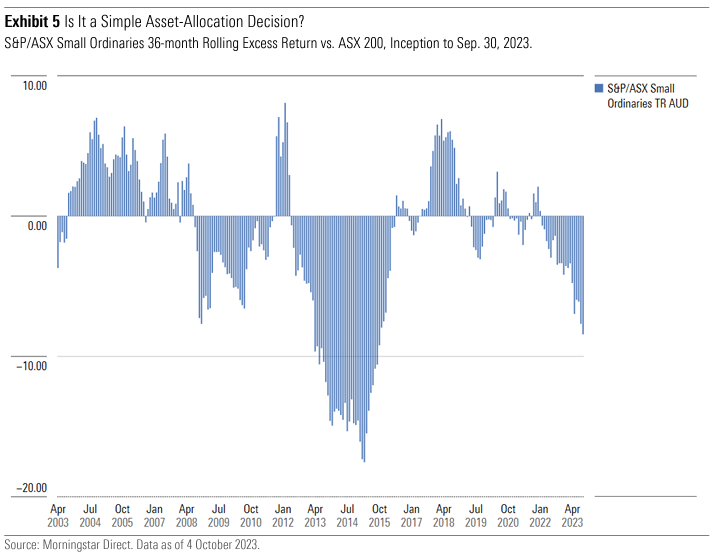
Given that returns at the index level suggest the odds are stacked in favor of large caps, the question becomes whether an investor should allocate to Australian small caps at all, and if they do, how should they gain exposure to the asset class? It is clear that there isn’t a persistent small-cap premium when looking at index returns over long time periods; though, on a mean-reversion basis, you can see periods of outperformance in the short term. Though, given the probability of underperformance, passive investing is likely not the solution for investing in Australian small caps. Exhibit 5 below highlights the rolling 36-month excess returns of the Small Ordinaries relative to the ASX 200.
If Not Passive, Then What?
If you can’t rely on passive investing to consistently harvest a small-cap premium, the logical step is to look at active managers. Exhibit 6 below highlights the annualised returns and volatility of the Morningstar Mid/Small categories relative to the S&P/ASX 200 and accounts for survivorship bias. Much like the prior analysis on the small-cap and large-cap benchmarks, the observations are split into risk/return buckets. Rather than rolling periods, the data is that of annualised return and volatility from common inception or 20 years, whichever is most recent. The resulting median return period is 15 years.
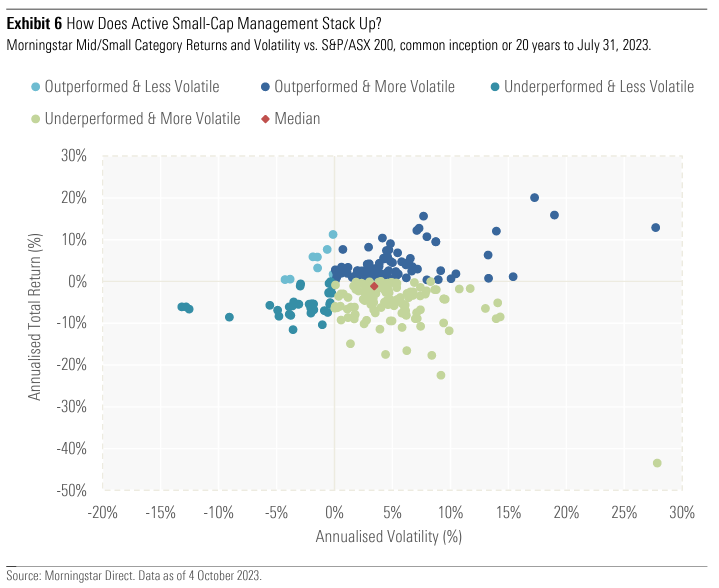
The median small-cap manager has not beaten the S&P/ASX 200 on an annualised basis, and while the analysis shows there’s a range of outcomes depending on your selection of manager, it does highlight that there are a number who’ve outperformed the large-cap benchmark. The implication being that active management is likely a more suitable option for the asset class than passive investing, and that manager selection is a crucial component, particularly if you want to realise a small-cap premium.
Do Good Things Come in Small-Cap Packages?
Do good things come in small packages? Well, sometimes, but more often they don’t. At least that’s the case when using index returns to assess historical performance. While there are rolling periods where the S&P/ASX Small Ordinaries has outperformed, it has generally delivered lower returns with higher risk than the S&P/ASX 200, suggesting the size premium is time-period-dependent in the local market, at least at the index level. The cyclical nature of these excess returns implies that there is the potential to add value through the asset class, though timing plays a role, and the act of timing markets is generally not sensible for the professionals, let alone the everyday investor. This also suggests passive investing in Australian small caps may not be the most strategic weapon in your portfolio construction arsenal. It seems that active small-cap managers do have a role to play, both against the S&P/ASX Small Ordinaries and the S&P/ASX 200, and while the median manager hasn’t outperformed the large-cap index, there are a number who have outperformed both on an annualised basis. The manager selection component will be explored in a follow-up paper. At the benchmark level, though, it seems that in Australia, good things in small packages is just a cliché.
Australian superannuation assets are now around AUD 3.5 trillion, and Morningstar recognises the importance of providing quality insights to investors and advisors. Morningstar has embarked on a significant data uplift to its universe of superannuation options. This data collection effort is ongoing, and gaps remain where superannuation funds have not disclosed data or data is not available (marked as “n/a” across the tables). In the absence of updated asset-allocation data, fund categorisation is challenging, and estimates may be required. Morningstar is committed to continually improving the quality of its data for its investors. If the data for the superannuation options of your fund are not appearing (or not accurate), please contact us.
Overview
In this quarter’s Morningstar Superannuation Survey, we looked at 291 options (including MySuper and Choice options, excluding Transition to Retirement options) across our superannuation multisector balanced, superannuation multisector growth, and superannuation multisector aggressive Morningstar Categories. Some of the largest options in Australia, by net assets, fall into these categories. We traversed the profit-for-member and for-profit landscapes. The Superannuation Survey focuses on fund performance, total fees (including investment and administration), and net assets.
Each quarter in 2023, a Super Survey Supplement will also be released. The supplement will provide additional insight into the superannuation industry and cover an array of topics. This quarter, we took a look at the liquidity profile of five large superannuation funds.
Retirement Is a Long-Term Game. Who Topped the Tables Over 3 and 5 Years as of 30 June 2023?
In the superannuation multisector balanced category, Hostplus Conservative Balanced topped the table over the three- and five-year time horizons. ART Retirement and ART Lifestyle Retirement fared well over these time frames. Vision Balanced Super performed strongly over the five-year time horizon.
In the superannuation multisector growth category over the three-year time frame, Hostplus SRI Balanced Super, ART Balanced, and ART Lifestyle Balanced took the top three spots. Over five years, Hostplus SRI Balanced Super topped the table, followed by Hesta Sustainable Growth and Care Sustainable Balanced.
In the superannuation multisector aggressive category over the three-year time frame, Perpetual Global Allocation Alpha performed very strongly, followed by Mine High Growth and Rest Shares. Over five years, UniSuper Sustainable High Growth led the way with Mine High Growth and Perpetual Global Allocation Alpha not far behind.
Largest Options—MySuper Options Lead the Way
Based on reported data, the largest options across the growth category were AustralianSuper Balanced, Rest Core, Hesta Balanced Growth, and ART Lifestyle Balanced. We are seeking to uplift our data collection of monthly funds under management data so we can improve our insights in this area.
Superannuation Multisector Growth Morningstar Category—Fees
Morningstar uses the total cost ratio (prospective) data point to assess the total fees and costs that are associated with managing and administering an investment product in Australia. This data point includes Investment management fees and costs; administration fees and costs; performance fee costs; and total annual dollar-based charges. It subtracts super OTC derivative costs (to the extent these are reported), and it does not include transaction and operational costs.
The average total cost ratio (prospective) came in around 0.9% for the superannuation multisector growth category. This was lower than last quarter because of the exclusion of the AIA options given the concern with data quality.
Executive Summary
The Sustainable Investing Flows Landscape for Australasian (Australia and New Zealand) Fund Investors provides a high-level view of the trends in asset flows across the sustainable fund universe, and any corollaries to the rest of the Australasian fund universe. The sustainable fund universe encompasses open-end funds and exchange-traded funds that, by Product Disclosure Statement or other regulatory filings, claim to focus on sustainability; impact; or environmental, social, and governance factors. These asset flows are based on estimates from data supplied as of 30 June 2023. This data may not be wholly accurate at the time of writing but should rather serve as an indicative guide to the asset flow trends.
Key Takeaways
- Sustainable assets recorded material net outflows for the first time in the second quarter of 2023. But the outflows of AUD 2.5 billion were largely attributed to redemptions at Vanguard.
- Indexing giant Vanguard experienced AUD 2.7 billion of outflows following one institutional client’s withdrawal from the firm’s ethically conscious funds, as Vanguard scaled back from the institutional investor segment to focus on serving individual investors.
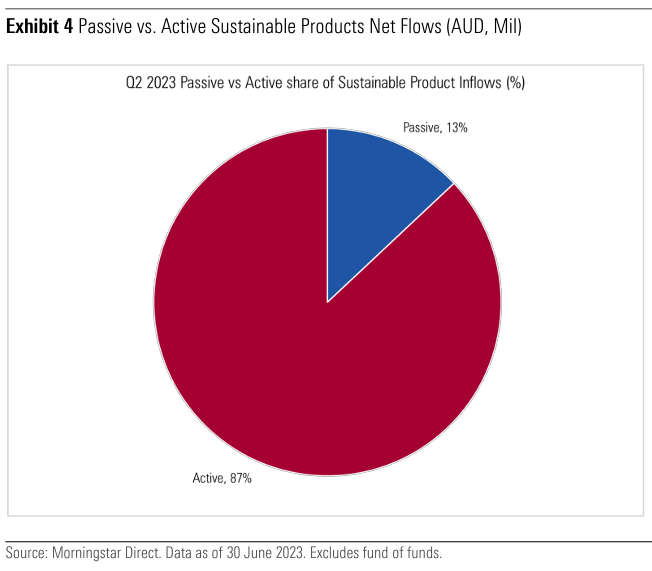
- Outside of the event-driven Vanguard outflows, sustainable investment flows have continued to be resilient when compared with the rest of the investment funds’ universe (conventional strategies). When it comes to sustainable investing, active strategies saw 87% of inflows, with 13% going to passive strategies.
- Assets in the Australasian (Australia and New Zealand) sustainable fund universe, as identified by Morningstar, totaled AUD 45.3 billion at the end of June 2023, a 2.4% decrease from March.
- Australian Ethical, Dimensional Fund Advisors, and BetaShares are the top three providers of sustainability products by market share.
- There were no sustainability product launches during the quarter, indicating potential changes to the product demand landscape ahead.
- Sustainable strategies account for 4.7% of total Australasian fund assets, which were AUD 943 billion at the end of the second quarter.
Asset Flows in the Sustainable Fund Universe
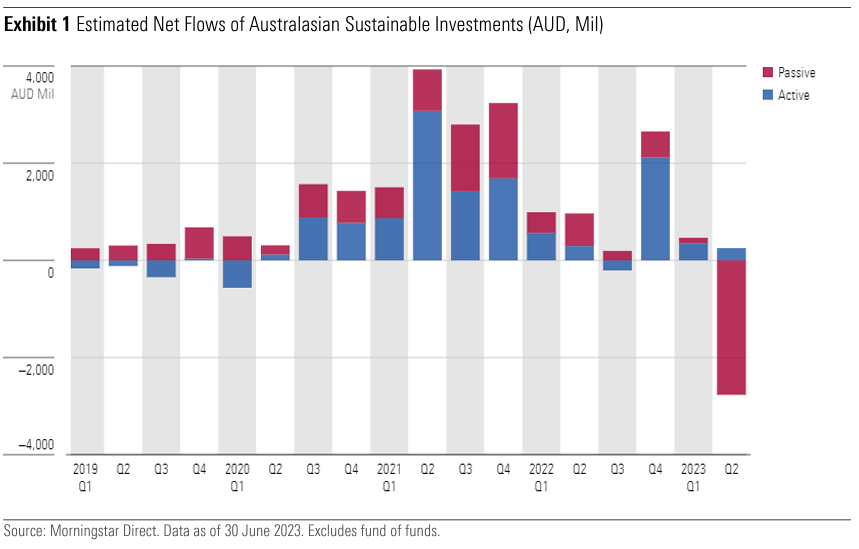
Sustainable strategies experienced their first material outflows in the second quarter. The large withdrawals were largely attributed to one institutional client that moved its investment from Vanguard’s Ethically Conscious funds into mandates managed by another firm. Institutional redemptions at Vanguard are the direct result of the firm’s strategy to withdraw from offering segregated mandates and to scale back from the institutional investor segment to focus on serving individual investors, either directly or through the financial intermediaries that support them. Aside from this event-driven outflow, the sustainable strategies overall registered an approximately AUD 280 million net inflow. Actively managed strategies gained around 87% of the net inflows for the quarter.
To provide context, we compared all sustainable funds’ flows with conventional funds’ flows. The enduring trend of sustainable fund flows being more resilient than their conventional counterparts remains intact. Across the three-year period in every quarter except for the first quarter of 2020, when sustainable funds produced a small outflow of AUD 38 million because of the pandemic, sustainable fund flows have been consistently positive. Sustainable funds’ pandemic outflow was insignificant in comparison to conventional funds’ outflows of AUD 2,184 billion.
While the magnitude of sustainable funds’ inflows does ebb and flow in line with market conditions, tougher market conditions have tended to correspond with lower inflows, and the resilience of inflows compared with conventional funds is indisputable. There have been six consecutive quarters of outflows from conventional strategies to date, contrasting the positive inflows into sustainable investments (excluding the event-driven Vanguard outflows). Quarters two and three in 2022 were significant examples of this, with conventional strategies experiencing significant outflows of AUD 11.2 billion and 8.5 billion, respectively, while sustainable strategies were able to maintain net positive flows of AUD 1.25 billion over those two quarters.
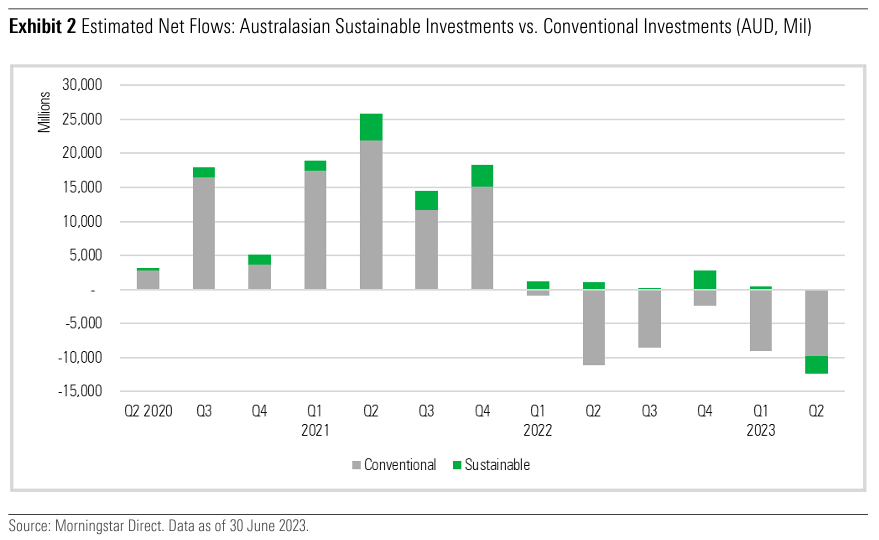
Sustainable Investments’ Material Net Outflows Driven by Changes to Vanguard’s Focus
Australasian sustainable funds saw material net outflows of AUD 2.5 billion over the quarter ended 30 June 2023 owing to the Vanguard redemptions mentioned previously. Conventional strategies (in reference to the broader market traditional strategies) saw net outflows in second-quarter 2023 of AUD 9.85 billion, as shown in Exhibit 2 below. More importantly, though, conventional funds have seen AUD 42 billion in net outflows since the first quarter of 2022, a stark contrast to sustainable funds, which received net inflows of AUD 5.6 billion over the prior 15 months until the end of first-quarter 2023.
Uncertainties around global markets and negative economic sentiment have been on investors’ minds. The abrupt U-turn in the first quarter of 2022 by the US Federal Reserve into a sharp and steep interestrate-hiking cycle sparked ongoing fears of a potential US-led recession cycle impacting the global economy.
Short-term market participants drove the increased scrutiny of the performance merits of sustainable strategies. Delving deeper, the pains across the fixed-income landscape and the recovery in value-led strategies over the past two years saw a wider dispersion between and within asset classes.
At a sector level, sustainable strategies have tended to be light in materials, energy, and shorter-term cyclical assets, while being heavier in information technology, healthcare, and consumer discretionary stocks. Within the fixed-interest universe, the demand for more sustainability-linked issuances has led to “greeniums” being paid, and the lack of supply relative to the traditional fixed-interest universe has also compressed these green-bond yields further.
Securities regulators have also been catching up to private-sector innovations and have been actively firming up their climate-related scope with a concomitant rise in greenwashing scrutiny.
These uncertainties within the global environment were also reflected in the dearth of sustainable product launches so far in 2023 compared with 2022. This was due to multiple potential factors, including a lack of investor demand given global economic uncertainties and a pause by firms as they navigate increased greenwashing regulations.
Top 10 Firms by Sustainable Product Flows for Q2 2023
Indexing giant Vanguard experienced net outflows of AUD 2.77 billion over the quarter across its Ethically Conscious product range as an institutional investor moved externally to segregated mandates. This was mainly in the New Zealand-dollar-hedged vehicles which accounted for AUD 1.87 billion of the outflows. At the product range level, AUD 2 billion of these outflows were from the Vanguard International Shares Index Funds and AUD 570 million from the Vanguard Global Aggregate Bond Index Funds. The wholesale Vanguard Ethically Conscious Australian Shares Fund saw an outflow of AUD 214 million over the quarter.
The sustainable investing firms that gained flows over the quarter are shown in Exhibit 3 below. The clear winner was Australian Ethical, which saw AUD 184 million in net inflows this quarter. This was followed by Russell Investments and First Sentier Investors with AUD 127 million and AUD 44 million in net inflows, respectively.
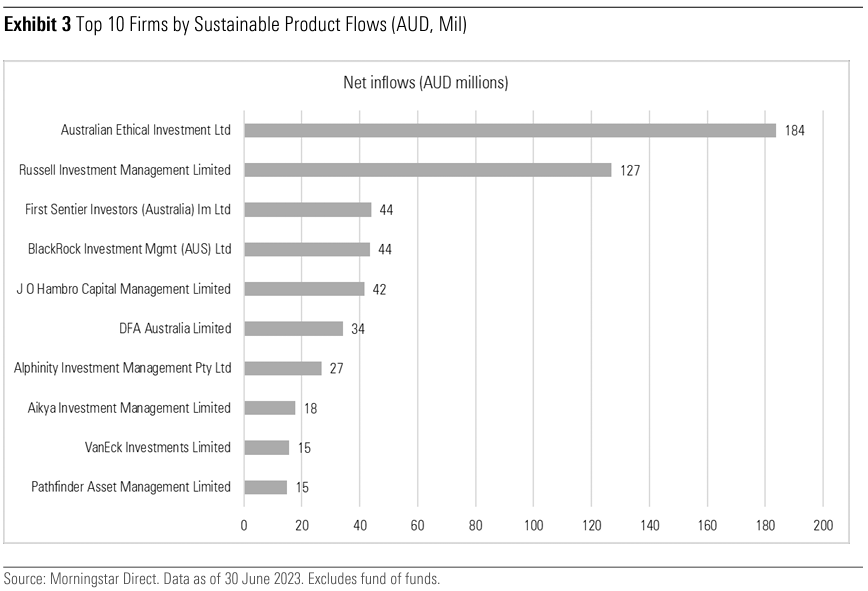
Exhibit 4 shows that active funds were the beneficiaries of flows over the quarter, with just over AUD 250 million in net inflows, while passives saw AUD 2.77 billion in outflows. Drilling down further, however, we do note that when the above-mentioned Vanguard wholesale funds are excluded from the calculation, the passive sector gained AUD 36 million in inflows.
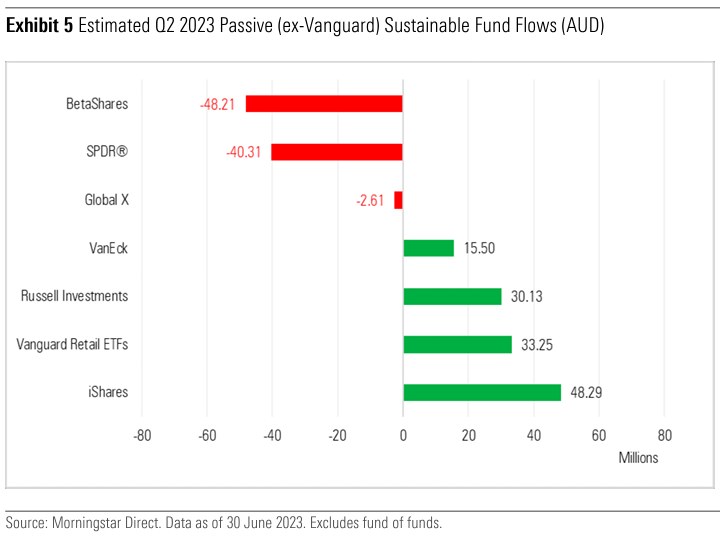
Outside of the abnormal Vanguard outflows mentioned earlier, a clearer picture emerges among the other passive providers as shown in Exhibit 5. BetaShares and SPDR saw outflows, while iShares, Russell Investments, and VanEck received inflows.
Top 10 Firms’ Market Share of Sustainability Products
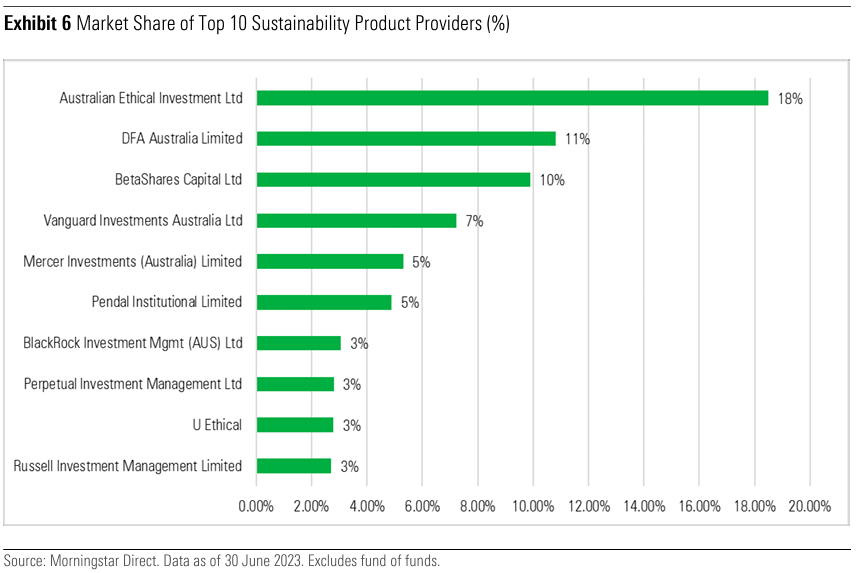
The top five fund houses by sustainable funds-under-management market share are Australian Ethical with 18.5%, DFA Australia with 10.8%, ETF provider BetaShares with 9.9%, and Vanguard Investments Australia with 7.2%. Vanguard held a 12% market share and second place among the sustainability products providers in the first quarter of 2023, which is a material shift. The Vanguard Ethically Conscious ETF range does however have net inflows, which is an indication that the retail market still investing in its products.
Product Launches
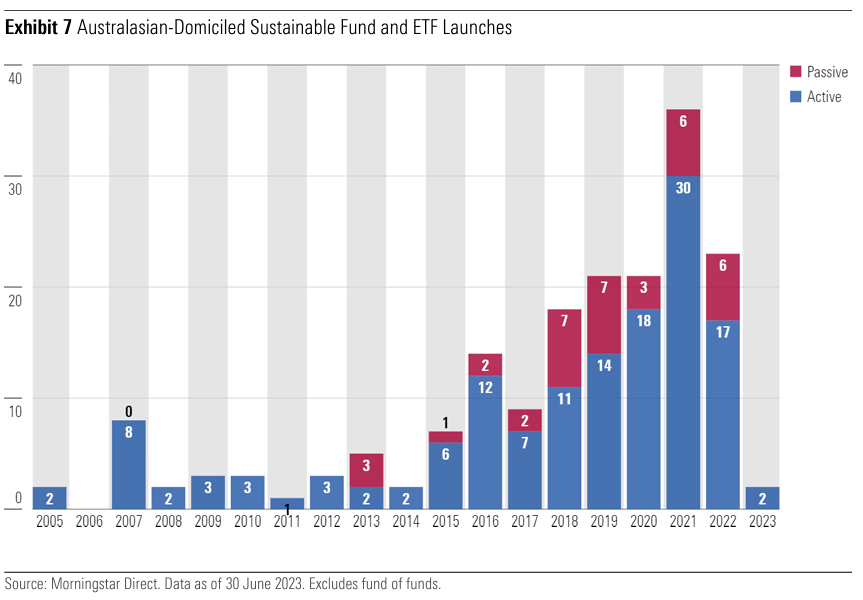
Compared with Europe and the United States (as seen in the global version of the landscape report), the sustainable fund market in Australasia remains relatively small with 194 funds. There were no new sustainable funds launched in the second quarter of 2023. The two launches seen in the first quarter were in line with the launch figure last seen in 2014. This is potentially indicative of a peak in investor demand and a saturated product landscape. We have observed when new sustainable strategies are launched, they tend to be active approaches.
However, this metric does not capture asset managers repurposing and rebranding conventional products into sustainable offerings, or investors moving into other vehicles such as segregated mandates. Finally, the sustainable fund universe does not contain the growing number of Australasian funds that now formally consider environmental, social, and governance factors in their security selection.
Aggregate Fund Sizes
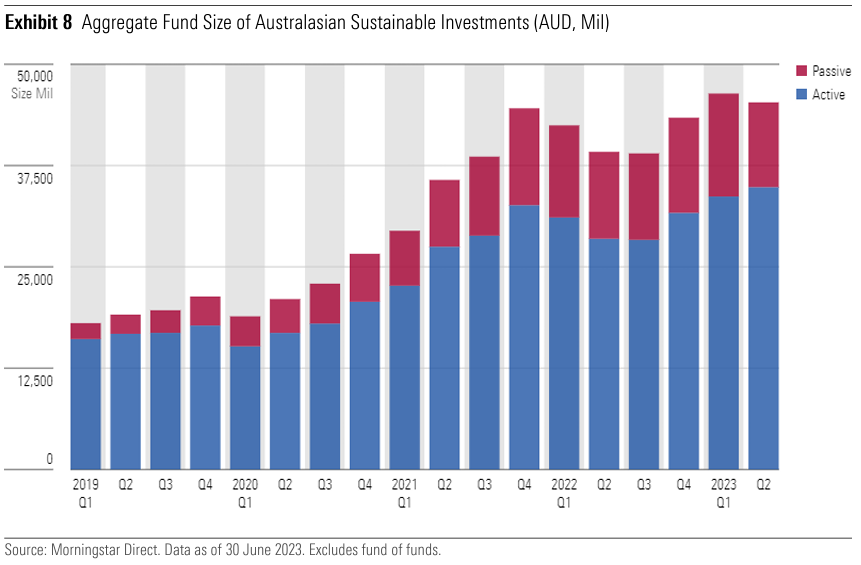
Accounting for Vanguard’s event-driven outflows this quarter, assets overall in Australasian sustainable funds decreased in the second quarter, down almost AUD 1.1 billion via a combination of market movements and outflows. The total size of Australasian sustainable investments is estimated to be AUD 45.3 billion, down from the previous quarter’s record-breaking total of AUD 46.4 billion, equating to a decrease of 2.4%.
Australian Ethical, with total assets of AUD 8.4 billion, is the dominant Australasian provider of sustainable strategies in the Morningstar database, followed by DFA Australia Limited with AUD 4.9 billion. With two new strategies launched in the first quarter of 2023, we count 194 strategies in our Australasian sustainable fund universe.
Sustainable Funds’ Market Share
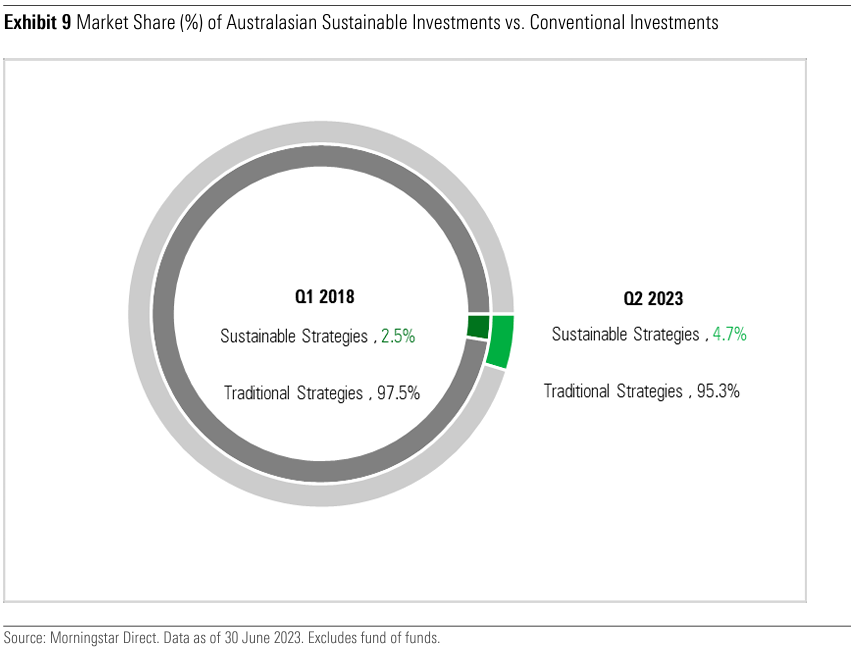
The market share of sustainable funds has been steadily growing over the past few years. Since 31 March 2018, sustainable funds have increased their market share from 2.5% of the total Australasian fund universe to 4.7% as of 30 June 2023.
The total size of the universe of Australasian open-ended funds, including exchange-traded funds, was AUD 943 billion at the end of second-quarter 2023. At this time, conventional strategies accounted for AUD 898 billion in assets compared with sustainable strategies’ AUD 44 billion.
The AUD 44 billion also included a number of existing and previously conventional strategies that have evolved their investment processes to become sustainability focused.
Older Australians might be feeling their creaky knees, stiff backs and failing eyesight, but one thing they should not feel is neglected by government departments and agencies studying their potential financial futures. The many reports and reviews issued recently are giving greater understanding about retirement and attempting to improve the outcomes for Australians living on their savings.
Over the next five years, according to the Australian Bureau of Statistics (ABS), 670,000 Australian intend to retire, taking the total number retired to almost five million. A check of how often the word ‘retirement’ is searched for on Google over the last 10 years shows a recent and sustained spike.
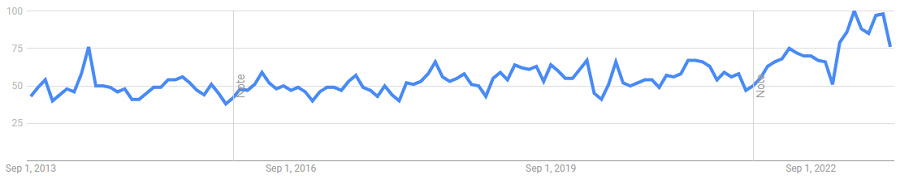
Australia is not alone in focussing on its ageing population. The World Health Organisation reports that by 2030, 1 in 6 people in the world will be aged 60 and over, a formidable 1.4 billion people or an increase of 400 million in 10 years. The number will exceed 2 billion by 2050, including 425 million aged 80 and over. We will live in a world where 100th birthdays are common.
The strong focus on retirement
For most of the time since the introduction of compulsory superannuation for more workers in 1992, and increasingly as retirement has become a major social and political issue, the focus has been on accumulation. The demographic shift underway has forced a rethink towards the retirement phase and decumulation.
In addition to the recent Intergenerational Report and Legislating the Objective of Superannuation, regulators ASIC and APRA completed a joint review of the implementation of the Retirement Income Covenant, issued in 2020. Registerable Superannuation Entities (RSE) need to develop strategies to assist their members to know how much they can spend in retirement, confirming that many people die with the bulk of the wealth they held at retirement intact. The regulators were highly critical:
“Overall, there was a lack of progress and insufficient urgency from RSE licensees in embracing the retirement income covenant to improve members’ retirement outcomes.”
So with this bombardment of insights and guidelines on how governments and the financial sector are supposed to meet the needs of retirees, we should know who they are and why they retired.
For this we turn to the ABS which has issued a new report on Retirement and Retirement Intentions, based on FY21 data.
When are Australians retiring?
The ABS estimates there are already 4.1 million retirees in Australia. In 2020, 140,000 people retired, with an average age of 64.3 years. The age pension remains the primary source of income for most retirees.
Graph 1 shows the age when people retired from the labour force (that is, ceased working or looking for work).
The chart shows the current age versus age at retirement of retirees. For example, there are far more retirees over the age of 70 than people retiring at that age. People are still alive but they retired earlier. But in the age group 60 to 64, there are far more people retiring at that age. The average age at retirement is 65.4 for men and 63.7 for women.
Why are Australians retiring?
Retirement is a major change, giving up or losing regular income from work and relying on savings or a pension, but about 2,700 Australians a week take this step. The top three reasons for ceasing work are:
- Reached retirement age or eligible for superannuation (28%)
- Own sickness, injury or disability (13%)
- Retrenched, dismissed or no work available (7%).
Women were more likely to retire to care for a person than men (4% versus 2%).
Not surprisingly, the age of retirement of people retrenched, dismissed or injured is much lower than people who voluntarily retire. It shows thousands of people in their 50s ‘retire’ each year against their own choice. One-third of retired women rely on their partner’s income after retirement, compared with only 7% of men.
Investment risk by generation
Turning to another recent report, the Australian Securities Exchange (ASX) releases an annual Australian Investor Study. The 2023 Report says that 10.2 million people or 51% of the adult population hold investments outside their home and superannuation. Over the years, the ASX has increasingly focussed on generational differences, especially as more younger investors start their journey with listed securities.
As should be expected, the 2023 Report shows retirees are highest for seeking ‘stable, reliable returns’ and lowest for ‘higher variability with potential for higher returns’. Retirees are also more likely than younger generations to hold a diversified portfolio.
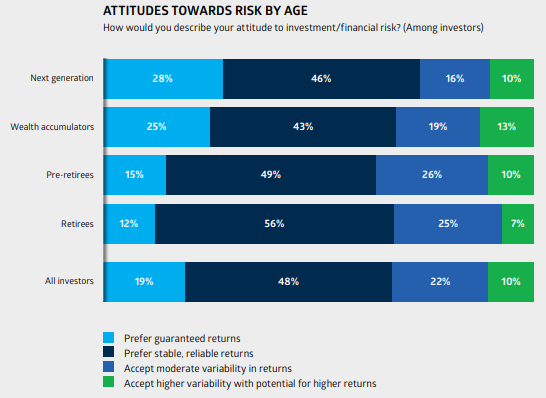
SMSF members by age
A final check on SMSF usage by age from the latest ATO statistics (data for March 2023 is extrapolated from FY21). There were 606,000 SMSFs with 1,136,000 members, holding $890 billion.
Although there is much media coverage about younger generations opening SMSFs, only 3.1% of members are 34 years and under, although a strong 19.2% are aged 35 to 49. Which leaves 77.7% aged 50 and over, with high representation in all older age groups including 17.2% over the age of 75 and 11.9% between 70 and 74. It’s clear that SMSFs are a popular superannuation vehicle for older Australians.
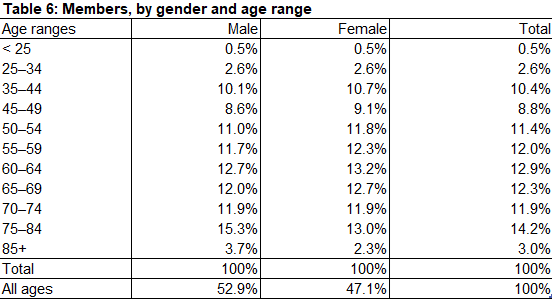
The policy implications of these changes are profound, from the impact on government revenues, the demand for housing, the impending wealth transfer from baby boomers to their children, and the design of financial products for decumulation. Investors should factor demographic changes into assessing the future of any company.
We could have opened with a quote from a famous value investor like Benjamin Graham, Warren Buffet, or Charlie Munger. But let’s take a more modern approach: Let’s use Chat GPT.
According to this AI tool “Value investing is an investment strategy based on the fundamental analysis of stocks or other assets to determine their intrinsic value. The core principle of value investing is to identify and purchase assets trading below their intrinsic value, in the expectation the market will recognise and correct this undervaluation, leading to price appreciation.”
It is an approach we believe in at Morningstar. Figure out what something is worth, then invest with a margin of safety. Keep this front of mind.
Two things we hear from clients:
- Bank share prices are below where they were 10 years ago, why would I buy bank shares?
- People have said Commonwealth Bank is expensive for years, but it just keeps going up!
Exhibit 1: Only CBA share price is up in last 10 years
Source: Pitchbook data as of September 11, 2023
Shares have gone nowhere, why invest?
Westpac and ANZ shares are down 33% and 17% respectively, in the last 10 years. With dividends, the returns are more respectable but still not great. Since August 2013, Westpac has paid fully franked dividends totaling $15.49 per share, ANZ not far behind at $15.19. This lifts 10-year total shareholder CAGR to 1.4% for Westpac and 3.6% for ANZ. National Australia Bank has done a little better with total shareholder CAGR of 4.3%. The S&P/ASX 200 total return index has returned around 8% per year for the period.
We forecast Westpac’s ROE to be 9.5% in FY24, down from 15% ten years ago. The financial services royal commission, anti-money-laundering breaches, asset divestments, and lower interest rates have driven the earnings decline. Net interest margins, or NIM, has weakened, asset divestments have halved non-interest income, and operating expenses have risen on risk, compliance and technology spend. Meanwhile, Westpac now holds an additional $24 billion in shareholder equity, a more than 50% increase. Not a pretty story and explains the share price weakness.
But we think the next five years will look different. Margins are recovering from FY22 lows and smaller banks and nonbank lenders are struggling to compete as funding costs rise. Cost savings look achievable given the bloated cost base while recent changes make it unlikely APRA will again lift capital requirements. Our Westpac stock pitch report published July 31, 2023 has more details.
Market expectations are now low, which we think is an opportunity. At the current share price, the FY24 PE of 11.0 and price/book of 1.0 seem to imply no operational and profit improvement. By contrast, Westpac traded on a P/E of 13 and price/book value of 2.2 in 2012 and an average price/book of 1.6 for the 10 years to 2022.
Exhibit 2: Higher multiple expected on improved profitability
Source: Company Reports, Morningstar
Our fair value estimate of $28 for Westpac, which is 30% above the current share price, implies a FY25 PE of 12.7 times and price to book value of 1.3 times. National Australia Bank, for comparison, trades on a price to book of 1.5 times, showing that if Westpac can improve profitability as we expect, a modest multiple rerate is likely and can deliver attractive shareholder returns. We only expect Westpac’s ROE to improve to 10.5% in FY25, still much lower from 15% in FY13.
Price matters and Commonwealth Bank looks expensive
Past performance does not equal future performance. Yes, Commonwealth Bank shares have outperformed peers, and materially since 2019, but there is no guarantee history will repeat. Commonwealth Bank has delivered an annual total shareholder return of 8.8% over the last 10 years. ROE is down from over 18%, but still at a respectable 14%. But current share price implies a FY24 price to book of 2.3, above the 10-year average of 2.2.
Commonwealth Bank shares trade on a forward PE of 17.5 and Westpac 11.0. It seems valuation is being ignored by many investors. Index aware investors likely gravitate to the largest lender for bank exposure. It’s an easy argument to make—digital leader, most efficient, cheapest funding sources, strongest loan growth from direct channels (branches and mobile lenders), a sound balance sheet, conservative provision levels, and market share gains in home loans.
The 4.5% dividend yield for Commonwealth Bank is not overly attractive either, you can get 4.8% in a Commonwealth Bank term deposit. Granted, it is not like-for-like comparison, given the dividend yield grossed up is 6.9%, and income of term deposits has no franking credits. But the equity risk premium in Commonwealth Bank shares looks slim.
Total return is ultimately what investors should focus on. Our fair value estimate of $90 per share for Commonwealth Bank implies a FY24 dividend yield of 5.1% and price/book ratio of 2.1. The capital loss if the share price falls back to our fair value estimate, would essentially offset two and a half years of dividends.
What’s in the price?
A simple answer is what’s the implied cost of equity based on the current stock price. We use a 9% cost of equity in our valuation for all the major banks, given their similar exposures, business models and the common regulatory environment. If we lower the discount rate on Commonwealth Bank to 8%, our fair value estimate increases around 15% to the current share price. All else equal, lifting the discount rate to 10.5% gets our Westpac fair value close to the current Westpac share price. We don’t think such a large difference is warranted though.
Alternatively, to justify the current stock price, we need to assume Westpac loses more market share, its cost base blows out further, and profitability remains sub-par with a return on equity of just 8% in five years. For Commonwealth Bank, we’d need to assume significantly stronger loan growth, further substantial cost efficiencies and the return on equity grows back up to 17% from 14% now. This seems unrealistic longer-term given the competitive landscape and similarities in the big four banks’ business models.
What about regulation?
Politicians and media talking heads love to pop up when Commonwealth Bank hands down earnings. They like to express outrage at such large profits from a single company. This populist view is shared by many. I for one prefer profitable and well-funded banks with low risk of failure, unlike Silicon Valley Bank, First Republic Bank, and Credit Suisse which all recently imploded.
However, government may see record profits as a green light for levies and taxes. This seems unfair given profitability has fallen materially over the past decade. Commonwealth Bank’s return on equity of 14% compares to 18.5% ten years ago, and it is expected to fall more in the short-term on weaker margins and bad debts. We forecast the other major banks to make returns on equity of 10.5-11.5% in FY23, solid but not spectacular. When the bank levy was introduced in 2017, the average major bank return on equity was at least 13.5%.
Australia’s biggest retailers, Wesfarmers, Woolworths and Coles delivered ROE’s of 30%, 26%, and 34% respectively, in FY23. There are a host of other big corporates across many sectors making very large profits and attractive returns—generally a good thing and a sign those businesses are performing well. Against that backdrop, we think any additional bank specific regulations and tax are hard to justify. That is the base case assumption for our bank sector fair value estimates.
Exhibit 3: Bank’s slipping down the ranks of the highest ROE firms
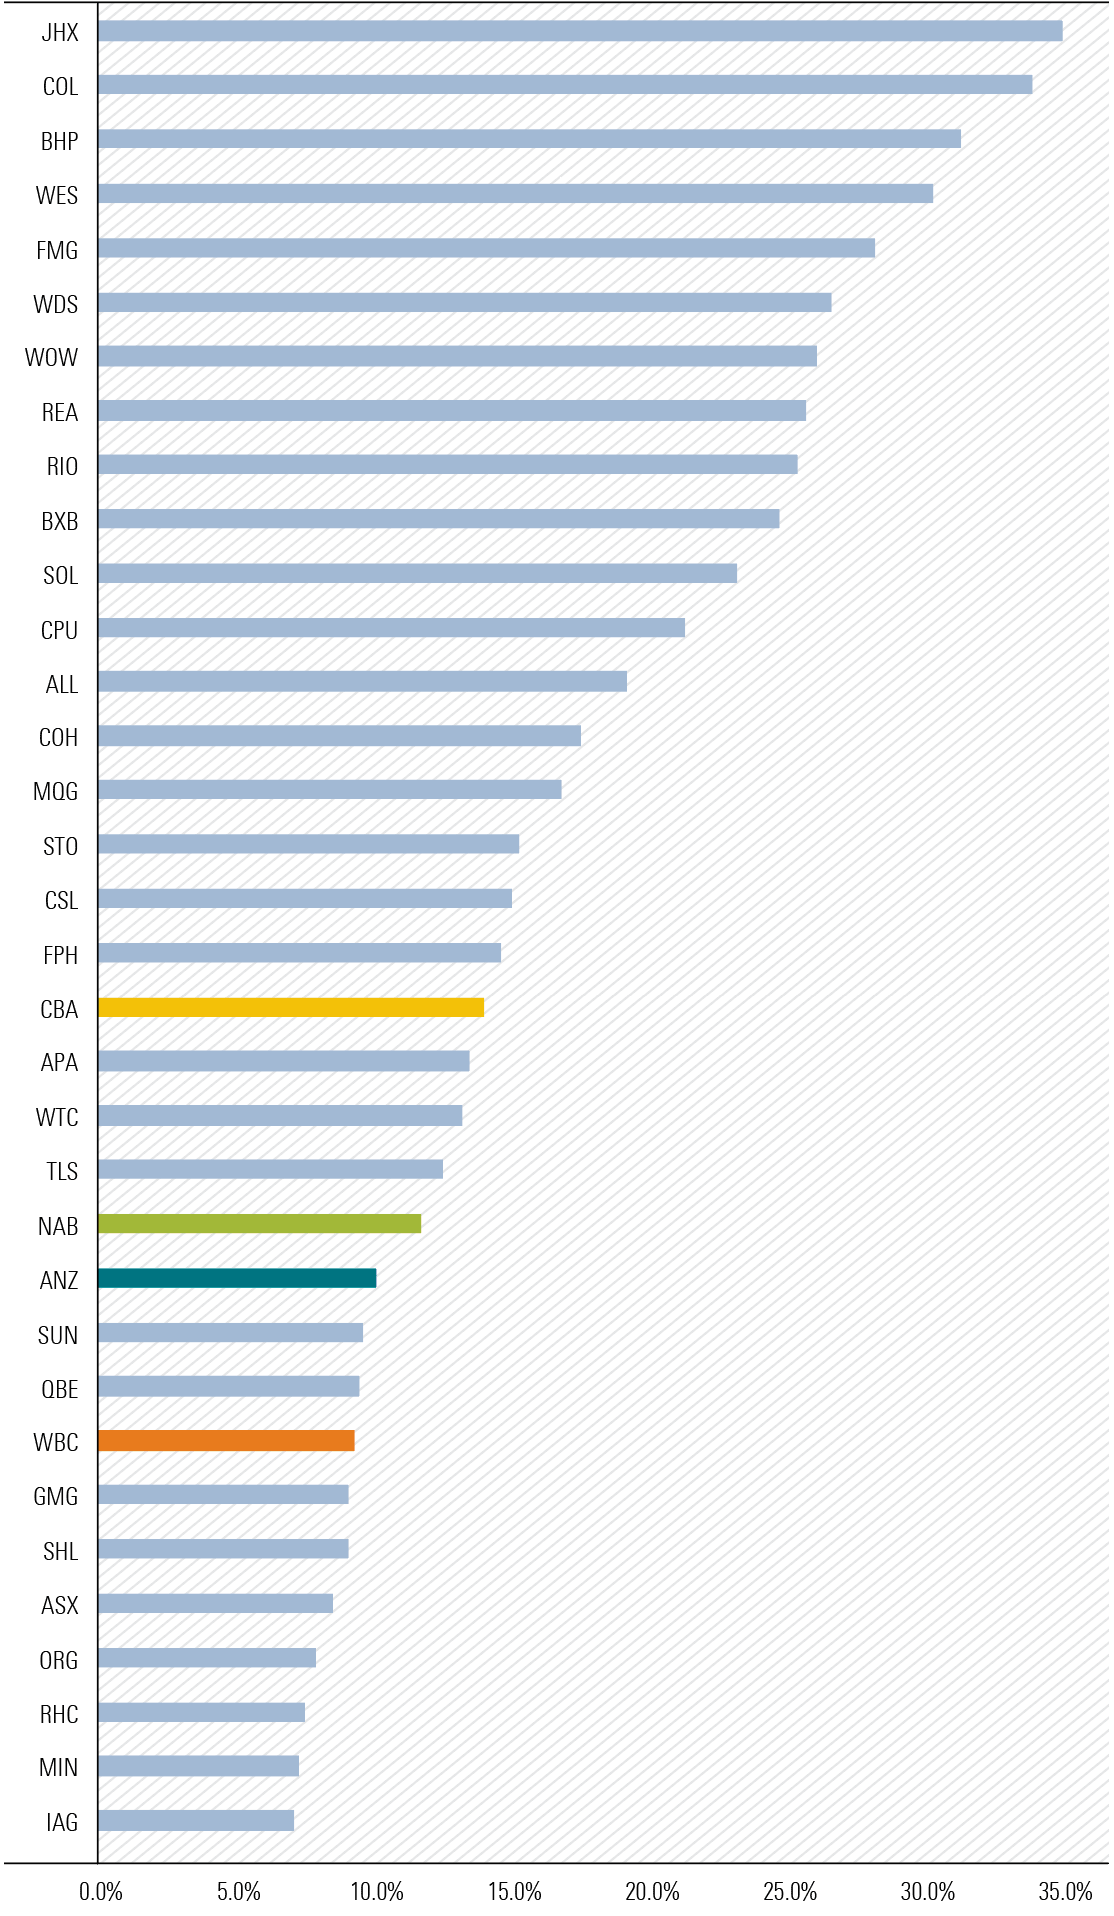
Source: Morningstar
Overview
Morningstar’s coverage universe is expanding. We’ve shared that from September, the Morningstar Medalist Ratings can be powered by an analyst, a machine-learning algorithm, or a combination of both. Our approach to analyst coverage is also evolving. We believe some strategies can be covered more dynamically to enable analysts to spend more time where warranted.
How Morningstar Makes Analyst Coverage Decisions
Morningstar follows several principles in determining which vehicles will be covered by analysts. We consider factors including investment merit, investor interest, and client demand. Morningstar seeks to ensure that users of its research have access to analysis on a broad spectrum of vehicles that are important to them and meet their needs for portfolio construction. Given we do not charge asset managers to rate their strategies, we allocate analyst resourcing where we believe it will have the most impact for investors.
Manager Research Analyst Review Schedule
Analysts typically review strategies under coverage annually or as often as material changes warrant. This review includes data analysis, an interview with the investment team, completion of a ratings note, vetting and approval of the proposed ratings by the Morningstar Ratings Committee, and publication of an updated Morningstar Investment Report and Medalist Rating.
A Dynamic Approach
Starting in the third quarter of 2023, a selection of the strategies covered by analysts will move to dynamic coverage and will be reviewed using the process described above every two years. Every other year, the analyst will gather appropriate data and complete a checklist to confirm there were no material changes to the team, process, portfolio, or performance. Strategies that pass this checklist review process will receive reaffirmed People and Process pillar scores from the Ratings Committee, extending the validity of the published Managed Investment Reports until the next full review. Strategies that do not pass this review will move to a full review, and Ratings Committee members may request a full review if conditions warrant.
Analysts will regularly monitor data for all strategies under coverage that might trigger a full review before expected deadlines, including but not limited to manager or team changes, significant process, portfolio, or performance changes, flows, or other developments.
The Morningstar Manager Research Coverage Committee will revisit the dynamic coverage list on a quarterly basis and make updates as conditions warrant. Asset managers will be notified in the normal course of the review cycle.
One of our most popular research publications is the Morningstar Australia and New Zealand Best Stock Ideas report. As the title indicates, it is a monthly repository of our analysts’ key investment recommendations in the equities space. They are not just any cheap, cigar-butt stocks. Rather, these undervalued Best Idea stocks have been screened for quality considerations, such as competitive position or economic “moatiness”, in Morningstar’s parlance, even if not all of them are moat-rated by our analysts.
These Best Ideas are sourced from all main sectors of the market, to provide a diversity of names across the spectrum. The last thing investors want is a Best Ideas list chock-full of cheap mining stocks when commodity prices tank, or a litany of oversold retail stocks when consumer sentiment slumps.
Exhibit 1 shows these Best Ideas from the recent July 2023 edition—13 companies whose shares are trading at decent discounts to their intrinsic values, based on our assessments of their maintainable, mid-cycle earnings and returns.
Exhibit 1: Morningstar Best Ideas for Australia and New Zealand (ranked by discount to fair value)
Source: Pitchbook, data as at 24 July 2023
We will not dwell much on this Australia and New Zealand publication which is updated at the beginning of each month. But did you know Morningstar also has Best Ideas for stocks listed on the American, Asian and European markets?
As Exhibit 2 shows, Australia and New Zealand represent just 2% of the global equity market capitalisation. They are smaller than a whole host of countries in the “Other” bucket, including Canada, Switzerland and Germany. That statistic should at least pique the interest of Antipodean investors filled to their gills with some combinations of four banks, three miners, two supermarkets and a telco, sprinkled with a conglomerate and a biotech listed on the ASX.
Exhibit 2: Australia and New Zealand Markets are almost rounding errors (global equity market country weightings)
Source: MSCI ACWI Investiable Market Index as at June 30, 2023
And for those who are ready to moderate their home bias and broaden their investment horizon beyond the ASX and the NZX, what better way to begin the journey than Morningstar’s Global Best Ideas?
Take Americas as an example, a region encompassing the global market agenda-setting New York Stock Exchange and the pulsating tech-heavy NASDAQ. Morningstar’s 69-strong North American equities team currently has 41 Best Idea stocks in this region, as can be seen in Exhibit 3.
Exhibit 3: Morningstar Best Ideas for Americas (ranked by discount to fair value)
Source: Pitchbook, data as at 24 July 2023
It would be impractical to discuss the merits of every single stock on this list. But let’s cherry-pick a couple, just to highlight the diversity of investment choices on the American bourses. Rather than bemoaning about the lack of quality technology stocks on the ASX, Morningstar America’s Best Ideas offer moat-rated alternatives such as Teradyne (NASDAQ: TER) and Cognizant Technology (NASDAQ: CTSH).
The former is a wide moat-rated chip-testing bellwether with a sizable research and development budget to produce top-tier automated test equipment, including those for industrial automation. Granted, the group is suffering from near-term cyclical weakness in chip manufacturing. However, it boasts a leading market share, superior profitability than peers and strong customer relationships, all owing to the sheer breadth and depth of its capabilities across many chip types and end applications.
As for Cognizant Technology, it is not just a small, run-of-the-mill IT services provider. Instead, the company is a major player leveraged to the digital transformation wave sweeping across organisations globally, a phenomenon accelerated by the COVID-19-induced imperative to be more efficient, using the power of digital technology.
Shares in both entities are undervalued relative to our analysts’ fair value estimates. They are certainly preferable than the limited number of overvalued Australian technology stocks, or the ragtag bunch of dreadful penny stocks masquerading as such, on the ASX.
Similarly for Europe, Morningstar’s Best Ideas list is full of companies for those wishing to gain exposure to stock markets almost 10 times bigger than Australia and New Zealand, as can be seen in Exhibit 4.
Exhibit 4: Morningstar Best Ideas for Europe (ranked by discount to fair value)
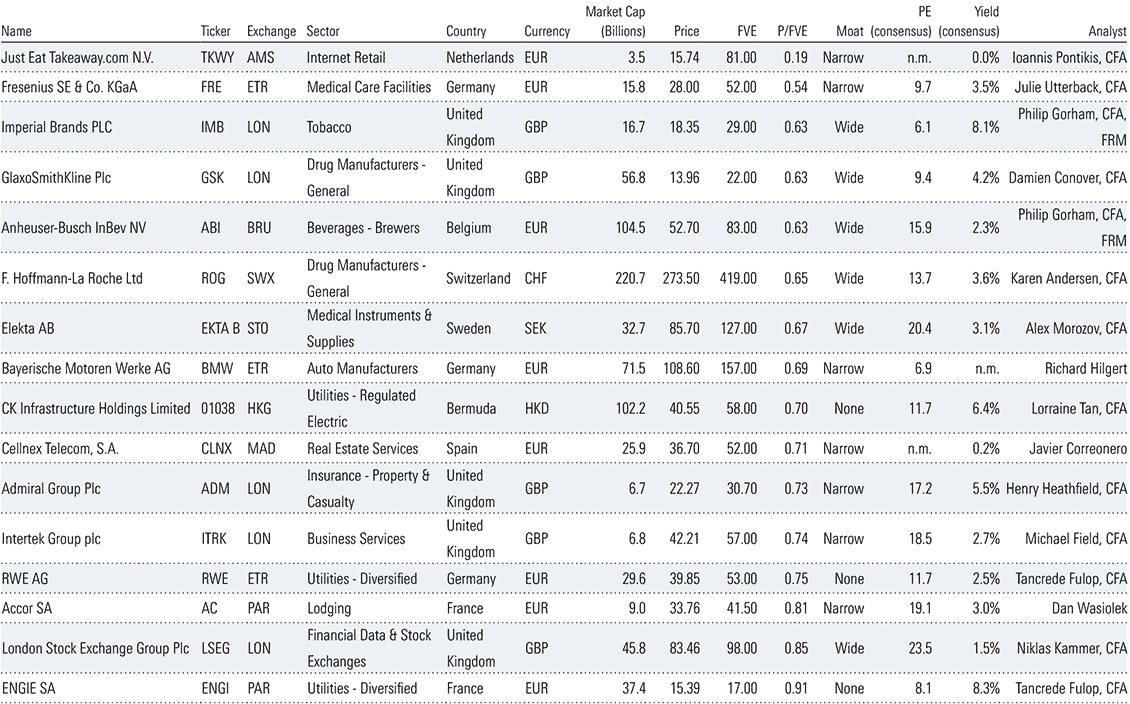
Source: Pitchbook, data as at 24 July 2023
For instance, have you ever used your Accor loyalty card to book a Sofitel hotel room and were so impressed with the experience you wondered whether you can buy shares in the company? Well, you certainly can! In fact, the Paris Exchange-listed Accor (PAR: AC) is one of Morningstar’s Best Ideas in Europe. Not only is the group leveraged to the continuing post-pandemic recovery in global travel activities, but its brand name encompassing Raffles and Sofitel (luxury), Pullman and Swissotel (premium), Mercure and Novotel (midscale), ibis and BreakFree (cheapskates), furnishes Accor with a competitive advantage so durable Morningstar has assigned it a narrow economic moat rating.
Furthermore, have you ever sipped on a Corona (the beer, not the virus) while lounging at an Accor hotel poolside and wondered whether you can buy shares in the company responsible for the beverage? Well, you can do that too! Because Corona is one of 500 beer brands made by Belgium-based Anheuser-Busch InBev (BRU: ABI), whose shares are cheap according to our analyst. The company boasts dominant market positions and maintainable cost advantages, especially in developing markets such as Africa and Latin America.
And then there is Asia. Investors Down Under are acutely aware of the region’s critical role in driving the intrinsic values of many companies listed on the Australian and New Zealand exchanges. But Asia also has a significant investment universe of its own, underpinned by a staggering population base yet to reach its economic potential (see Exhibit 5).
Exhibit 5: Asia’s massive population and economic upside present opportunities for investors
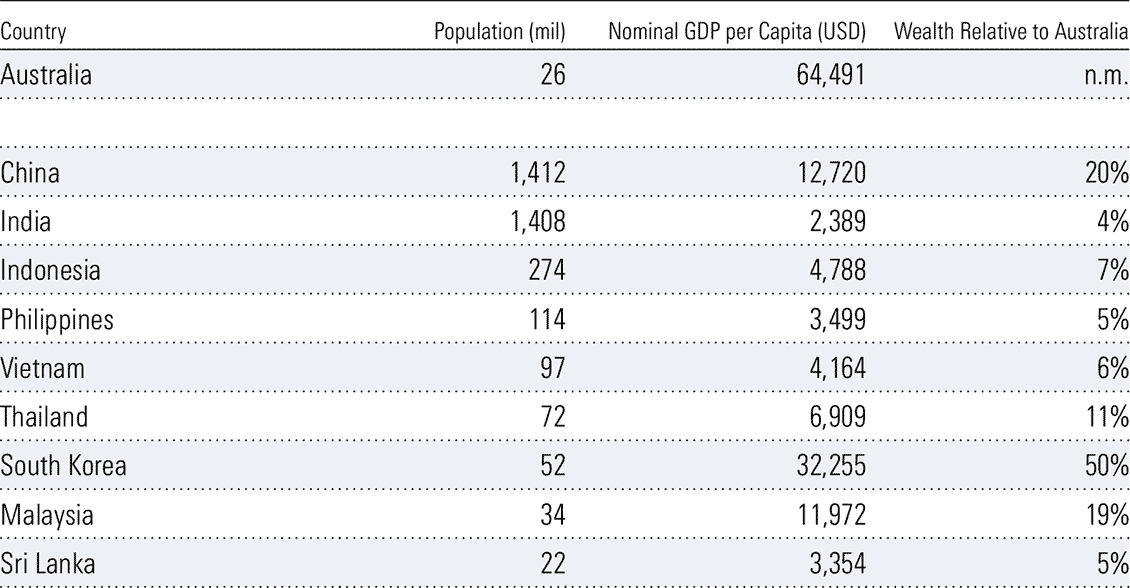
Source: World Bank, World Development Indicator, dated 29 June 2023
Even more compelling, Morningstar calculates its Asian coverage to be 15% below fair value estimates at current levels, compared to 7% for our Australia and New Zealand coverage.
So, for those interested in delving into this fertile and cheap Asian market, what better place to start than Morningstar’s 12 Best Idea stocks in the region, as shown in Exhibit 6?
Exhibit 6: Morningstar Best Ideas for Asia (ranked by discount to fair value)
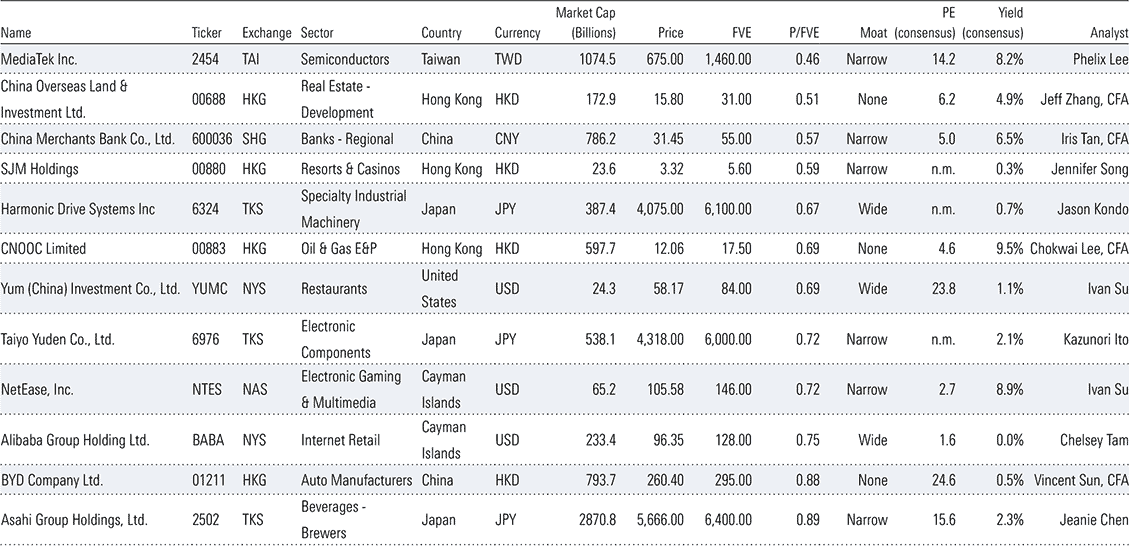
Source: Pitchbook, data as at 24 July 2023
Take China Merchants Bank (SHG: 600036) as an example. The narrow moat-rated entity, with a US$100bn-plus market-capitalisation, has a leading market position in the Chinese retail banking space and is making significant inroads into wealth management. The bank has industry-leading return on equity due to its asset-light business model, a position our analyst believes is maintainable, particularly given its premium customer base, prudent loan underwriting, and comparatively low funding costs. At the current discount to Morningstar’s fair value estimate, it is certainly worth investigating for Australian investors inextricably tied to the fortunes of the four Australian major banks who are, reciprocally, dependent on the housing loans of these very Australian investors, all swimming in a 26-million population pond.
Another Asian Best Idea stock is China Overseas Land and Investment (HKG: 688). While this real estate company may not have durable competitive advantage in the fiercely contested and highly fragmented Chinese property development space, it has been one of the few to achieve market share growth in recent periods from focusing on landbank quality upgrades and opportunistic acquisitions. The company has significant exposure to wealthier cities in China, and is well positioned to benefit from the ongoing recovery of homebuyer sentiment which our analyst believes will be more resilient in these higher-tier areas.
All this, of course, is said in the context of general advice. And the few Best Idea names discussed were randomly selected to highlight the diversity of investment choices. We have no insights into anyone’s individual circumstances, as our compliance colleagues forever remind us, and as all the disclaimers in our reports remind the readers. When it comes to direct investing in overseas markets, there are also regulatory, currency and country-specific nuances each investor must consider.
However, broadening one’s investment horizon and learning about the fascinating companies listed overseas is, at the very least, an intellectually stimulating exercise. The enriched perspectives may even improve one’s chances of investing success in the Australian market, beyond navel-gazing at the Banks-Resources barbell on the ASX, and fussing about franking credits, property prices and mining magnates’ lavish lifestyles.
And if you do decide to venture overseas to find investment opportunities, you are likely to be met with a dizzying array of choices in numerous markets. But, as a Chinese proverb says, a journey of a thousand miles begins with a single step. You could do worse with the first step than Morningstar’s Best Ideas concept.
In part one of the series the bar going investors learned the following crucial lessons:
- Investing for the long term and staying the course is a key tenet to achieving wealth generation objectives.
- The compounding effects over long periods of time can be phenomenal.
- The possibility of negative returns diminish as the time horizon gets longer.
- Historically, Mr. Market has proved to deliver positive returns over long periods of time, despite his unpredictable temperament on any day—companies invest for growth and require time to deliver value to shareholders. Successful companies generally become larger over time, and the ones that fail are taken out of the market.
“People who invest make money for themselves; people who speculate make money for their brokers.” Benjamin Graham, The Intelligent Investor
Back to the bar in 1992, with Annie, Bridget, Charlie, Don, and Mr. Market.
It’s December 1992, and armed with these insights, the four investors wanted to understand from Mr. Market how to time the market better. They wanted to understand what they could do in terms of their buying and selling decisions through time that would produce better results.
Mr. Market’s intriguing proposition to the four investors.
- Mr. Market proposed a 30-year competition to the investors. The rules would be simple.
- Annie, Bridget, Charlie, Don, and Mr. Market each start on $100,000 as a lump sum.
- Everyone has $1,500 per month as an additional discretionary amount to invest into cash or the market.
- The investors simply had to choose a rules-based approach, based on their personalities, to buy/sell for the 30 years.
- The rules-based strategy is used more for giving the investors some sort of discipline in terms of their actions with the markets. This is similar to well-rated fund managers who apply process-driven approaches consistently.
- After 30 years, they would look at their investment balances to see who won.
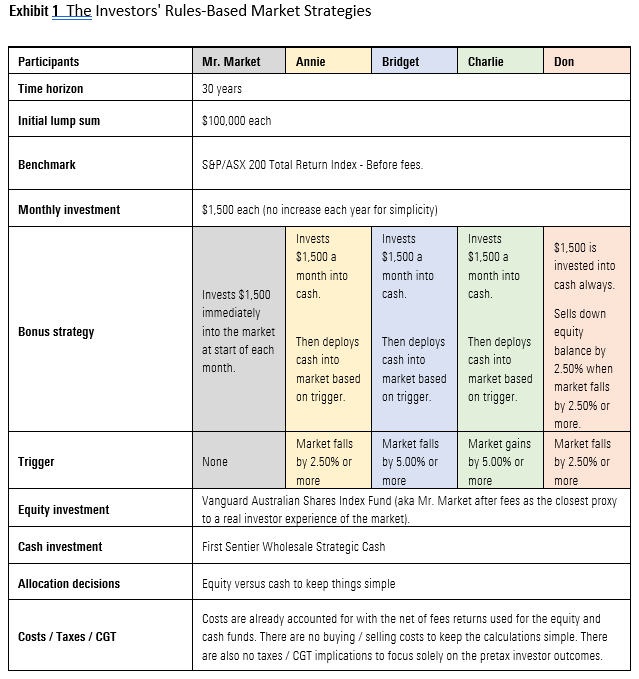
Assumptions about the future
Remember, these humble investors were not able to make any prognostications about the world and how it would change and take shape. The scenarios and settings for the future were too open.
They didn’t have mobile devices by which they could monitor the market like today’s high-frequency traders. They opened the physical newspaper daily to look at stock performances, watched the news, and stood by their fax machines, which were in vogue.
They could not imagine the scale of China’s growth into prominence, though Paul Keating’s 1993 Australia Day address would show awareness of Australia’s economy being dependent on Asia.
The flow of information and the world were a lot slower. Intel had just launched the Pentium processors, Bill Clinton was president of the USA, and the European Union was being formed.
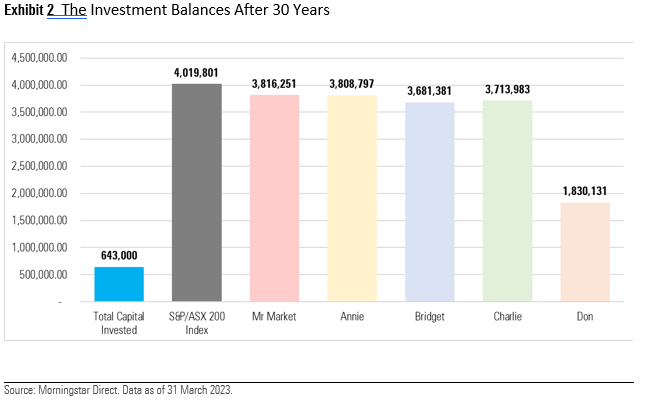
So, who is the winner?
The winner of the competition was Mr. Market (aka the Vanguard Australian Share Index Fund). None of the investors were able to beat the S&P/ASX 200 Index or Mr. Market. Vanguard was shown as it’s the closest proxy for Mr. Market after fees for the everyday investor.
Naturally, the Vanguard fund would always lag the index because of the fee layer and a small cash drag accumulating over time.
It is also noted that some of the fee layers in funds management have closed significantly compared with what they were in 1993. According to Morningstar’s data, the fee for the Vanguard Australian Shares Index fund was 0.33% per year in 1998, and it has dropped to 0.16% per year currently.
Annie was very close in second place, followed by Charlie and then Bridget. They were all within $45,000 of the Vanguard balance after 30 years.
Don was the investor who had the lowest investment balance after 30 years.
So, why couldn’t the investors outperform the Vanguard fund (aka Mr. Market after fees)?
Remember, the four investors had their own triggers and actions that were repeated in the market over the course of 30 years.
- The only element of cash flows that were moving in or out of the market was their $1,500 investment monthly. The $100,000 lump sum can be thought of as the initial saving, while the $1,500 monthly investment was their monthly saving from a salary or elsewhere. The $1,500 per month was not enough to “move the needle” in the overall portfolio when taking advantage of market declines.
- The simple reason for all of the investors not being able to beat the Vanguard fund (aka Mr. Market after fees) was that, while they were accruing cash to take advantage of a selloff, Mr. Market was always fully invested. Their returns were being diluted over time, even if marginally, because of being out of the market.
- Annie, Bridget, and Charlie did fairly well with their strategies of buying when the market fell but were still fell short of Mr. Market at the end of the 30 years. Their cash balances accrued while they waited for their respective triggers to buy into the market. In that time, the market was still compounding upward.
- Don was the extreme example of the nervous investor. Every time the market fell, he sold his position downward for fear of further declines. And he was unable to buy back into the market.
A key question is: Which investor are you?
- What is your strategy toward the market?
- Are you proactive or reactive?
- What were your actions in your portfolio during market selloffs or high points?
But wait, there’s one more thing…
How would an investor have done over the 30 years if they were fortunate enough to have invested the total capital of $643,000 as a lump sum?
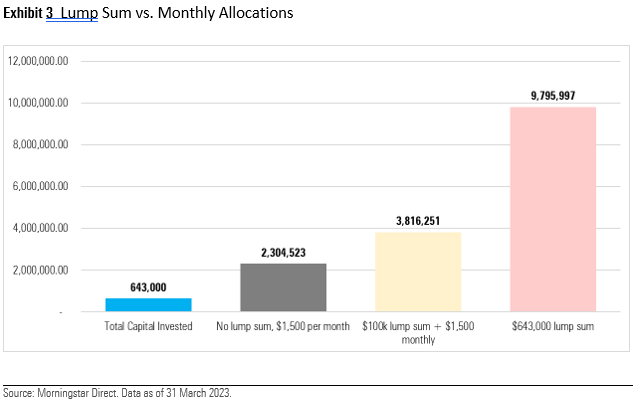
Key takeaways
- The key and clear conclusion from this is that time in the market matters more than timing the market. The compounding results over 30 years were phenomenal. We have no certainty of a repeat of the previous 30 years’ performance over the next 30 years, though to paraphrase an unknown author of a famous quote, “It does often rhyme.”
- Most people do not have the ability to invest significant lump sums initially, so most investors are dollar-cost averaging when they have a monthly investment.
- Any additional windfalls along the way should be viewed as a lump sum that can be added in to have a longer time in the market.
- It is exceptionally important for investors with mindsets toward the markets to note the significant implications of these results.
Introduction
One of the better economic aphorisms is “a rising tide lifts all boats”, which suggests a growing or expanding economy will benefit all participants and so economic policy, particularly that of government, should focus on the big picture rather than pork barreling. If only.
Berkshire Hathaway’s Warren Buffett added—“only when the tide goes out do you discover who’s been swimming naked”.
So as the economic tide ebbs, those skinny dippers are likely to be exposed during the latter half of 2023 and into 2024. They comprise households, companies, and lending institutions, including the buy-now-pay-later (BNPL) cohort. Lending borrowers six times stated income at the bottom of an interest rate cycle, when rates were at historical lows means there will be casualties. The credit providers and borrowers in the Grand Daddy of Australia’s BNPL market—the home mortgage market—will also be impacted. It is the epitome of BNPL!
After aggressive monetary policy tightening programs of global central banks, the skinny dippers’ wake should now be in full swing. Many forecasters predicted a year ago a recession was likely in some form during 2023. New Zealand has experienced a technical recession with negative consecutive quarterly GDP readings of -0.7% and -0.1% for 4Q22 and 1Q23, respectively. So has the Eurozone. Most other developed world economies have so far avoided an extended contraction, although Germany teeters.
The massive fiscal stimulus packages of 2020 and 2021 swelled household savings as the pandemic shutdown economies. Severe restrictions and lockdowns to stop the spread of the COVID-19 virus severely limited spending options. Delta and Omicron variants extended inconveniences well into 2022. China only fully relaxed restrictions in January 2023.
Exhibit 1: Markets Snapshot 30 June 2023
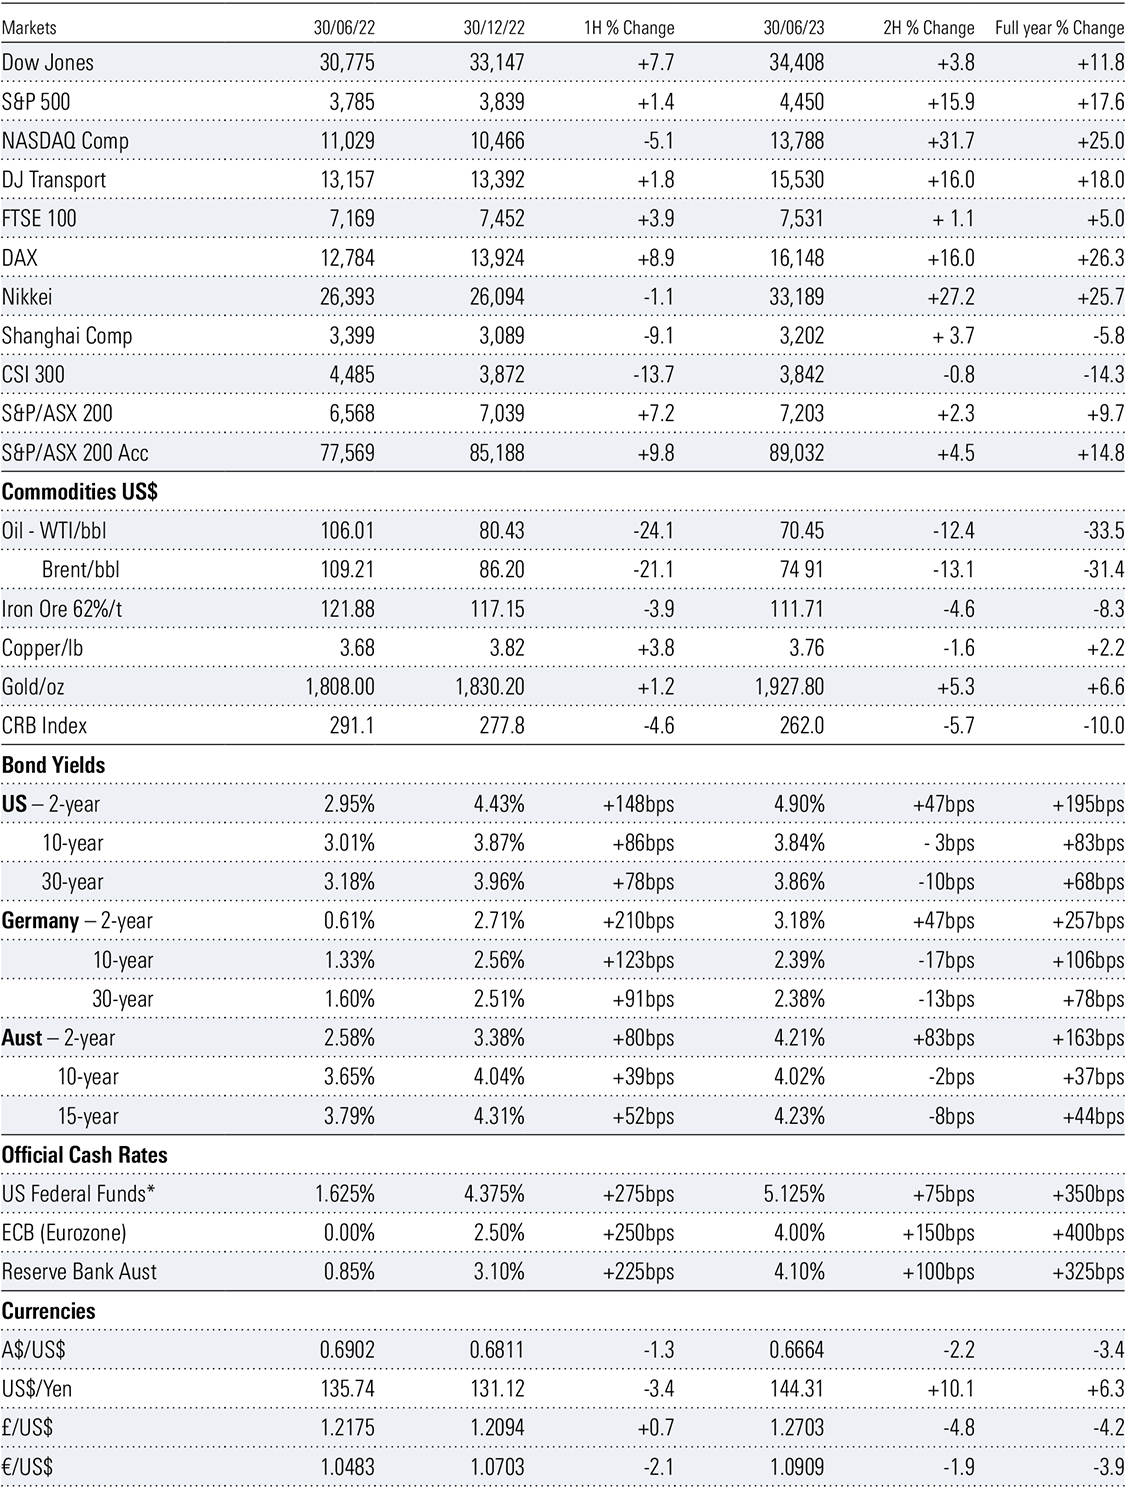
*Midpoint of range.
Source: Morningstar
In addition to fiscal largesse supporting households, the demand for goods and services from a corralled population, except for travel and hospitality, saw a strong rebound in job creation and sent unemployment levels to record lows.
Meanwhile, due to the most accommodative monetary policy settings in history, zero-bound interest rates became the norm. Negative bond yields also became commonplace. The financial system was awash with liquidity and its price at bargain levels.
Global central banks from as far north as Scandinavian Norway to the southern antipodes of Australia and New Zealand have been on a year-long monetary tightening exercise to halt the march of the inflationary army. While there have been varying degrees of success, most of the wins have come from the supply side, as supply chains have freed up from widespread pandemic disruption and labour forces have resumed to a more normal work environment. Monetary policy has little or no impact on supply-side issues.
Developed economies are still fighting a battle against inflation, particularly in the services sector. With the impact of aggressive monetary policy tightening having been delayed, financial markets are climbing a wall of worry dotted with obstacles, including a sharp fall in consumer spending, as the full extent of the past year’s rate hikes adds to the toll of meaningful increases in cost-of-living expenses sapping consumer confidence and savings.
Uncertainty surrounds the outlook for household consumption and the knock-on effect to corporate cash flows and profitability should not be underestimated. Rising unemployment is likely as companies trim operating costs to protect margins. The impact of the mortgage cliff is much greater in Australia with the short three-to-five-year tenure of fixed loans. In the US, 30-year fixed loans are the norm and consequently the added demands on household disposable income from rising interest rates is significantly diluted.
The central banks are nearing the end their respective rate hike programs. One, perhaps two more increases are likely before time is called. Markets will then start looking for the first signs of a cut. With core inflation unlikely to return to respective target levels until late 2024–mid 2025, significant cuts are unlikely in 2024. There is a paradigm shift. Gone are the days of zero-bound interest rates and hopefully another unforeseen event will not see a repeat of the recent fiscal flood. Simply put, the situation will normalise.
Recall, Australia’s average official cash rate between 1990 and 2023 is 3.85%, just 25-basis points below the current mark. The average US federal funds rate between 1971 to 2023 is 5.4% against the current mid-point of 5.125%. History will show the period between 2020 and 2022 was an aberration. Get used to the normalisation of the economic cycle, probably starting in 2024.
Exhibit 2: Australia interest rate (%)
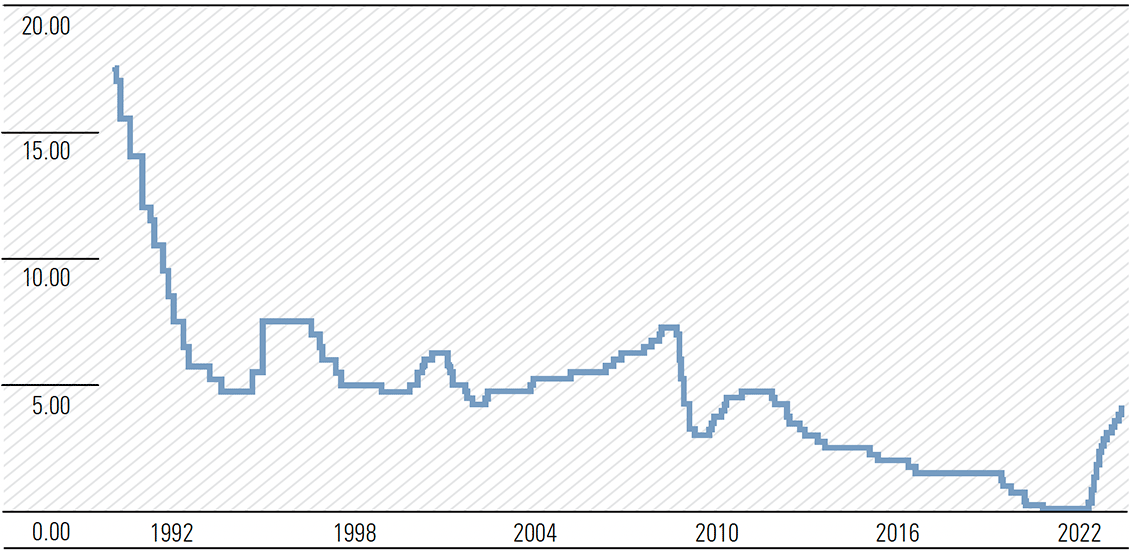
Source: www.tradingeconomics.com, Reserve Bank of Australia
The reward for reaching the summit of the Wall of Worry—1st: A Soft Landing/Mild Recession; 2nd: A period of stagflation, possibly extended.
AUSTRALIA
Challenges ahead as the economy starts to normalise
The Australian economic tide has been ebbing since late 2022 and the contraction in economic activity is likely to continue well into the June half of 2024. GDP growth slowed to 0.2% in the March quarter from the December quarter of 2022, with the annual rate to March at 2.3%. There will be at least one negative quarterly reading in 2023, probably the September quarter, although a line ball reading is likely in the June quarter. A technical recession is a distinct possibility before the June quarter of 2024.
The outlook for household consumption, which is the largest contributor to GDP, is the major influencing factor. Interest rate hikes of the past and likely further increases, combined with the refinancing of ultra-low fixed rates to current elevated levels will meaningfully reduce the disposable income of indebted households. It will not stop the well-off or the debt-free from spending and holidaying. The 80/20 rule is working—mortgagees and renters representing most of the 80%.
We forecast growth in household consumption of less than 0.5% in 2023 and below 1% in 2024, with a negative reading probable in the June half of 2024, before a recovery in the December half. On a more dire note, on a per capita basis, we anticipate recession in both household consumption and GDP growth in both 2023 and 2024.
Helping to offset a subdued household consumption contribution, both business investment and government spending are expected to be supportive of GDP, underpinned by meaningful energy transition-related infrastructure. Investment in affordable housing is likely to start contributing later in 2024, at the earliest. Skilled labour shortages will remain an issue.
So far, the fall in housing prices from sharply higher interest rates appears to have run its course, limiting the downside impact of a falling ‘wealth effect’, with a housing shortage and sharply increased immigration offsetting factors.
Inflation remains a concern. The monthly CPI indicator for year to May was a belter, rising 5.6%, well below expectations of 6.1% and down sharply from April’s equally surprising 6.8%. The market reaction was positive, with both equity and bond prices rising, yields falling. The rises appear somewhat short-sighted. While it may have influenced the Reserve Bank (RBA) to pause or skip on 4 July, it does not mean the central bank’s rate hiking journey is over. Services inflation is not dead, far from it.
Unemployment is forecast to rise in the December half of 2023 and into 2024 from the current 3.6%, possibly reaching 5% by end 2024. The lack of any improvement in labour productivity will remain a drag on GDP growth in the near term. The RBA’s assistant governor recently suggested the unemployment rate would need to lift to 4.5% if the trimmed mean inflation target range of 2–3% by mid-2025 was to be achieved (Exhibit 3). This also assumes the participation rate remains at a record 66.9%. It looks optimistic.
Exhibit 3: Labour market outcomes* (%)
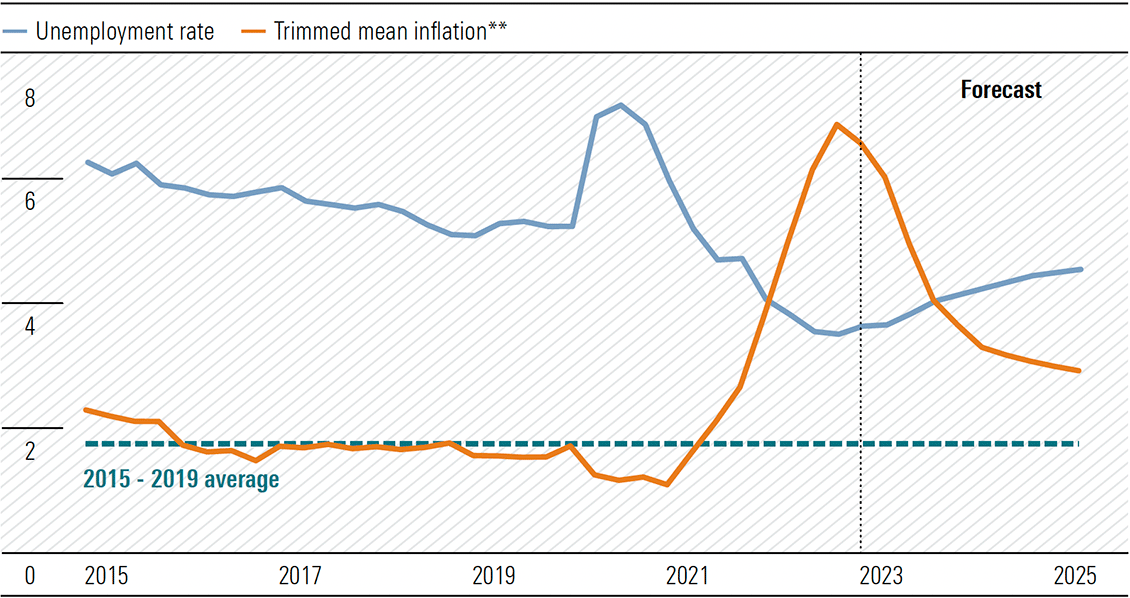
*Forecasts are as at the May 2023 Statement on Monetary Policy. **Year-ended. Sources: ABS, RBA.
The RBA’s Financial Aggregates released on 30 June reveal a continued slowing in credit growth in May, extending the deterioration to seven consecutive months since October 2022. Credit provides the leverage to the economy. It reflects the level of confidence of both household and business sectors and is a reliable indicator of future economic activity. Expanding credit growth signals increasing confidence, declining credit growth the opposite.
Exhibit 4: Financial Aggregates – percentage change
Source: Reserve Bank of Australia
Therefore, it was not surprising the National Australia Bank’s (NAB) Monthly Business Survey for May revealed worrying signs of slowing activity. There were notable declines across the trading, profitability, and employment sub-sectors, with the fall in conditions accelerating. While marginally ahead of the long-run average, results are considerably below those of early 2023.
Business confidence fell to -4, with most industries in negative territory. Forward orders were sharply lower reflecting slowing demand and particularly evident in the consumer sector. Retail and wholesale are the weakest of all industries. Remember, household consumption is the most important contributor to GDP, underpinning 60–65% of the total monetary value of all finished goods and services produced in the economy.
While the Westpac-Melbourne Institute Consumer Sentiment Index is showing signs of bottoming around the lows reached in 2022, and those of the late 1980s-early 1990s recession, it is hardly a reason to break out the champagne. The index edged marginally higher from 79 in May to 79.2 in June. The survey was taken between 5–9 June and while improvement is encouraging, there was a sharp decline in confidence from respondents after the RBA’s rate hike on 6 June. Clearly, the surprise element in the timing of the increase and the subsequent hawkish tone of RBA governor Philip Lowe’s commentary hit home.
Additionally, there was a meaningful lift in unemployment expectations, with the sub-index increasing to the highest level since September 2020. Given the traditional lag effect, the unemployment rate could move sharply through 4% by early 2024.
Exhibit 5: Unemployment expectations rose sharply
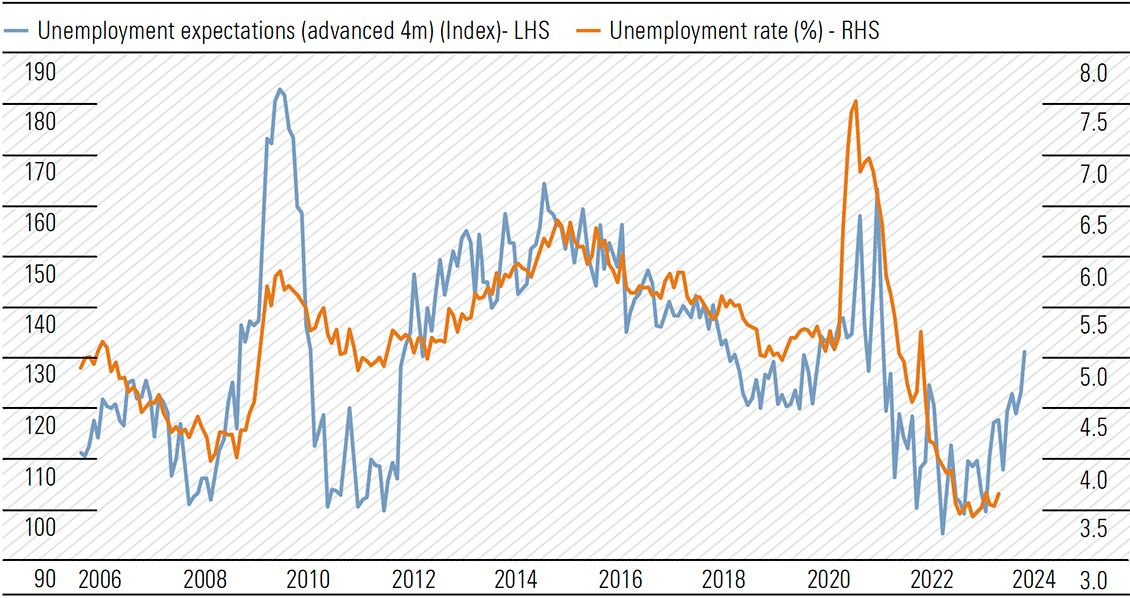
Source: National Australia Bank, Macrobond
Both the NAB and Westpac surveys frank the credit growth deterioration evident in the RBA’s Financial Aggregates.
On the doorstep of the mortgage cliff
At the bottom of the interest rate cycle and with the RBA governor proclaiming interest rates will not rise until 2024 at the earliest, the demand for fixed loan mortgages soared. The favourable interest-rate conditions drove fixed-rate mortgages as a proportion of new lending to a peak of 46% in July 2020. RateCity research reveals the big four banks have over $150bn of fixed rate loans requiring refinancing between July and December 2023. Currently, around 40% of all mortgage loans taken out between 2020 and 2021 are fixed, some were secured below 2%. The honeymoon is about to turn into a nightmare.
While these fixed loans are not a large portion of the bank’s mortgage loan portfolios, the pain will affect bank credit impairments, while net interest margins are already under pressure. And pressure from another source is also on the way.
At the height of the pandemic, the RBA introduced two major policy responses, the Yield Curve Control (YCC) asset purchases and the Term Funding Facility (TFF). The latter was established to offer low-cost three-year funding to authorised deposit-taking institutions (ADIs) and had two objectives:
- to reinforce the benefits to the economy of a lower cash rate, by reducing the funding costs of ADIs and in turn helping to reduce interest rates for borrowers;
- to encourage ADIs to support businesses during a difficult period, ADIs could access additional low-cost funding if they expanded their lending to businesses. The scheme encouraged lending to all businesses, although the incentives were stronger for small and medium-sized enterprises (SMEs).
The total available under the TFF was $213bn of which $188bn was drawn down. The big four banks collectively drew $133bn, $63bn in the initial allowances at 0.25% and $70bn at 0.10% in the supplementary round. These were three-year loans, the initial allowances maturing on 30 September 2023 and the supplementary on 30 June 2024. They did not require any marketing expenses and presumably no capital was invested when TFF funds were on-lent. It is likely net interest margins have been supported to some extent since 1 July 2020.
On 30 September 2023, the big four will have to repay $63bn to the RBA and on 30 June 2024 $70bn. The banks will need to invest equity on a risk-weighted basis and fund the remainder via retail/business deposits and the wholesale market. The transition could be an interesting spectacle.
Between now and 30 September the four major banks will be corralling $63bn—Commonwealth Bank $19.2bn; Westpac $17.9bn; National Australia Bank $14.3bn, and ANZ $12bn. This is not an insurmountable task but will have margin implications. On 19 June, Westpac priced 5-year and 10-year Tier 2 hybrids at 6.5% and 6.9%, respectively. That is a long way from the 10–25-basis points of the TFF loans provided by the RBA.
Markets likely to struggle
In the September quarter (3Q23), the domestic market is likely to be focused on the FY23 results season. Some 170 companies in the S&P/ASX 200 index will report. Results must be lodged before close of business on 31 August and the outlook statements will be critical and closely monitored.
Attention will also focus on key domestic economic data including inflation, labour force, and retail sales, monitoring the pulse of household spending. The inflation readings for the June quarter and Monthly CPI Indicators for July and August along with monetary policy decisions of the RBA on 8 August and 5 September are likely to influence the market performance.
Economic growth slowed from 0.6% in the December quarter 2022 to 0.2% in the March quarter 2023. We expect further weakening in the June quarter and a contraction is on the cards for the September quarter. Consumer sentiment has collapsed (Exhibit 6) and against this backdrop, corporate profit growth will have slowed in the June half, particularly in the sectors reliant on household spending. Price rises have lagged the rate of cost increases, putting margins under pressure, while volume growth has also declined as households tighten belts.
Exhibit 6: Consumer Sentiment* average since 1980 = 100
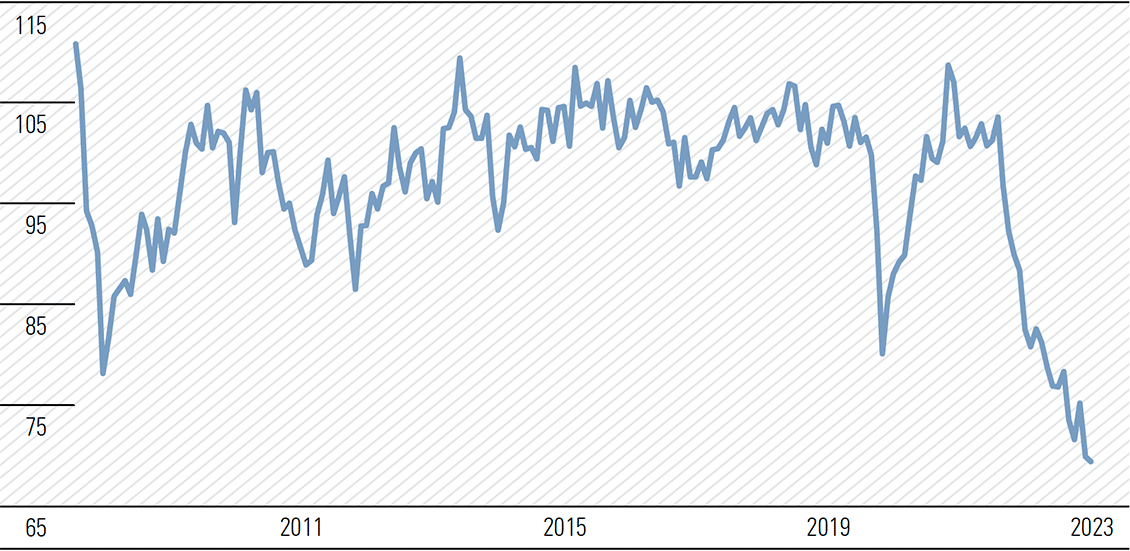
* Average of the ANZ-Roy Morgan and Westpac-Melbourne Institute consumer sentiment measure of respondents’ perceptions of their personal finances relative to the previous year; ANZ-Roy Morgan index rescaled to have the same average as the Westpac-Melbourne Institute index since 1996.
Sources: ANZ-Roy Morgan; RBA; Westpac and Melbourne Institute.
As rising interest rates increase debt servicing commitments, the disposable income of indebted households is under pressure. The savings buffer from massive fiscal stimulus programs in 2020 and 2021 has depleted quickly (Exhibit 7) and household consumption is being curtailed. Discretionary retailers are feeling the pinch and the online channel, which has a greater proportion of impulse spending, appears to be suffering most.
Exhibit 7: Household income and consumption* (%)
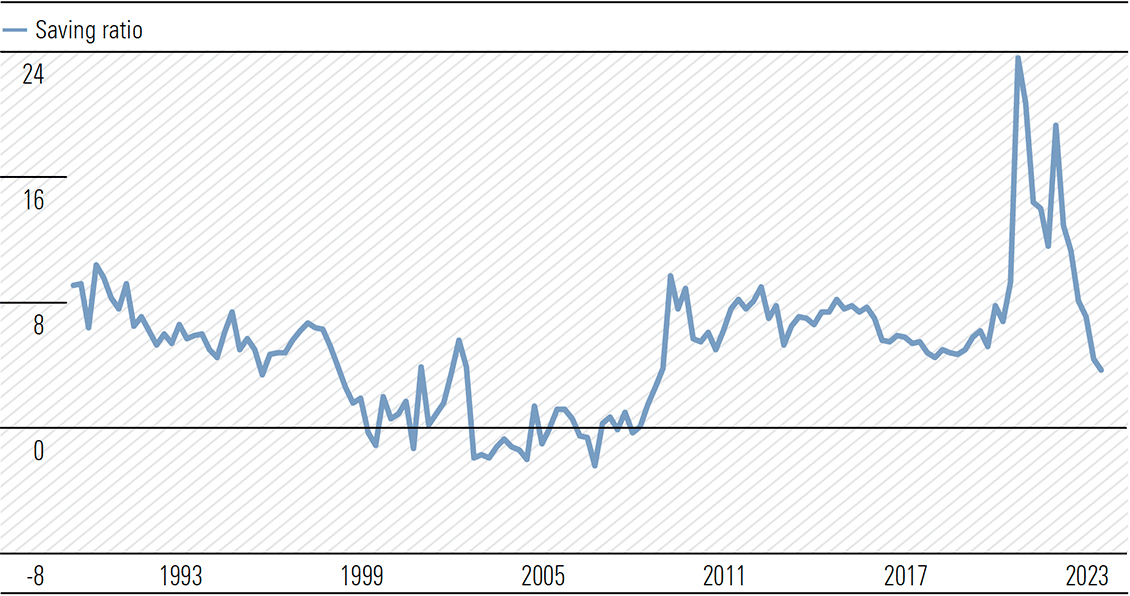
* Household sector includes unincorporated enterprises; disposable income is after tax and interest payments; saving ratio is net of depreciation.
Sources: ABS; RBA.
Financial Services and Basic Materials represent 50% of the Australian share market benchmark index, the S&P/ASX 200. Given the high level of concentration, where these sectors go, so goes the Australian market. Financial Services is dominated by the four major banks. BHP is the lighthouse of Basic Materials.
Despite the boost to interest income from rising interest rates, bank net interest margins are under pressure from the higher cost of funds in both the wholesale and retail markets, as bond yields remain elevated, and depositors demand higher rates. While, well provisioned, the banks will experience rising credit impairments. Sluggish commodity prices are having an impact on the revenues of resource and energy companies, while inflation pushes costs meaningfully higher. Focus will be on the extent and effect of Chinese stimulus.
The outlook for fiscal 2024 is for moderating growth in corporate profitability. In many cases earnings may decline as household consumption growth stalls and could well contract in the current half to December 2023.
Technology was the best performing sector in the year to 30 June 2023 with a 27% gain as Australian companies were caught up in the AI mania. The sector was led by WiseTech which is now the 16th largest Australian company by market capitalisation, Xero, and Technology One. The performance of the sector hardly moved the needle of the S&P/ASX 200. The total market capitalisation of the three companies is just shy of $50bn (US$33bn). To put this in context, Apple has authorised another US$90bn share buyback for 2023 after completing repurchases of US$90bn in 2022.
We expect a subdued market performance in the current quarter, although July is traditionally a stronger month as funds are reallocated for the new financial year. After a 9.7% lift in the year to 30 June 2023, the S&P/ASX 200 is not expected to break meaningfully above 7,500 before June 2024, but a move to the downside around 7,000 would not surprise.
UNITED STATES
Markets looking toppy, particularly the techs
The almost cult-like following of all things embracing artificial intelligence has propelled US markets in the six months to 30 June. The Nasdaq Composite soared almost 32% in contrast to the near 16% of the S&P 500 and a pedestrian 3.8% of the Dow Jones Industrial Average. Morningstar’s Chief US Market Strategist David Sekera now asks, ‘Time to batten down the hatches or raise the sail?’
According to a composite of the over 700 stocks we cover that trade on US exchanges, as of 26 June, the US equity market was trading at a price/fair value of 0.95, representing a 5% discount to our fair value estimates.
Growth stocks have risen 23.4% year-to-date, well outperforming the 13.2% increase across the broader market. As such, the growth category is now trading near fair value, whereas it was the most undervalued style at the beginning of the year. At this point, investors appear best positioned by overweighting the value category and underweighting core and growth categories, both which are trading near fair value.
Large-cap stocks have also outperformed this year, rising 16.0%, and are now trading slightly closer to fair value than the broader market. Mid-cap and small-cap stocks both remain at much greater discounts to fair value.
Looking ahead, we expect the rate of economic growth will slow sequentially in the third and fourth quarter then bottom out in the first quarter of 2024. While we continue to view the broad market as undervalued, between slowing economic growth, tight monetary policy, and reduced credit availability, we suspect the rate of market gains will be limited over the next few quarters.
Sekera suggests it is time to underweight the overvalued technology sector. It will be interesting to see the outcome should exchange traded funds also heed his advice and head for the door.
The stock market rally has been unusually concentrated this year. According to an attribution analysis of the Morningstar US Market Index, the returns from only seven stocks account for almost three quarters of the total market return thus far this year. The seven stocks—The Magnificent Seven—are Apple, Alphabet, Amazon, Meta, Microsoft, Nvidia, and Tesla.
Excitement surrounding the emergence of artificial intelligence, specifically natural language processing tools, such as ChatGPT, drove stocks significantly higher for any companies that may stand to benefit from the future implementation of this technology. Who is going to solve the problems when artificial intelligence fails to deliver as promised? I recall the damage synthetic (artificial) derivatives did during the GFC.
With the CNN Fear & Greed Index in Extreme Greed territory and the 2-year/10-year and 2-year/30-year yield curve at the deepest inversion since 1980, the amber lights are flashing.
Housing on the turn
The spring selling season for homebuilders, typically viewed as January-April, was better than expected, with cumulative new home sales declining roughly 10% year-over-year (y/y) compared with a more than 26% decline for existing home sales. New home sales improved sequentially to April, and April sales increased 11% y/y. May was even better, with new-home sales increasing 20%.
Two factors likely explain the relative strength of the new home market. First, homebuilders addressed affordability challenges with sales incentives including base price reductions and smaller floor plans. Second, over 90% of outstanding mortgages have a contract interest rate below 5%, according to the Federal Housing Finance Agency, which discourages listing existing homes. As a result, more would-be buyers are turning to the new-construction market.
Considering the better-than-expected spring selling season, we forecast total housing starts to decline 17% in 2023 to 1.295 million units, with single-family starts 18% lower to 825,000 and multi-family starts down 14.5% to 470,000 units. Previously, we forecast total starts to decline 22%. However, May housing starts were stronger than expected. If this trend continues, there could be upside to our starts forecast
Exhibit 8: We forecast a down year for residential construction in 2023 but see a rebound beginning in 2024 (Thousands of units)
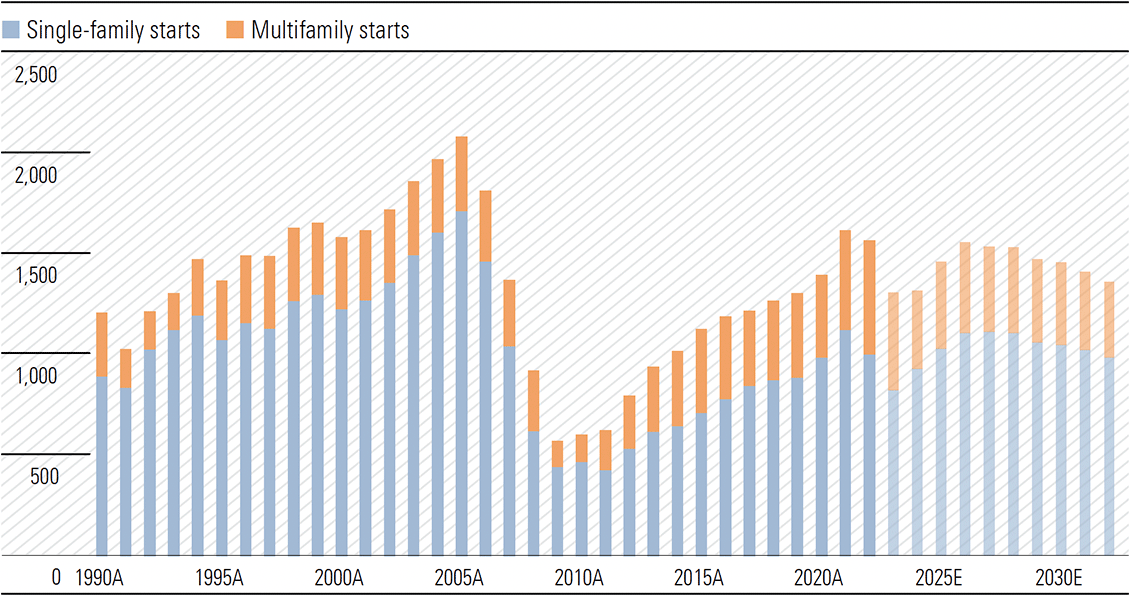
Source: U.S. Census Bureau, Morningstar
We expect housing starts will begin to rebound in 2024 as lower mortgage rates and home prices improve affordability and entice more single-family buyers back into the market. We project housing starts will rebound 1% in 2024 as a 13% increase in single-family starts to 930,000 units is mostly offset by a 20% decline in multi-family starts to 375,000 units. After two years of near-record multi-family construction, we project a step down in 2024 as the market digests the new supply.
However, for 2024–26, we expect high-single-digit growth for both single and multi-family construction, with total housing starts eclipsing 1.5 million units by 2026. Over a longer horizon, we think an annual production pace of about 1.3–1.4-million units is a reasonable assumption.
While we still expect home prices to decline in 2023, recent price resiliency caused us to moderate our price outlook. Based on our forecast sales mix, we expect the median blended home price to decline 3% in 2023. After modest declines in 2023–24, we continue to see home price appreciation returning to the long-run trajectory of approximately 3%–4%. (Brian Bernard Director, Industrials Morningstar Chicago)
Commercial real estate remains an issue
All appears quiet on the regional banking sector after the failures of Silicon Valley Bank and Signature Bank and the bail out/sale of First Republic to JP Morgan. However, there are signs the commercial real estate sector remains in trouble across office and retail.
Reports indicate one in five office buildings are vacant across the country. In San Francisco near 30% of offices are empty. The pre-pandemic vacancy rate was 3.7%.
Walmart is closing half of its eight stores in Chicago where it has failed to make money after 17 years of trying. It is also closing its last remaining stores in Portland. The reason, record breaking thefts.
Investors are shunning the office market and New York’s Manhattan is a bellwether with purchases of US$490m in the March quarter from US$5bn in the same three months of 2022. Year-to-date, the average acre of land sold on Manhattan is near US$68m, down 57% from the same period in 2022 and from US$280m in 2019.
At present there are about US$11 trillion in commercial loans outstanding. With high and growing vacancy rates, landlords become nervous as cash flow dries up and the debt needs to be serviced or the keys are dropped off to the bank. Valuations are under increasing pressure and the sector needs close monitoring. Coincidently, the US$11 trillion in outstanding commercial property loans equals the combined market capitalisations of The Magnificent Seven!
Disturbing
The newly elected president of United Auto Workers (UAW) union Shawn Fain has come out with a barrage of fighting words. “We’re here to come together to ready ourselves for the war against the one and only true enemy: multibillion-dollar corporations and employers who refuse to give our members their fair share. It’s a new day in the UAW … the fighting UAW is back.”
Will this rather aggressive stance have any implications for wage demands?
EUROZONE
Already in a technical recession, Germany next?
This time last year the European Central Bank (ECB) had not raised interest rates. The shape of the German bund yield curve was normal, with the short end yields meaningfully lower than the long end. This was almost six months after Russia invaded Ukraine inflicting a serious blow to the eurozone economy. Consumer confidence was shattering across the region. A year later, the entire German bund yield curve has inverted (see Exhibit 1), and to its most inverted level since 1992. The ECB has also followed other central banks, hiking aggressively and still retains a hawkish bias.
The final Manufacturing Purchasing Managers’ Index (PMIs) for the Eurozone was revised lower from the earlier flash reading of 43.6 to 43.4, at a 37-month low. The final German PMI was revised from 41.0 to 40.6, with S&P Global reporting output and new orders both fell at the fastest rate in eight months. Employment growth is close to stalling as the outlook darkens and factory gate prices fell for the first time since September 2020. “Overall, the PMI data for manufacturing show that a recession in this sector, which was still expanding in the first quarter according to GDP statistics, has become much more likely.”
Meaningfully higher interest rates have impacted Germany’s commercial real estate market with deal volumes slumping 50% in the June half to €14.9bn from the six months to December 2022. Weakness is likely to continue as the ECB’s rate hiking is not finished and falling valuations will increase the likelihood of defaults impacting banks.
The Eurozone weathered the fallout from Russia’s invasion of Ukraine better than most expected. The energy crisis has been well managed. While the economy has experienced a mild technical recession (Exhibit 9), it has avoided a severe contraction feared by many a year ago. Labour markets have remained robust which has helped stabilise consumer spending and economic sentiment has improved. However, inflation remains too high, meaning the ECB has more rate hikes in store. Geopolitical uncertainty remains elevated hampering business investment.
Exhibit 9: Euro area GDP growth rate (%)
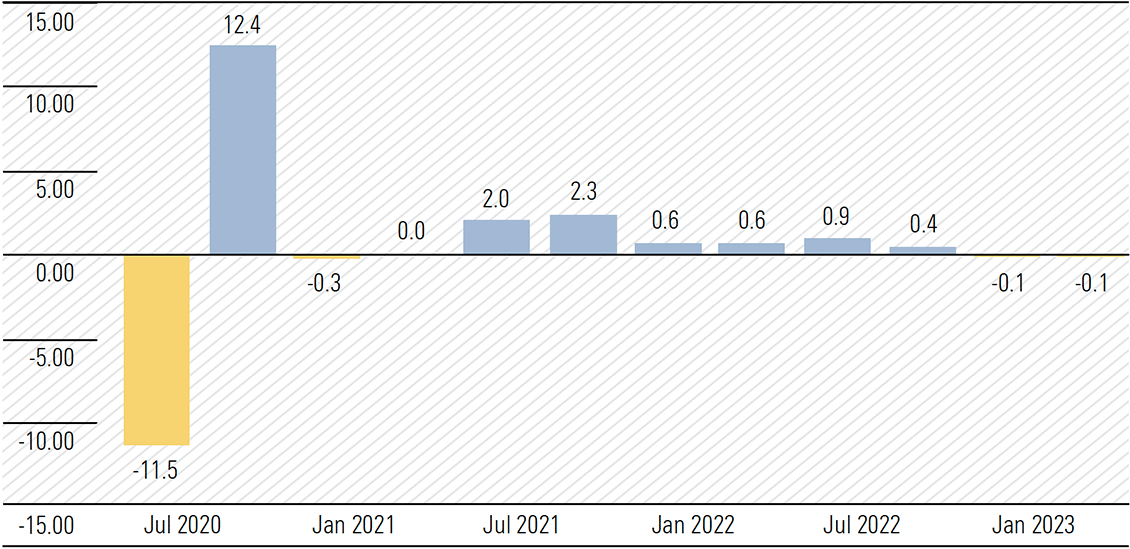
Source: www.tradingeconomics.com, Eurostat
The European Commission forecasts GDP growth of 1% in 2023, which could be a little optimistic, and with inflation running at 6%, which will be a burden. The outlook for 2024 is dependent on foreign demand with hopes relying on the US and China. A period of subdued economic activity is likely through 2024, with momentum gathering in the second half.
CHINA
Can authorities pull a rabbit out of the hat in 2023?
2023 is the Year of the Rabbit and the world will be hoping Chinese authorities can pull one out of the hat. Can they stimulate the economy to revive a stalling rebound following the reopening of the economy in January after the lifting of zero-tolerance restrictions.
After a solid opening to 2023, with 1Q GDP growth of 4.5%, growth in the key partial components of industrial production, retail sales and fixed asset investment slowed in April and May (Exhibit 10). Industrial company profits fell 13% in May from a year earlier. The premier Li Qiang has reassured markets 2Q GDP growth will beat Q1 and the economy is on track to achieve the official growth target of “around 5%” in 2023.
Exhibit 10: China—activity indicators. Year-ended growth
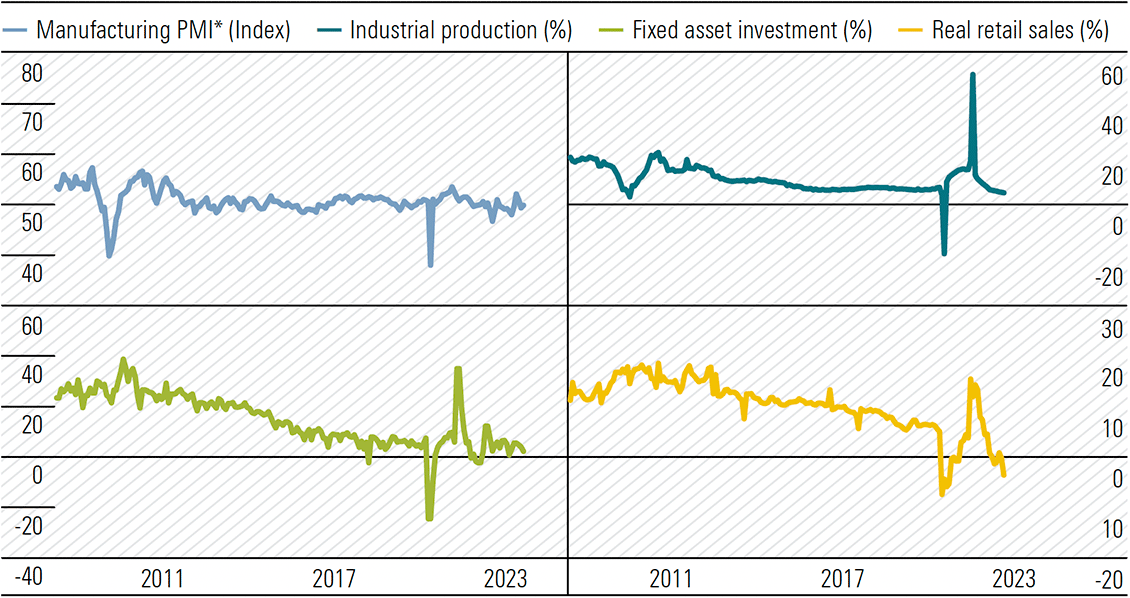
* Diffusion index; average of the official and Caixin.
Sources: CEIC Data; Markit Economics; RBA.
The PMIs for June are suggesting the June quarter will close on a weak note, with the services sector causing concern. The official nonmanufacturing PMI, which includes both services and construction activity, declined from 54.5 in May to 53.2. The services only sub-index eased from 53.8 to 52.8. The private Caixin/S&P Global services PMI revealed a greater fall from 57.1 to 53.9 to the slowest pace in since January after coronavirus swept the country following the lifting of zero-tolerance policy. Both business activity and new orders experienced slowing growth, while new export orders expanded at a solid pace, albeit slightly lower than in May.
The gradual transition from a fixed asset investment and export driven economy to one more focused on domestic consumption is likely to be stepped up. Polices supporting both the consumer and businesses is expected to be forthcoming. So far, interest rate cuts have been modest and further and more meaningful moves are likely.
The private sector needs more encouragement, and we expect authorities to adopt a more supportive stance with a meaningful fiscal injection to revive private sector and consumer activity and lift domestic consumption. Authorities do not have the inflationary concerns of western developed economies, with annual CPI at 0.2% in May and negative PPI readings for eight consecutive months.
While markets appear somewhat pessimistic, we believe GDP growth nearer 6% is possible in 2023 and consolidation in 2024 around that mark. Dominance in specific markets in the quest for global energy transition to renewables, including solar panels and lithium-ion batteries will ensure a healthy trade surplus is maintained, supporting increased domestic consumption.
—Peter Warnes
ENERGY
OPEC+ production cuts look to defend price and create supply deficits
OPEC+ production cuts are expected to tighten the market, driving supply deficits in the second half of 2023, supporting higher oil prices. After a lengthy period of producing well above OPEC quotas, it looks like Russian production is now within compliance. With US producers unwilling to respond, OPEC+, led by Saudi Arabia, is emboldened to protect price without fear of market reprisals. The US is not responding with materially higher production in the short run, due to the time it takes to see results from drilling, and ongoing producer discipline. Estimated supply for the full year has declined 110 million barrels per day (mb/d) since March, mainly due to OPEC+ cuts. Meanwhile, the Energy Information Administration (EIA) now expects 2023 demand to be about 100 mb/d higher than in March, as Asian demand, primarily in China, has exceeded earlier expectations.
OPEC+ announced substantial production cuts for 2023 and 2024. In April, it surprised with voluntary cuts from several member countries, meaning quotas were not adjusted but volumes will decline by 1.7 mb/d in total. These voluntary cuts were initially scheduled to unwind at the end of the year. However, reports suggest they were extended through 2024 at the 4 June ministerial meeting. Official quotas were also reduced on 4 June by 1.4 mb/d, and tweaked on 13 June with an increase to Russia’s quota, ostensibly pushing the combined curtailment next year to 2.9 mb/d.
However, because several members have been persistently struggling to deliver their quotas, the 2024 adjustment merely aligns these countries’ targets with their capacities. Adjusting for this underperformance, Morningstar pegs the realistic impact of the combined cuts on 2024 volumes at around 1.1 mb/d.
OPEC+ announcements did buoy crude prices temporarily. But market enthusiasm has waned on concerns about the global economy, and Brent prices near US$75 per barrel are currently about 10% lower than the start of April. This has likely frustrated the Saudis, under growing pressure to keep prices above US$80 a barrel to ensure enough revenue to fund planned social spending. This was probably the motivation for the “Saudi lollipop,” an additional temporary cut of 1 mb/d Saudi Arabia will implement unilaterally in July 2023, which was announced shortly after the 4 June meeting.
All up, the Brent price remains above our unchanged US$60 per barrel mid-cycle estimate from 2025. So too Asia LNG at US$12 per mmBtu, sits above our unaltered mid-cycle estimate of US$8.40 per mmBtu. And Australian energy stocks remain undervalued. We still expect upstream oil and gas company earnings in 2023 to approximately halve on 2022 levels. But this should not translate to weaker share prices. Energy commodity prices are still very healthy for the likes of Woodside and Santos. They can earn favourable margins even at considerably lower prices than current in support of their expansion aspirations.
Longer term we still see secular demand decline for oil is on the horizon, but we think the market is probably too bearish about both the timing and the severity of it. We think global demand will creep higher in the next few years, rather than collapsing. And when it does start to decline, in the early 2030s, in our base case, the rate will be modest because the impact of the rapid proliferation of electric vehicles that we expect will be offset by growing demand for jet fuels and petrochemicals.
And especially important for gas-heavy Australian E&P’s natural gas as an energy transition commodity, demand will be strong and growing for peaking requirements. All this gives Australian E&P’s a multi-decade runway to maintain and grow their operations and continue generating robust free cash flows, much of which we think will be funnelled back to shareholders via buybacks and dividends.
—Mark Taylor
Watch this webinar to hear from members of Morningstar’s manager research team including, Annika Bradley, Michael Malseed and Steven Le, following their sector review of global equity strategies.