
Investors in shares must expect market shocks as part of the long-term benefits of owning part of a company, and on average over time, stock markets fall one year in every five. History provides a valuable guide to how markets normally recover from shocks, showing the missed opportunities of exiting equities and not re-entering.
However, it must be acknowledged that coronavirus did not start as a financial shock, such as a rapid fall in share prices or a market collapse such as the GFC or tech wreck. This started as a social and health scare and has spread into financial markets, which might limit what history can teach us. As supply chains close and countries shut their borders, the wealth created by globalisation will be compromised, and with it, economic growth and business activity will fall, at least in the short term.
Please let me know if there is more we can do to support you and your business. We’re here to help you through this volatile time to continue to empower investor success.
Regards
Tony Gangemi
Head of Adviser Software Solutions, Morningstar Australasia Pty Ltd. [email protected]
Power of Reinvesting
2000-2019
About the data
Stocks are represented by the Ibbotson® Large Company Stock Index. Bonds are represented by the 20-year U.S. government bond. An investment cannot be made directly in an index.
Past performance is no guarantee of future results. Hypothetical value of $1,000 invested for the past 20 years. Data does not account for taxes or transaction costs. This is for illustrative purposes only and not indicative of any investment. An investment cannot be made directly in an index. © Morningstar 2020. All Rights Reserved.
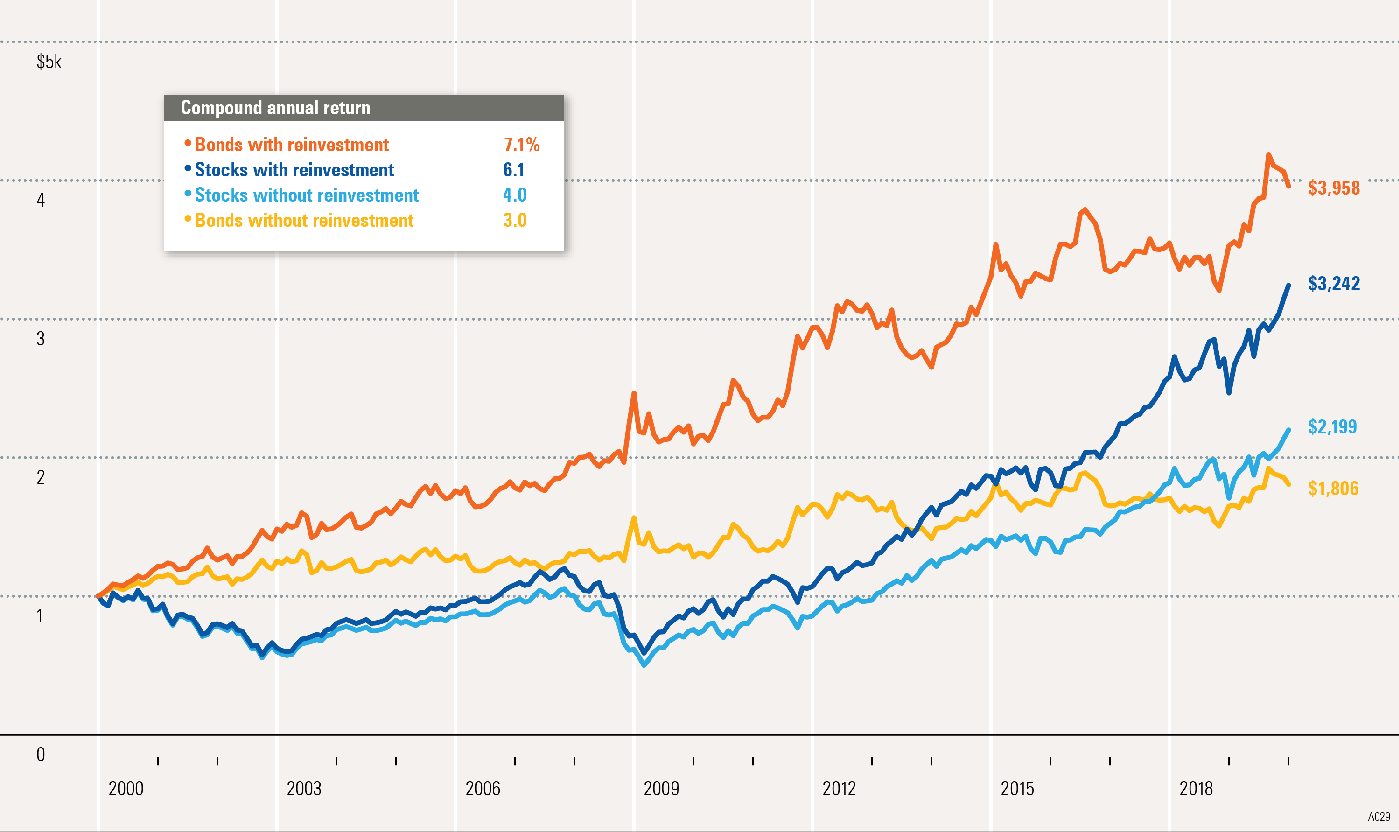
- A key to enhancing returns is the reinvestment of income. Returns decline dramatically if dividends or coupon payments are consumed rather than reinvested.
- The image compares the difference in hypothetical growth of $1,000 invested in stocks and bonds with and without the reinvestment of dividends or coupon payments.
- Reinvesting your income enables you to take advantage of compounding. With compounding, you earn income on the principal in addition to the reinvested dividends and coupon payments.
- If you are an investor who does not need to spend dividends or coupon payments, you should consider reinvesting this income in order to maximise the growth of your portfolio.
- Keep in mind that total return represents capital appreciation, income, and reinvestment of income, and that capital appreciation is the return owing to changes in price. Government bonds are guaranteed by the full faith and credit of the U.S. government as to the timely payment of principal and interest, while stocks are not guaranteed and have been more volatile than bonds.
Power of Compounding
Hypothetical Investment in Stocks
About the data
Stocks are represented by the Ibbotson® Large Company Stock Index. An investment cannot be made directly in an index.
Past performance is no guarantee of future results. This is for illustrative purposes only and not indicative of any investment. An investment cannot be made directly in an index. © Morningstar 2020. All Rights Reserved.
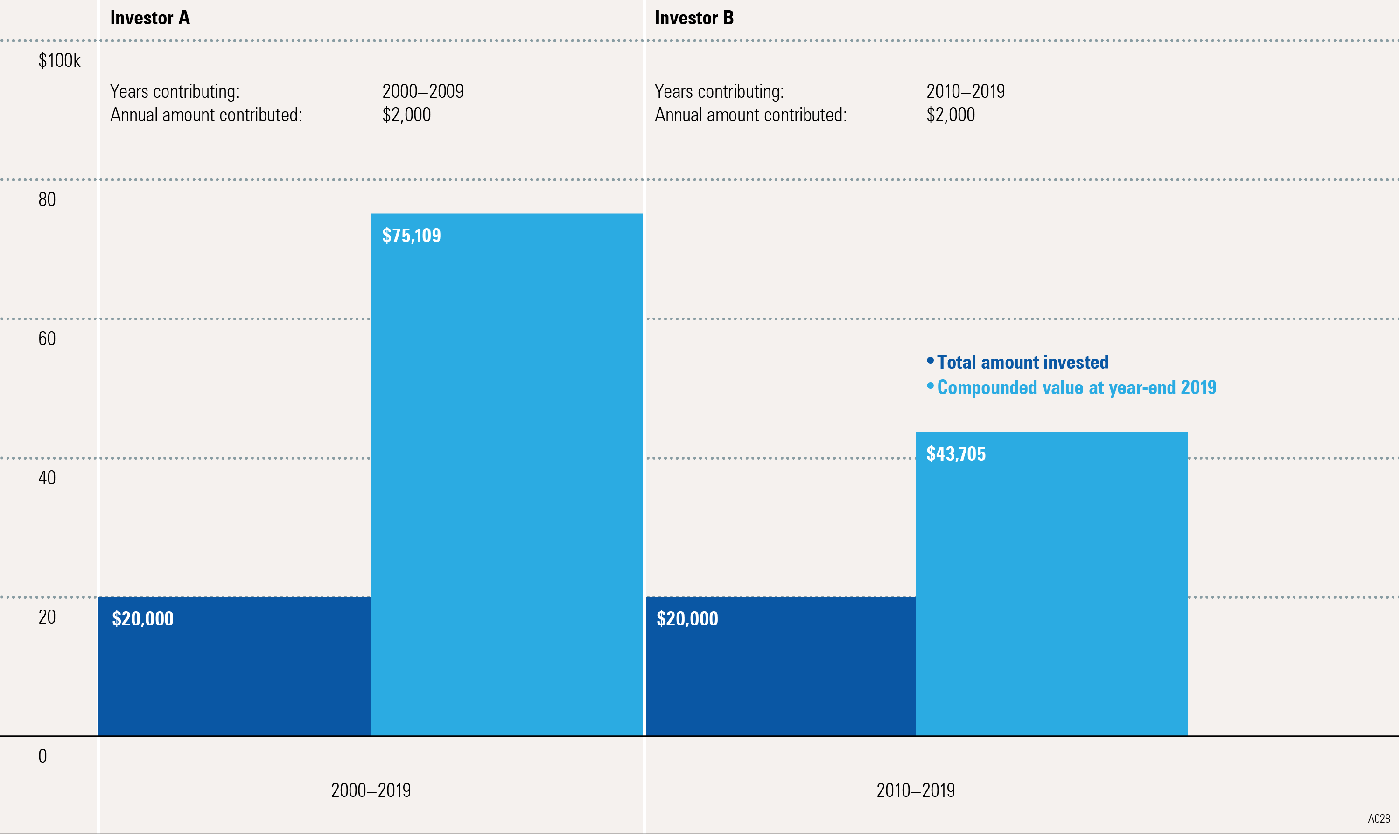
- It’s easy to procrastinate when it comes to initiating a long-term investment plan. However, the sooner you begin, the more likely it is that the plan will succeed.
- This image illustrates the effects of compounding over time. Investor A began investing in stocks at the beginning of 2000, investing $2,000 each year for 10 years. After 10 years, Investor A stopped contributing to the portfolio but allowed it to grow for the next 10 years. The $20,000 outlay grew to $75,109 by year-end 2019.
- Investor B postponed investing for 10 years. At the beginning of 2010, Investor B began investing $2,000 each year in stocks for 10 years. The $20,000 outlay of Investor B (same as the one of Investor A) only grew to $43,705 by year-end 2019.
- By starting early, and thereby taking advantage of compounding, Investor A accumulated $31,404 more than Investor B, while investing exactly the same amount.
- Returns and principal invested in stocks are not guaranteed, and stocks have been more volatile than the other asset classes. The data assumes reinvestment of income and does not account for taxes or transaction costs.
Importance of Rebalancing
1999-2019
About the data
Small stocks are represented by the Ibbotson® Small Company Stock Index. Large stocks are represented by the Ibbotson® Large Company Stock Index. Intermediate-term government bonds are represented by the five-year U.S. government bond. An investment cannot be made directly in an index. The data assumes reinvestment of income and does not account for taxes or transaction costs.
Past performance is no guarantee of future results. Stocks: 50% large and 50% small stocks. Bonds: intermediate-term government bonds. This is for illustrative purposes only and not indicative of any investment. An investment cannot be made directly in an index. © Morningstar 2020. All Rights Reserved.
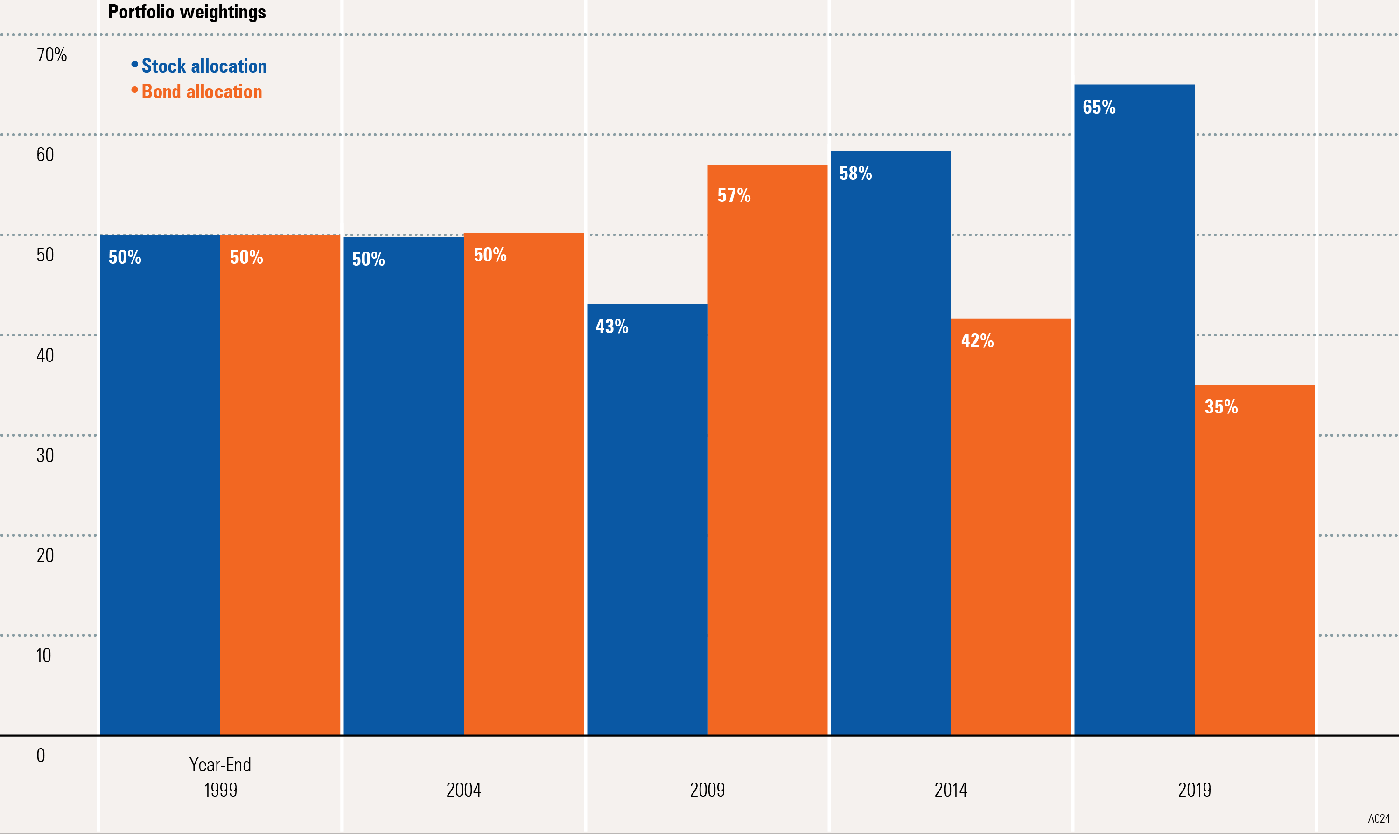
- Because asset classes grow at different rates of return, it is necessary to periodically rebalance a portfolio to maintain a target asset mix.
- This image illustrates the effect of different growth rates on a static (unbalanced) portfolio over a 20-year period. At year-end 1998, the target asset mix began with a 50% allocation to stocks and a 50% allocation to bonds.
- Nothing much changed between 1999 and 2004, with bonds gaining a slight edge over stocks with 50.2% versus 49.8%. Subsequent market fluctuations caused the stock allocation to decrease to 43% by 2009 and increase to 58% in 2014 and 65% in 2019. This allocation is drastically different from the 50%/50% portfolio the investor started out with.
- Asset classes associated with high degrees of risk tend to have higher rates of return than less volatile asset classes. For this reason, a portfolio that is not rebalanced periodically may become more volatile (riskier) over time.
- Diversification does not eliminate the risk of investment losses. Government bonds are guaranteed by the full faith and credit of the U.S. government as to the timely payment of principal and interest, while stocks are not guaranteed and have been more volatile than bonds.
Managing Risk With Portfolio Rebalancing
The Risk and Return of Rebalanced versus Nonrebalanced Portfolios
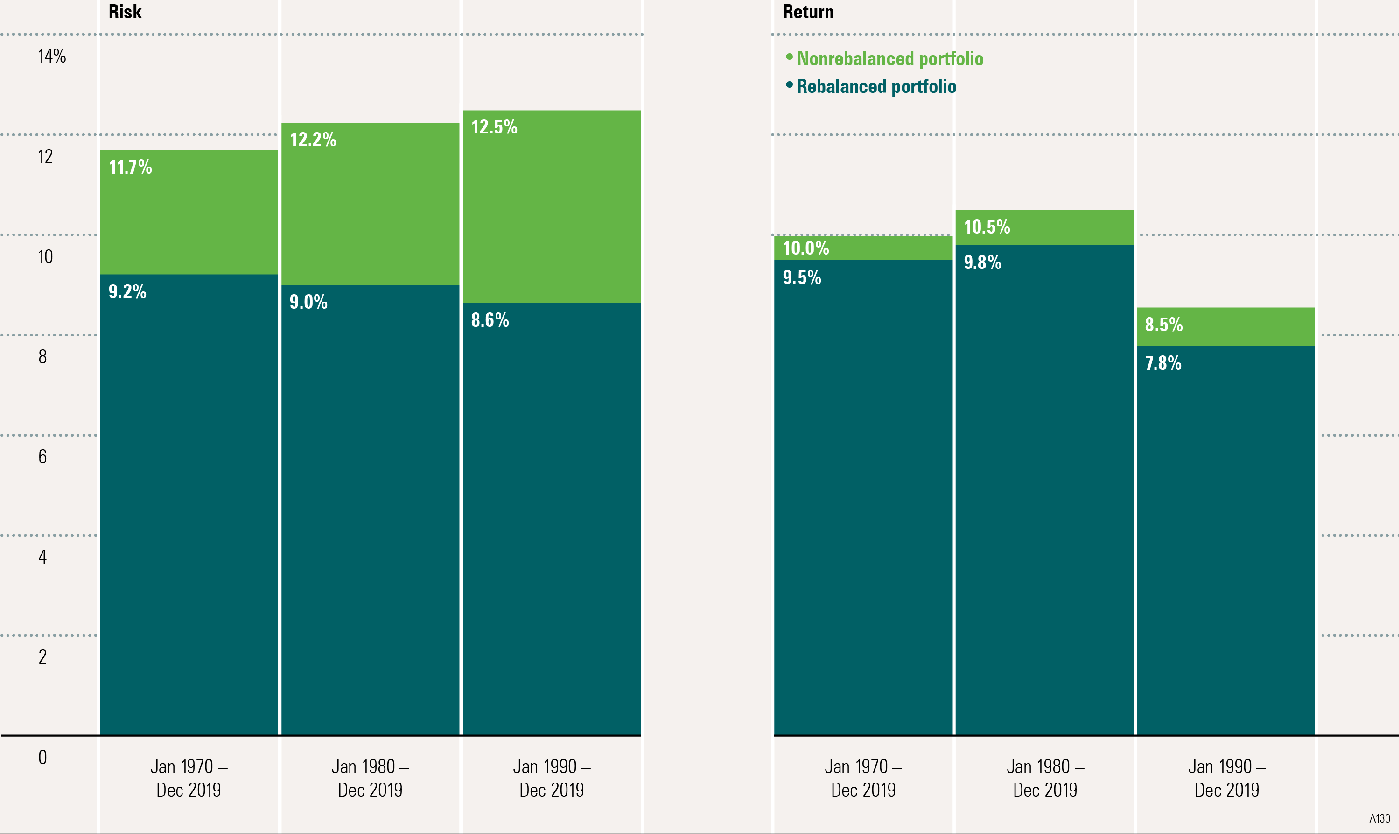
- Over time, an investor’s portfolio asset-allocation policy can get disturbed by market ups and downs. For example, stocks tend to outperform bonds in the long run. Since stocks are riskier than bonds, a greater allocation in stocks can also increase portfolio risk. Rebalancing is an essential account-management tool that helps keep the portfolio within the risk tolerance level that is comfortable for the investor’s asset-allocation strategy.
- The image compares the risk and return of portfolios that were rebalanced to those that were not rebalanced over three different time periods. Risk and return were measured by monthly annualised standard deviation and compound annual return, respectively. Standard deviation measures the fluctuation of returns around the arithmetic average return of the investment. The higher the standard deviation, the greater the variability (and thus risk) of the investment returns.
- The returns for the nonrebalanced portfolio were higher in all three time periods. However, the risk was also considerably higher. In all three time periods, the rebalanced portfolio had a much lower risk than the nonrebalanced portfolio. This illustrates how rebalancing can help manage risk.
- Diversification does not eliminate the risk of investment losses. Government bonds and Treasury bills are guaranteed by the full faith and credit of the U.S. government as to the timely payment of principal and interest, while stocks are not guaranteed and have been more volatile than bonds. International investments involve special risks such as fluctuations in currency, foreign taxation, economic and political risks, and differences in accounting and financial standards.
Dangers of Market-Timing
Hypothetical Value of $1 Invested from 1926-2019
About the data
Stocks are represented by the Ibbotson® Large Company Stock Index. Treasury bills are represented by the 30-day U.S. Treasury bill. The data assumes reinvestment of income and does not account for taxes or transaction costs.
Past performance is no guarantee of future results. This is for illustrative purposes only and not indicative of any investment. An investment cannot be made directly in an index. © Morningstar 2020. All Rights Reserved
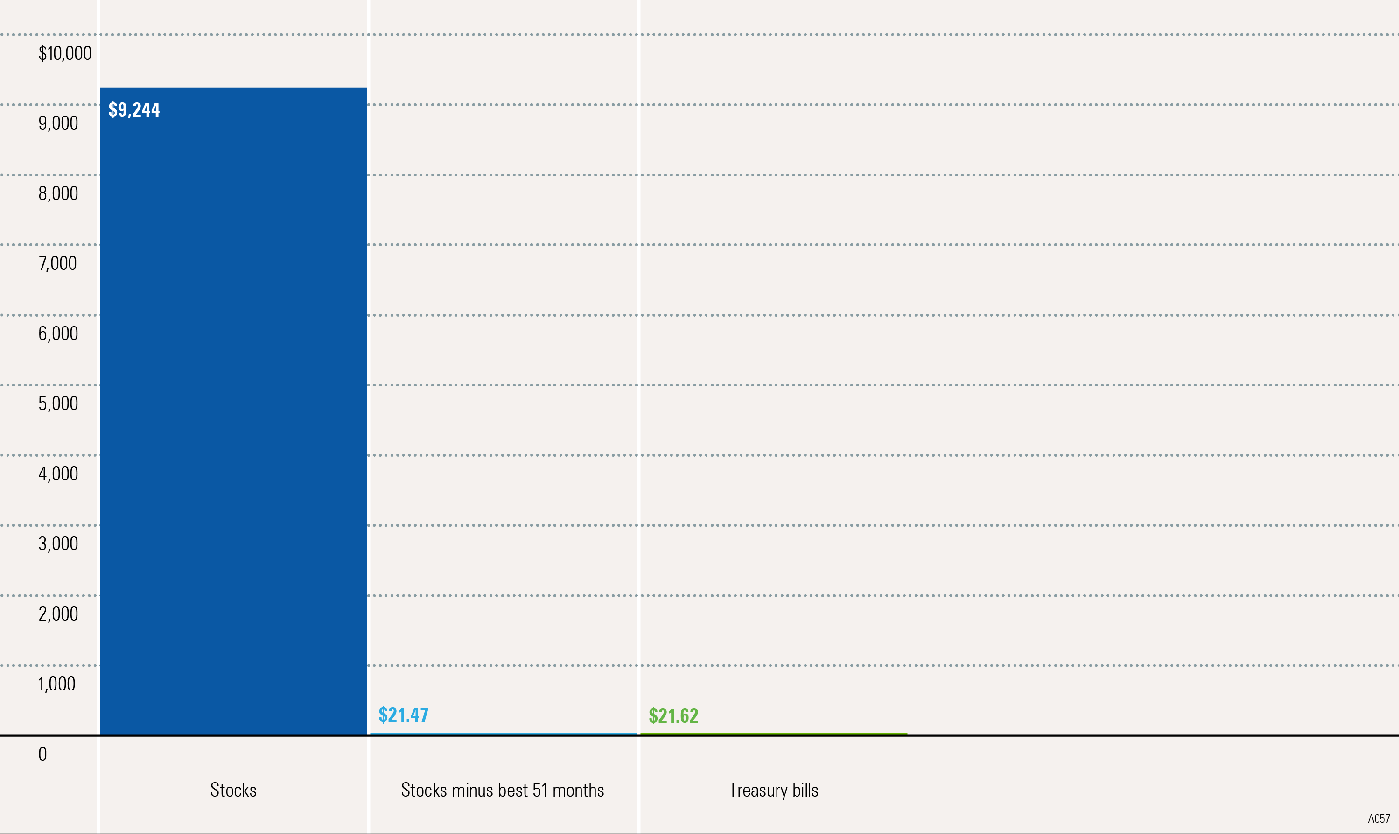
- Investors who attempt to time the market run the risk of missing periods of exceptional returns. This practice may have a negative effect on a sound investment strategy.
- This image illustrates the risk of attempting to time the stock market since 1926.
- A hypothetical $1 invested in stocks at the beginning of 1926 grew to $9,244 by year-end 2019. However, that same $1 investment would have only grown to $21.47 had it missed the best 51 months of stock returns. One dollar invested in Treasury bills resulted in an ending wealth value of $21.62. An unsuccessful market-timer, missing the 51 best months of stock returns, would have received a return roughly equivalent to that of Treasury bills.
- Although successful market-timing may improve portfolio performance, it is very difficult to time the market consistently. In addition, unsuccessful market-timing can lead to a significant opportunity loss.
- Returns and principal invested in stocks are not guaranteed, and stocks have been more volatile than other asset classes. Government bonds and Treasury bills are guaranteed by the full faith and credit of the U.S. government as to the timely payment of principal and interest. Holding a portfolio of securities for the long term does not ensure a profitable outcome and investing in securities always involves risk of loss.
Dangers of Market-Timing, Part II
Hypothetical Value of $1 Invested from 2000-2019
About the data
Stocks are represented by the Ibbotson® Large Company Stock Index. Treasury bills are represented by the 30-day U.S. Treasury bill. An investment cannot be made directly in an index. The data assumes reinvestment of income and does not account for taxes or transaction costs.
Past performance is no guarantee of future results. This is for illustrative purposes only and not indicative of any investment. An investment cannot be made directly in an index. © Morningstar 2020. All Rights Reserved.
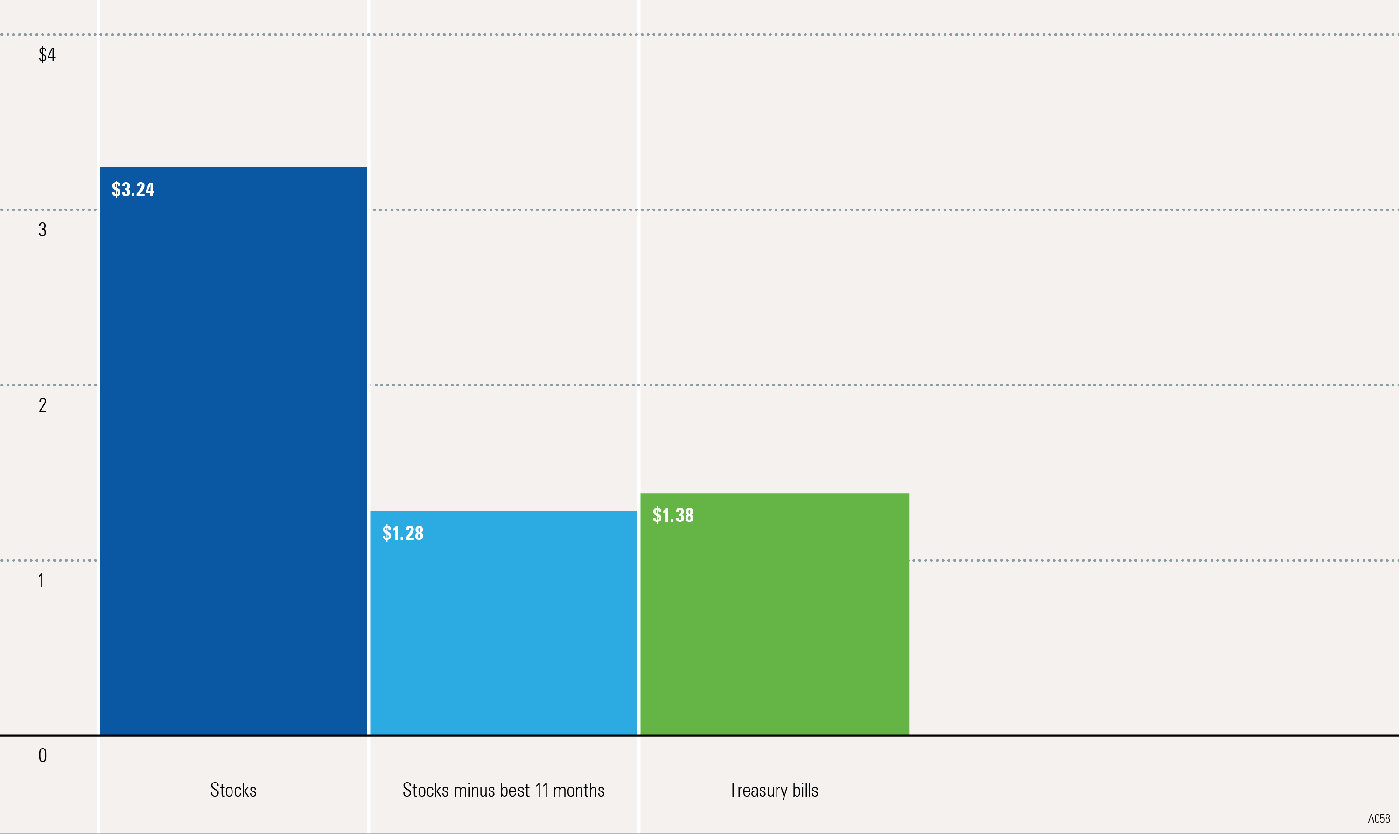
- Investors who attempt to time the market run the risk of missing periods of exceptional returns. This practice may have a negative effect on a sound investment strategy.
- This image illustrates the risk of attempting to time the stock market over the past 20 years.
- A hypothetical $1 invested in stocks at the beginning of 2000 grew to $3.24 by year-end 2019. However, that same $1 investment would have only grown to $1.28 had it missed the eleven best months of stock returns. One dollar invested in Treasury bills over the 20-year period resulted in an ending wealth value of $1. 38. An unsuccessful market-timer missing the nine best months of stock returns would have received a return similar to that of Treasury bills.
- Although successful market-timing may improve portfolio performance, it is very difficult to time the market consistently. In addition, unsuccessful market-timing can lead to a significant opportunity loss.
- Returns and principal invested in stocks are not guaranteed, and stocks have been more volatile than other asset classes. Government bonds and Treasury bills are guaranteed by the full faith and credit of the U.S. government as to the timely payment of principal and interest. Holding a portfolio of securities for the long term does not ensure a profitable outcome and investing in securities always involves risk of loss.
Market-Timing Risk
The Effects of Missing the Month of Annual Returns, 1970-2019
About the data
Stocks are represented by the Ibbotson® Large Company Stock Index. An investment cannot be made directly in an index. The data assumes reinvestment of income and does not account for taxes or transaction costs.
Past performance is no guarantee of future results. This is for illustrative purposes only and not indicative of any investment. An investment cannot be made directly in an index. © Morningstar 2020. All Rights Reserved.
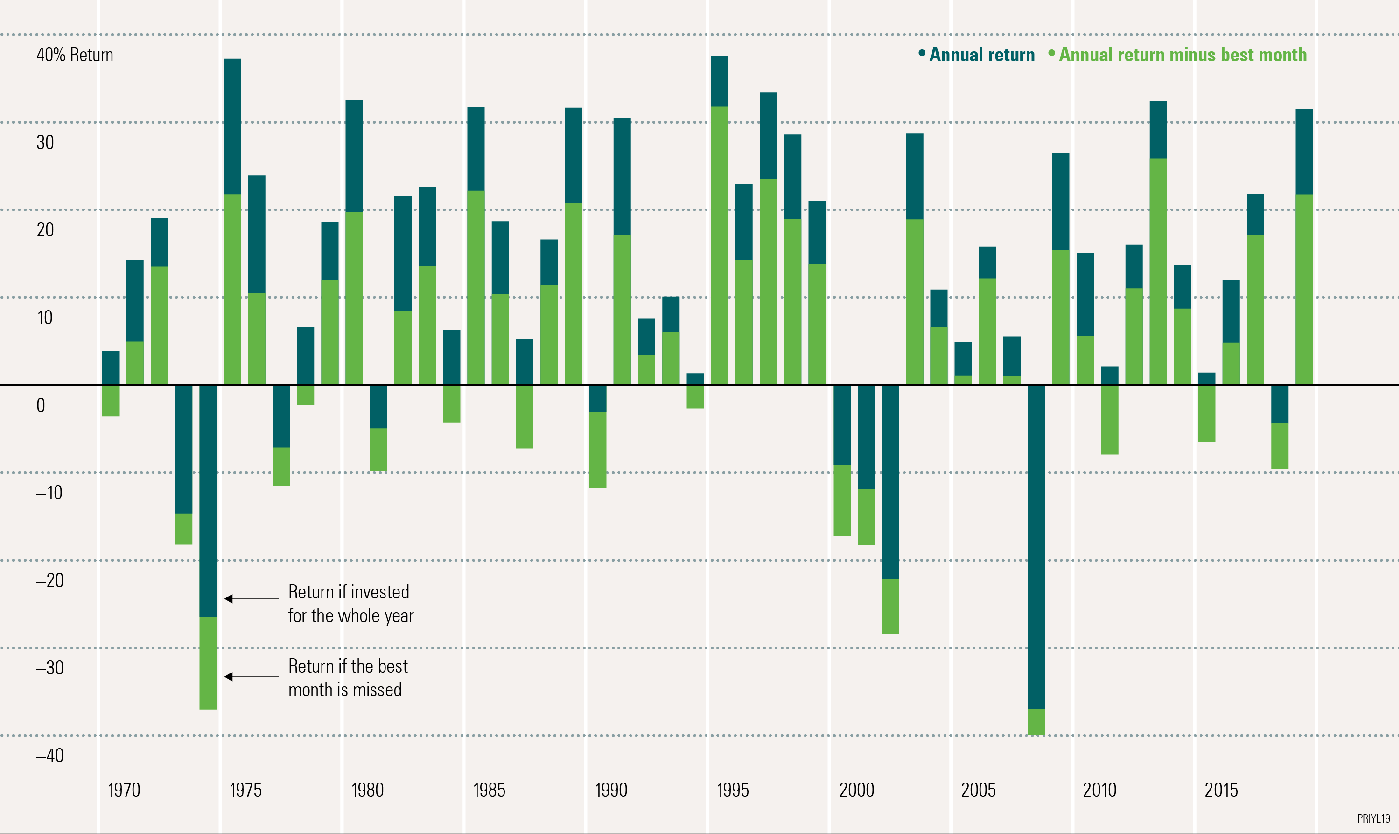
- Investors who attempt to time the market run the risk of missing periods of exceptional returns. This practice may have a negative effect on a sound investment strategy.
- This image illustrates the risk of attempting to time the stock market by showing the effects of missing the one best month on an annual return.
- Missing the one best month during a year drastically reduced returns. During years when returns were already negative, the effect of missing the best month only exaggerated the loss for the year. In seven of the 49 years shown—1970, 1978, 1984, 1987, 1994, 2011, and 2015—otherwise positive returns would have been dragged into negative territory by missing the best month.
- Although successful market-timing may improve portfolio performance, it is very difficult to time the market consistently. In addition, unsuccessful market-timing can lead to a significant opportunity loss.
- Returns and principal invested in stocks are not guaranteed, and stocks have been more volatile than other asset classes. Holding a portfolio of securities for the long term does not ensure a profitable outcome and investing in securities always involves risk of loss.
The Cost of Market-Timing
The Risk of Missing the Best Days in the Market, 2000-2019
About the data
Stocks in this example are represented by the Ibbotson® Large Company Stock Index. An investment cannot be made directly in an index. The data assumes reinvestment of income and does not account for taxes or transaction costs.
Past performance is no guarantee of future results. This is for illustrative purposes only and not indicative of any investment. An investment cannot be made directly in an index. © Morningstar 2020. All Rights Reserved.
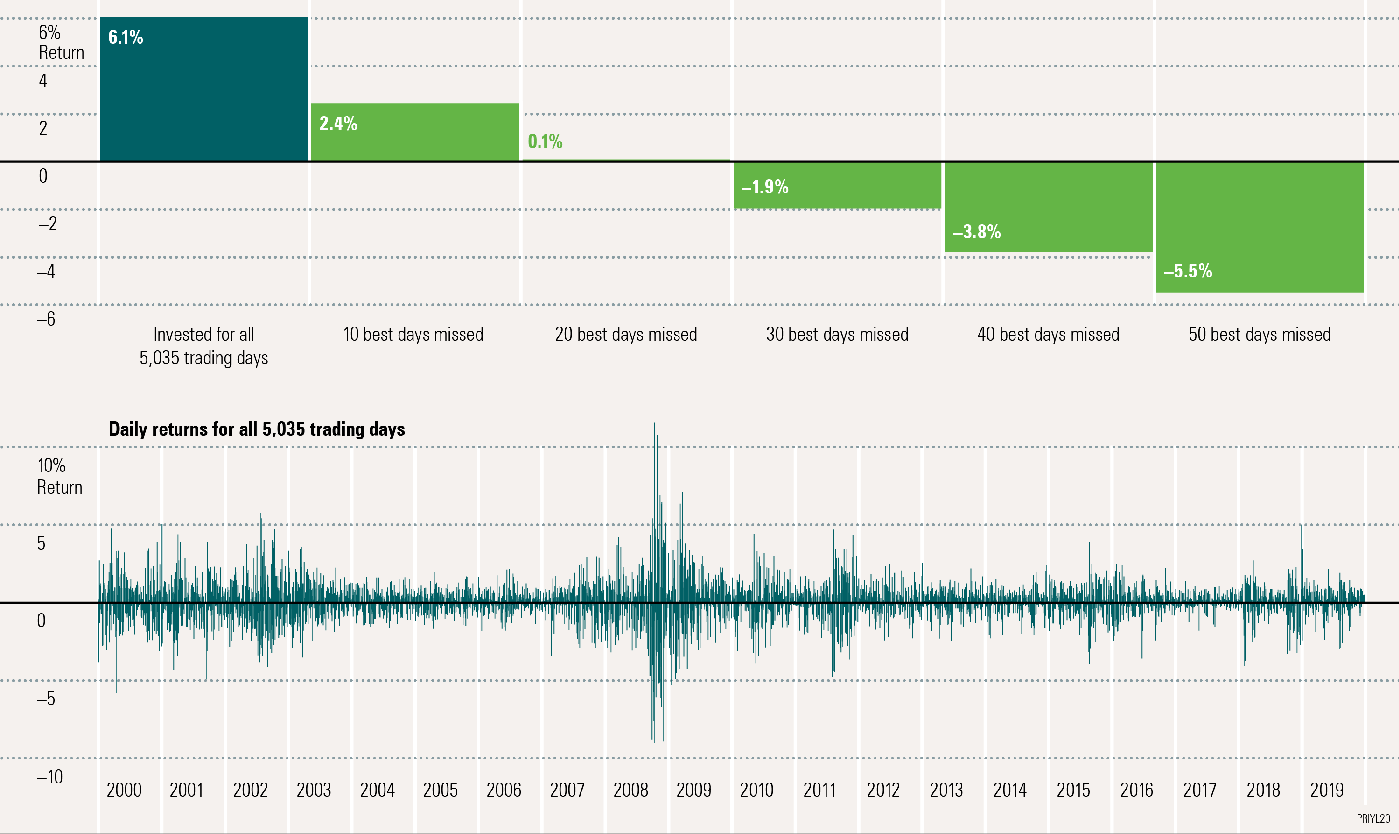
- Investors who attempt to time the market run the risk of missing periods of exceptional returns, leading to significant adverse effects on the ending value of a portfolio. This top graph illustrates the risk of attempting to time the stock market over the past 20 years by showing the returns investors would have achieved if they had missed some of the best days in the market. The bottom graph illustrates the daily returns for all 5,035 trading days.
- Investors who stayed in the market for all 5,035 trading days achieved a compound annual return of 6.1%. However, that same investment would have returned 2.4% had it missed only the 10 best days of stock returns. Further, missing the 50 best days would have produced a loss of 5.5%. Although the market has exhibited tremendous volatility on a daily basis, over the long term, stock investors who stayed the course were rewarded accordingly.
- The appeal of market-timing is obvious—improving portfolio returns by avoiding periods of poor performance. However, timing the market consistently is extremely difficult. And unsuccessful market-timing (the more likely result) can lead to a significant opportunity loss.
- Returns and principal invested in stocks are not guaranteed, and stocks have been more volatile than other asset classes. Holding a portfolio of securities for the long term does not ensure a profitable outcome and investing in securities always involves risk of loss.
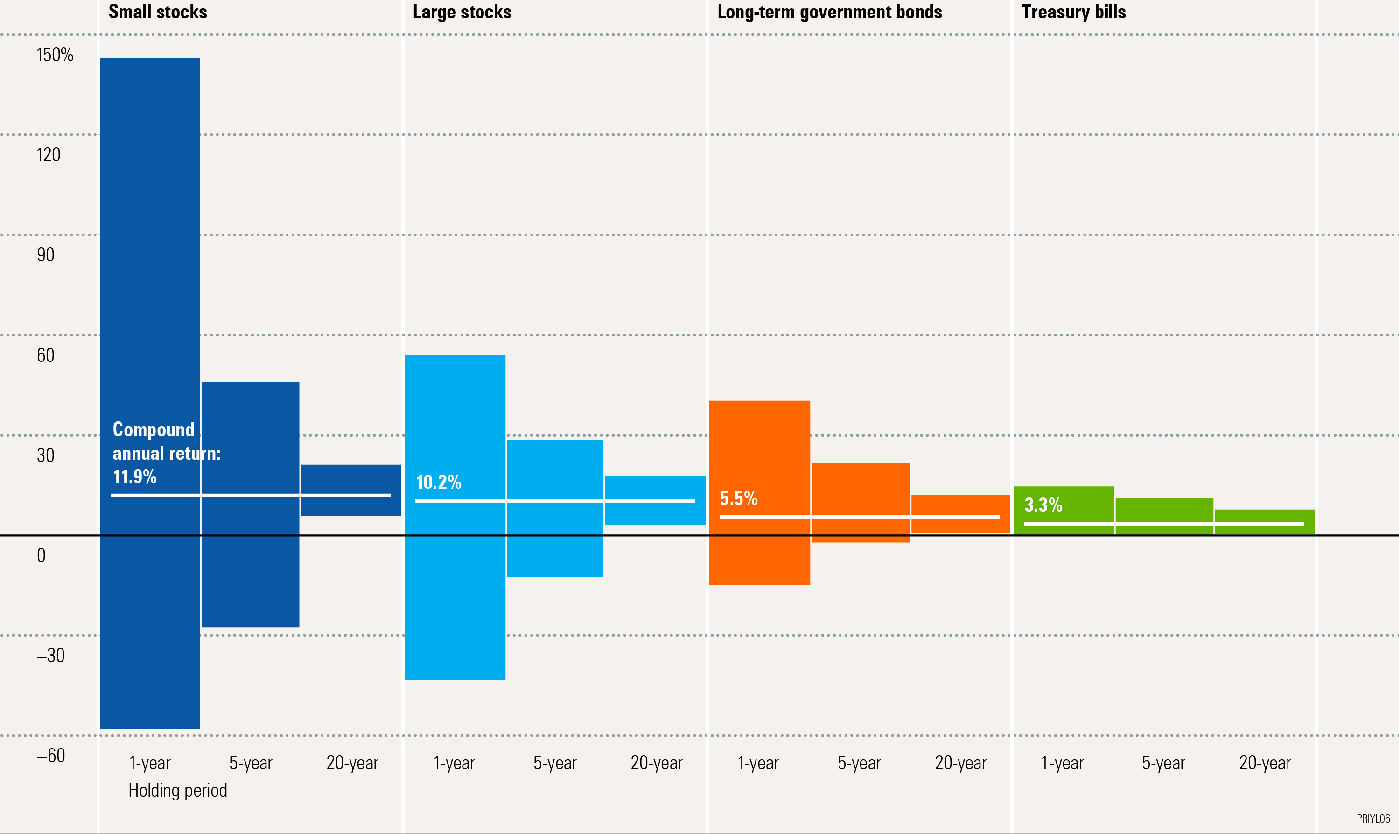
Reduction of Risk Over Time
1926-2019
About the data
Small stocks are represented by the Ibbotson® Small Company Stock Index. Large stocks are represented by the Ibbotson® Large Company Stock Index. Government bonds are represented by the 20-year U.S. government bond, and Treasury bills by the 30-day U.S. Treasury bill. An investment cannot be made directly in an index. The data assumes reinvestment of all income and does not account for taxes or transaction costs.
Past performance is no guarantee of future results. Each bar shows the range of compound annual returns for each asset class over the 1926–2019 period. This is for illustrative purposes only and not indicative of any investment. An investment cannot be made directly in an index. © Morningstar 2020. All Rights Reserved.
- One of the main factors you should consider when investing is the amount of risk, or volatility, that you are prepared to assume. However, recognise that the range of returns appears less volatile with longer holding periods.
- Over the long term, periods of high returns tend to offset periods of low returns. With the passage of time, these offsetting periods result in the dispersion of returns gravitating or converging toward the average. In other words, while returns may fluctuate widely from year to year, holding the asset for longer periods of time results in apparent decreased volatility.
- This graph illustrates the range of compound annual returns for stocks, bonds, and cash over one-, five-, and 20- year holding periods. On an annual basis since 1926, the returns of large-company stocks have ranged from a high of 54% to a low of negative 43.3%. For longer holding periods of five or 20 years, however, the picture changes. The average returns range from 28.6% to negative 12.5% over five-year periods and between 17.9% and 3.1% over 20-year periods. During the worst 20-year holding period for stocks since 1926, stocks still posted a positive 20-year compound annual return. However, keep in mind that holding stocks for the long term does not ensure a profitable outcome and that investing in stocks always involves risk, including the possibility of losing the entire investment.
- Although stockholders can expect more short-term volatility, the risk of holding stocks appears to lessen with time.
- Government bonds and Treasury bills are guaranteed by the full faith and credit of the U.S. government as to the timely payment of principal and interest, while stocks are not guaranteed and have been more volatile than the other asset classes. Furthermore, small-company stocks are more volatile than large-company stocks and are subject to significant price fluctuations and business risks and are thinly traded.
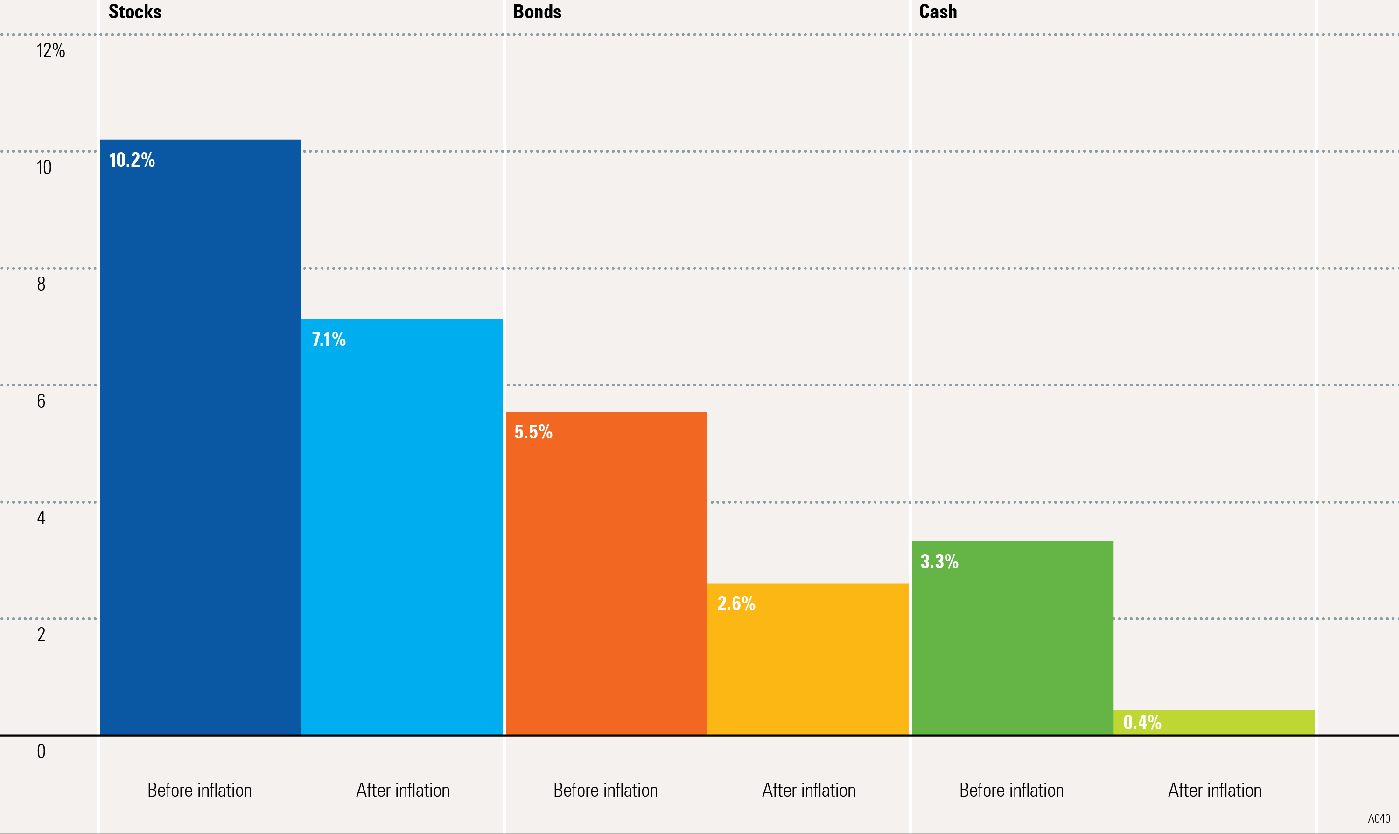
Returns Before and After Inflation
1926-2019
About the data
Stocks are represented by the Ibbotson® Large Company Stock Index. Bonds are represented by the 20-year U.S. government bond, cash by the U.S. 30-day Treasury bill, and inflation by the Consumer Price Index. An investment cannot be made directly in an index.
Past performance is no guarantee of future results. Assumes reinvestment of income and no transaction costs or taxes. This is for illustrative purposes only and not indicative of any investment. An investment cannot be made directly in an index. © Morningstar 2020. All Rights Reserved.
- Comparing the returns of different asset classes both before and after inflation is helpful in understanding why it is so important to consider inflation when making long-term investment decisions.
- This image illustrates the compound annual returns of three asset classes before and after considering the effects of inflation. Since 1926, inflation has dramatically reduced the returns of stocks, bonds, and cash.
- The first bars for each asset class represent the nominal, or unadjusted, returns of each asset class. Nominal returns do not consider inflation. It is often the rate of return that you might think of when discussing the return on investment.
- The second bars illustrate the real, or inflation-adjusted, returns of each asset class. Real returns reflect purchasing power. For example, if you invested in cash equivalents in 1926, the money you earned over the period would provide you with very little purchasing power today.
- Notice that cash and bonds, after adjusting for inflation, barely kept pace with the rise in prices over the time period analysed.
- Government bonds and Treasury bills are guaranteed by the full faith and credit of the U.S. government as to the timely payment of principal and interest, while stocks are not guaranteed and have been more volatile than the other asset classes.
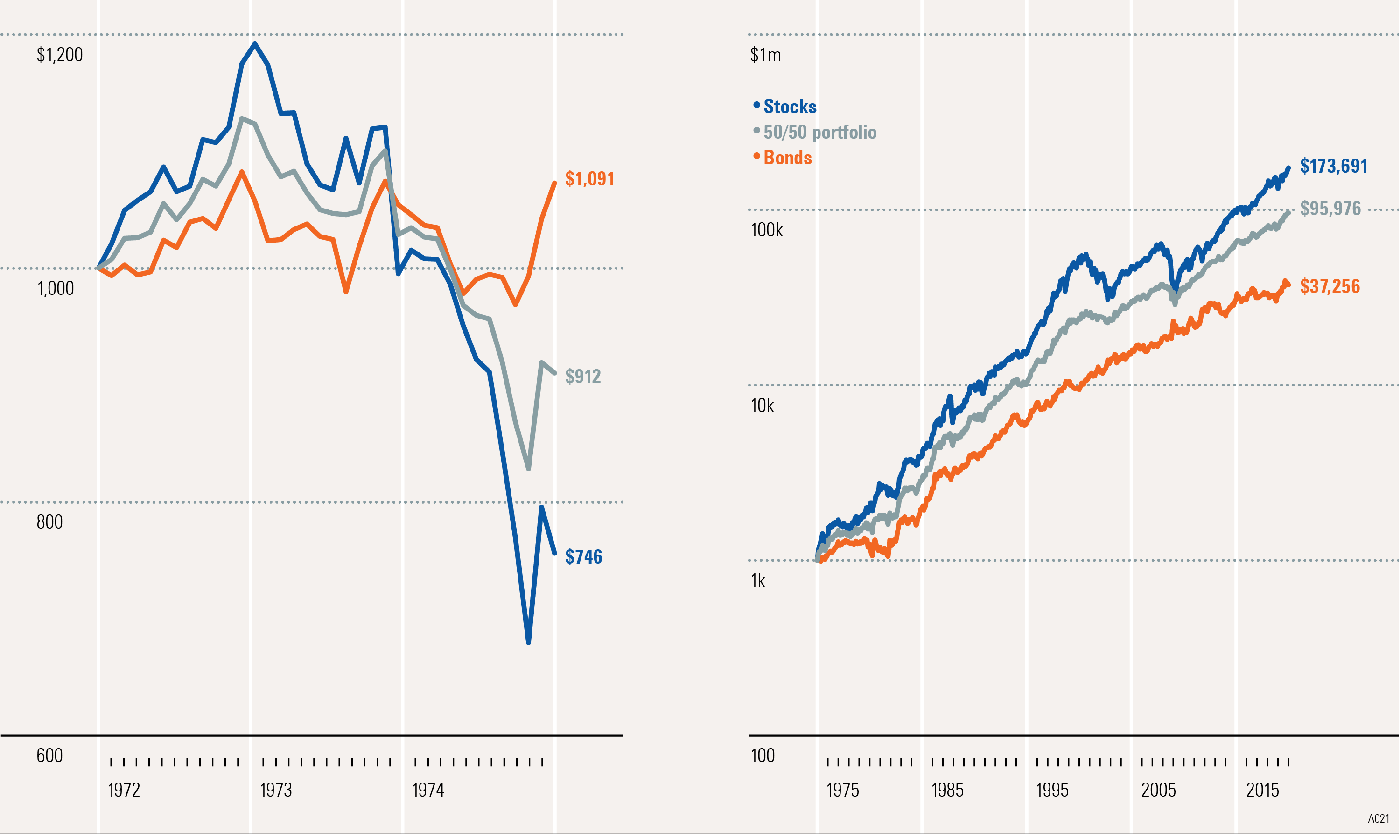
Can You Stay on Track?
About the data
Stocks are represented by the Ibbotson® Large Company Stock Index. Bonds are represented by the 20-year U.S. government bond. An investment cannot be made directly in an index. The data assumes reinvestment of income and does not account for taxes or transaction costs.
Past performance is no guarantee of future results. This is for illustrative purposes only and not indicative of any investment. An investment cannot be made directly in an index. © Morningstar 2020. All Rights Reserved.
- It’s easy to follow a long-term strategy during good times; the hard part is sticking with it through the bad times.
- What should you do if you are a long-term investor sitting in the midst of a bear market? If you are holding a well-diversified portfolio, the answer is simple—continue to stay the course. This image illustrates the hypothetical growth of stocks, bonds, and an equally diversified portfolio over short- and long-term periods.
- The graph on the left illustrates the performance of the assets during one of the worst three-year time periods in recent history. As illustrated, the significance of holding a diversified portfolio is most apparent in a bear market. Although the diversified portfolio still lost more than bonds in the short run, it did not withstand as great a loss as stocks. Over the long term, however, the picture changes.
- The graph on the right illustrates the performance of the assets over the long run, from the beginning of 1975 to year-end 2019. By continuing to hold the all-stock portfolio past 1975 (over the full time period), one would have experienced the highest ending wealth value of the assets shown. However, it is important to understand that this greater wealth was achieved with considerable volatility, which is indicated in the short-term period (the left chart).
- While the more volatile single asset is likely to outperform the less volatile diversified portfolio over the long run, the main point to understand is that by maintaining a well-diversified portfolio, you are managing risk, not trying to escape it.
- Keep in mind that diversification does not eliminate the risk of investment losses. Government bonds and Treasury bills are guaranteed by the full faith and credit of the U.S. government as to the timely payment of principal and interest, while stocks are not guaranteed and have been more volatile than bonds.