
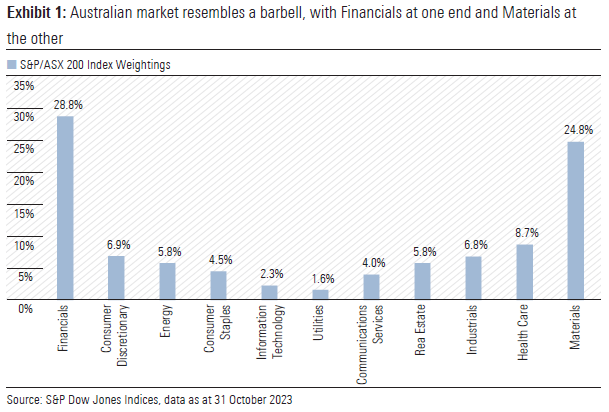
Ever wondered why the Australian equities market is often referred to as the “barbell”? It is not because the market is chock full of miners forever pumping iron. Nor is it because it is constantly being lifted to new heights by our good ol’ banks, filled to the gills with housing loans squatting up the property market.
Rather, it is because no other major stock market index is so dominated by just two sectors, with financials accounting for 28.8% on the one end and materials making up 24.8% on the other (see Exhibit 1).
This is why, for those with an investment portfolio that is more akin to a Sportsbet gambling account, its performance bears no resemblance to the market returns reported by Australian Financial Review or Commsec evening market wraps. Come again? The ASX 200 is only down by 4% so far this year? That can’t be right. I’m down 50% over here, with a collection of spivvy cybersecurity and green energy stocks that are neither secure nor green!
More importantly, a knowledge of market compositions helps steer investors who desire particular exposures or diversifications. A fisherman would not troll for tuna in an estuary teeming with breams. So, why would an investor wanting exposure to technology stocks scavenge so hard for them in Australia where they account for only 2.3% of the market?
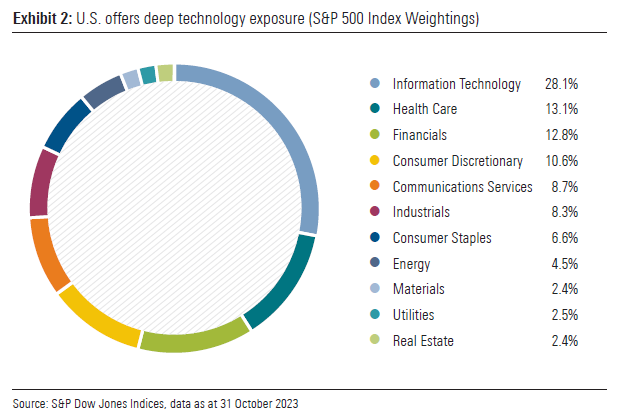
But guess where investors can find a petabyte of tech stocks? The US, where 28.1% of the US$38 trillion S&P 500 index value can be attributed to Information Technology companies (see Exhibit 2).
Of course, one should always keep a close eye on the price when it comes to investing. The US market is no doubt seductive in terms of the tech exposure it offers, in addition to its depth and sectoral diversification. But these attractive elements are also reflected in the US market multiple. In fact, the projected price-to-earnings multiple of US S&P 500 index is almost 40% higher than the average of other major markets (see Exhibit 3).
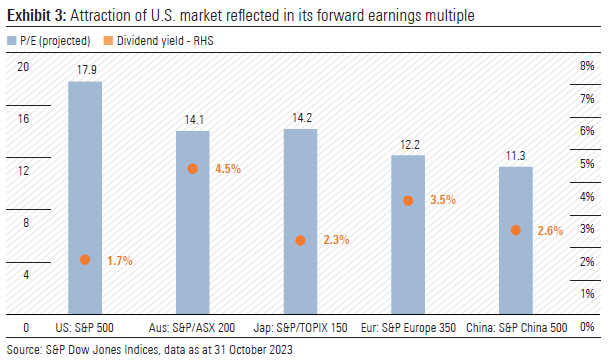
Indeed, based on the comparative multiples shown on Exhibit 3, a value-conscious investor may gravitate towards Chinese equities, with the S&P China 500 index at a price-to-earnings multiple that is 37% below the US S&P 500. The Chinese market is also more balanced, with weightings more evenly spread across industries (see Exhibit 4).
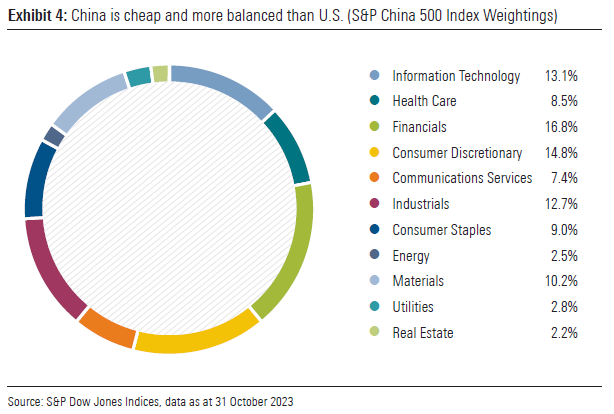
On the other hand, investing in China may not be everyone’s cuppa tea right now, no matter how balanced the index weightings. There are many reasons for this – political, economic, regulatory and whatever else the Western press seems to conjure up on a daily basis. And it does not help around 60% of the Chinese stock market value can be attributed to state owned enterprises (SOE), a three-letter acronym that gives the heebie-jeebies to many investors.
This sentiment is clearly evident in the underperformance of Chinese equities, as can be seen in Exhibit 5. Everyone wants to be a contrarian hero like Buffet and Munger. Unfortunately, not everyone is wired to be one, and the Chinese stock market’s recent relative weakness is sure to test the resolve of even the most ardent value investors.
But guess which other Asian market is staging a remarkable recovery, after the wilderness years from 1990 to 2012? Japan.
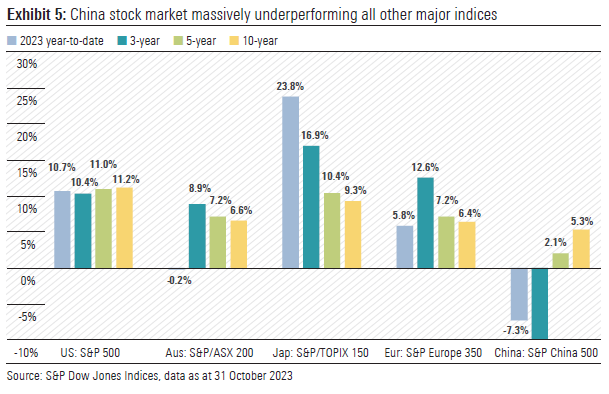
It is the Land of the Rising Sun where the sun is finally rising for stocks. As can be seen in Exhibit 5, the S&P/TOPIX 150 index is up 23.8% in 2023 to-date, continuing the recent three-year stellar performance. The five- and 10-year annualised performances are now not too shabby either, albeit we put in the usual disclaimer past performance is no indicator of future performance.
And the Japanese stock market is more “old school”, with the industrial sector (such as Mitsubishi Corp, Hitachi) and the consumer discretionary sector (think Toyota, Sony) accounting for 23.2% and 20.3% of the S&P TOPIX 150 index. It is certainly an alternative destination for investors who are reluctant to pay up for the tech glitz of the US market or the banking blitz of the Australian market.
As for Europe, the long-term performance of its stocks broadly mirrors that of Australia, as measured by the S&P Europe 350 index compared to S&P/ASX 200 index (see Exhibit 5). This is despite the vastly different composition of the European share market, with healthcare, industrials, consumer staples and discretionary sectors making up 53.3% of the market, versus just 26.9% in Australia (see Exhibit 6).
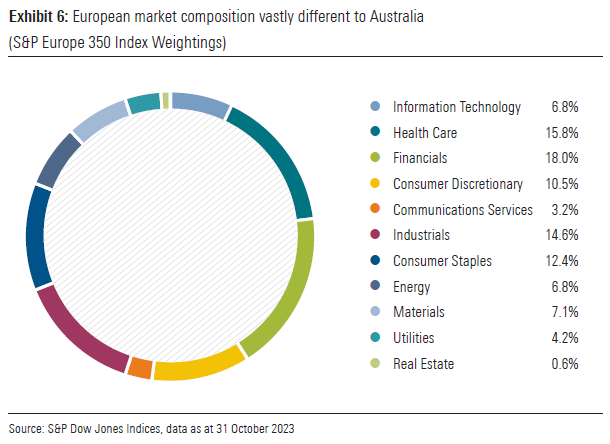
Indeed, there are investors in Australia keen on increasing their portfolio exposure to healthcare companies, driven by the thematic of ageing population, increasing wealth and growing focus on health. Unfortunately, investment choices in the healthcare sector are limited in Australia, outside of CSL, Cochlear and Resmed, as healthcare represents just 8.7% of the S&P/ASX 200 index. Turn your attention to Europe, the choices suddenly proliferate, with the healthcare sector making up 15.8% of the S&P Europe 350 index and made up of behemoths such as Novo Nordisk (diabetes, obesity), Novartis (oncology, immunology), Roche (biopharma, diagnostic), AstraZeneca (you may have heard of them during COVID vaccination craze), to name just a few.
From a top-down view, the European market also screens as cheaper than Australia, with forward price-to-earnings calculated by S&P Dow Jones as 12.2, compared to 14.1 for the Australian market (see Exhibit 3).
So, what European healthcare stocks tickle Morningstar analysts’ fancy at current prices? Come to think of it, what do we like in all the prominent sectors of each market that has been discussed in this report? The answer is contained in Exhibit 7, showing the relevant attractive shares trading at discounts to our fair value estimates.
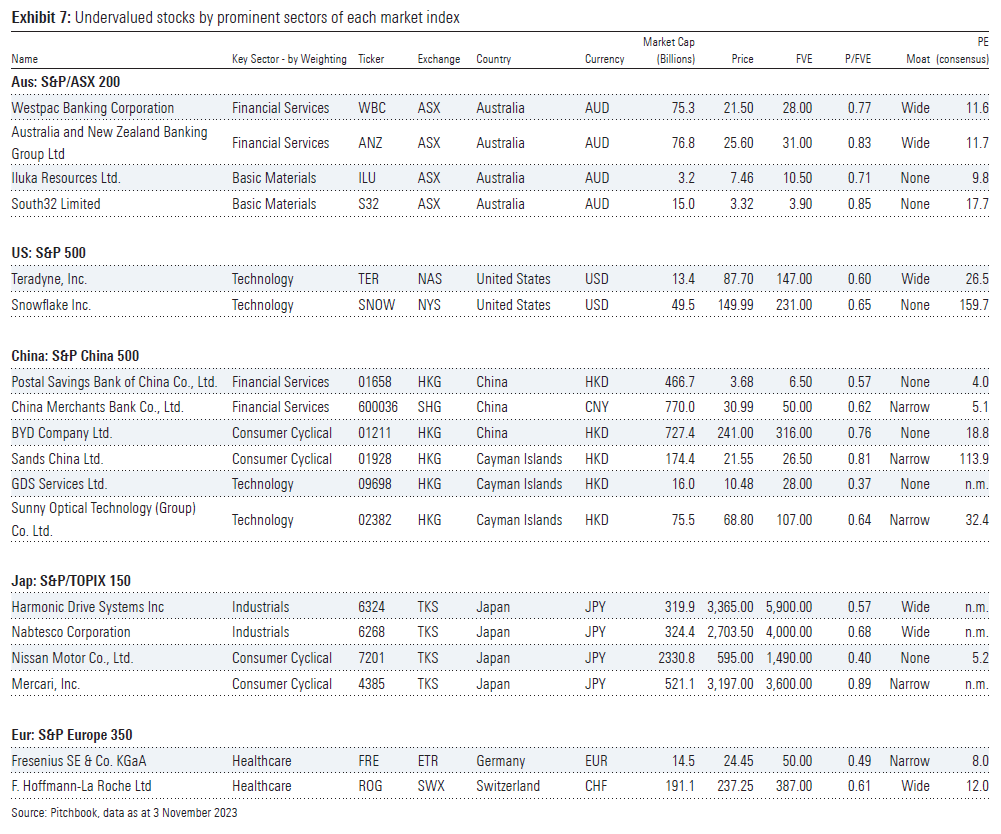
In the first instance, the list is filtered to prioritise stocks from Morningstar’s Global Best Idea List. Where we do not have such Best Ideas in the prominent sectors of each market, we have included stocks trading at the largest discounts to our analysts’ fair value estimates.
A pretty eclectic group of undervalued stocks on this list, starting with two prominent major banks on one end of S&P/ASX 200 barbell (Westpac, ANZ) and two lesser-known miners on the other end of the barbell (Iluka, South32). We have two smallish stocks for technology exposure to the US S&P 500 (Teradyne, Snowflake), not surprising given the elevated multiples of the larger-cap US tech stocks.
There is a bunch of cheap-looking stocks in China’s key sectors for those willing to traverse the wild side of emerging market investing.
Exposure to Japan’s big industrial sector is represented by Harmonic Drive Systems (gears or speed reducers) and Nabtesco (motion control technology), while Nissan (carmaker) and Mercari (second-hand good trading platform) provide exposure to Japan’s equally significant consumer discretionary/cyclical sector.
As for exposure to Europe’s sizable healthcare sector, shares in Fresenius (dialysis, injectable therapies) and Roche (biopharma, diagnostic) screen as undervalued.
However, the key message in this report is the value of knowing the index weightings of different global markets. It not only informs an investor about the key sectoral influences on each market, but serves as a roadmap on where to look to gain meaningful exposures to desired industries. Go fish where the fish are, not where you happened to set up camp.