
Setting expectations
To answer the headline’s rhetorical question, Mr. Buffett can indeed predict the future of the stock market, just as Glendower can call spirits from the vasty deep. However, Hotspur’s response to Glendower remains salient: “Why, so can I, or so can any man. But will they come when you do call for them?” (In a dissent, Justice Scalia borrowed this same Shakespeare snippet more than 30 years ago.)
The spirits certainly will not materialise if summoned to forecast the stock market’s intermediate-term changes. That mission cannot be accomplished. Traders sometimes can exploit immediate movements in an individual security’s price, especially through high-frequency techniques, but they cannot consistently foresee what will happen to the entire market over the next several months.
That, however, is not Buffett’s aim. His formula establishes an expectation, not a trading recommendation. Said Buffett, in a Bloomberg article that is no longer available (my source is secondary), “The economy, as measured by gross domestic product, can be expected to grow at an annual rate of 3 per cent over the long term, and inflation of 2 per cent would push nominal growth to 5 per cent.” From that figure Buffett adds stocks’ dividend yield. The final equation: Stock total returns = GDP growth (3 per cent) + inflation (2 per cent) + dividend yield.
(This prescription is a rule of thumb, as opposed to a carefully derived solution. Otherwise, Buffett would surely have made corporate profitability the first term of his equation, because profits ultimately drive equity prices more than GDP performance. For example, annual real GDP growth during the 2010s averaged a modest 2.3 per cent, while aggregate profits for S&P 500 companies doubled. Clearly, equity investors responded to the latter news, not the former. )
The longer, the better
A quick glance at the chart below illustrates how poorly Buffett’s formula performs when misapplied. The graph depicts the annual total returns of large US stocks from 1930 through 2018, compared with the projection from Buffett’s method, using his plugs for GDP growth and inflation, plus the dividend yields that were then prevailing.
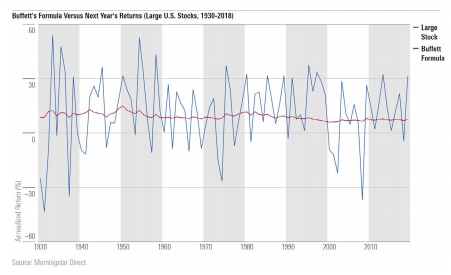
Such was to be expected from an approach that varies only a single slow-changing input. A genuine attempt to predict 12-month returns would incorporate much more volatility. But of course, picking next year’s winners was not Buffett’s goal.
Let’s give his method a fairer test. The dividend yield for large US stocks in 1930 was 3.58 per cent. Adding 5 percentage points for GDP growth and inflation produces a projection of 8.58 per cent. How does that forecast match up against what the stock market delivered from 1930 through 2018? (Never mind why the calculation ends in 2018 rather than 2020; that is a long story, and fortunately also immaterial, as two years’ worth of average returns have no effect on the underlying tale.)
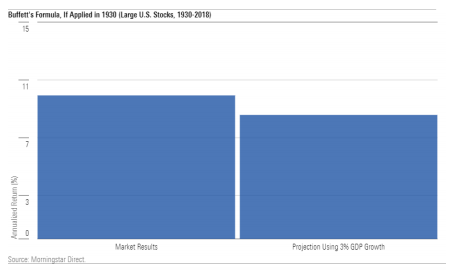
That’s better, but not great. Buffett’s projection understates future stock market total returns by 135 basis points per year. However, most of that difference washes out, because it owes to inflation being higher than Buffett’s approximation. He assumed 2 per cent, but over that 89-year stretch inflation averaged 3.13 per cent, thereby boosting stock prices by 113 basis points. Remove the effect of inflation, thereby making the returns real, and Buffett’s projection almost exactly matches reality.
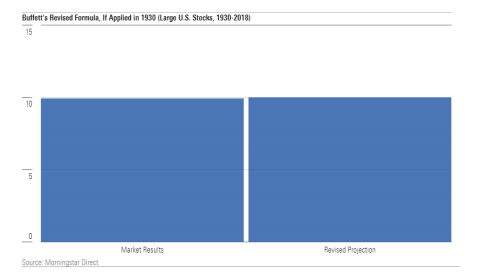
Using actual GDP growth rather than the 3 per cent plug also improves the forecast, although only modestly, because GDP growth was quite close to Buffett’s assumption, averaging only slightly over 3 per cent. Revising Buffett’s estimate by applying actual inflation and GDP growth leads to a 1930 estimate for future stock returns of 10.00 per cent, only 7 basis points removed from what occurred.
Rolling Time Periods
So far, so good. However, only the very fortunate among us possess a ninedecade time horizon! To be of practical value, Buffett’s heuristic must inform about considerably shorter time periods–say, one decade. My first study therefore evaluates 10-year periods. The blue line represents Buffett’s projection, while the red line depicts future 10-year performance. Thus, for the point labeled 1930, the projection occurred during that year, while the returns date from 1930 through 1939.
For this exercise, I attempted to employ what information would have been available to investors at the time. Thus, I used the prevailing dividend yield and the 3 per cent real GDP assumption. However, as I felt that it was important to account for different inflation regimes, I used future inflation for the projection, as opposed to Buffett’s 2 per cent plug. My approach, obviously, is unrealistic. It would have been better to have entered inflation expectations, as implied by the prices of Treasury Inflation-Protected Securities, but those numbers were not available during most of the period.
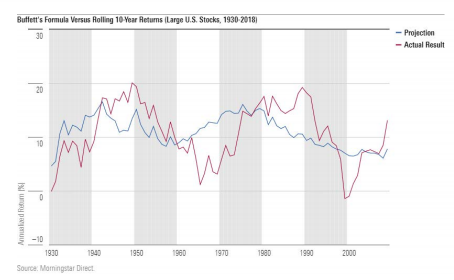
Hmm. I give that result a C, by the grading standards to which Buffett was raised, meaning a B+ today. (The average GPA at my alma mater was 3.44 when last reported.) On the bright side, the Buffett-formula projections were roughly in line with what followed. However, on several occasions they were off by more than 5 percentage points per year. Nor did they reliably reflect the upcoming trend, by being relatively high before stock performed well (or vice versa).
I then assessed rolling 30-year periods. As one would expect, those projections more closely matched reality. That is, they did for the beginning and end of the study period. In the middle section, during the late 1940s and early 1950s, the projections were much too high, because they implicitly assume that the inflation of the 1970s would eventually flow into stock prices. That was false; stocks adjust well to expected inflation, but not when price hikes come as a surprise.
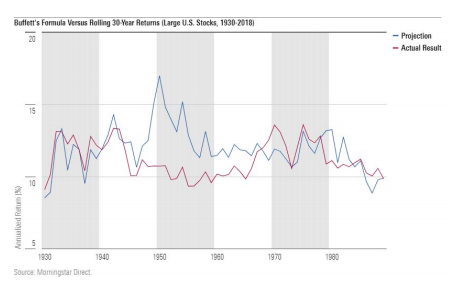
In fairness to Buffett, using future inflation as an input was my idea, not his. But the picture would have been no prettier had I stuck with his original formula, because sometimes a higher inflation rate does increase stock prices. No matter how it is implemented, the Buffett formula struggles when inflation is high and unpredictable. Best under such circumstances to eliminate the inflation component altogether, opting instead to calculate a real expected return.
Looking forward
At any rate, today’s application is straightforward. The 3 per cent real GDP growth estimate remains valid, if slightly optimistic; the break-even inflation rate on 30- year TIPS is 1.86 per cent; and the S&P 500 yields 1.75 per cent. Entering those figures into Buffett’s formula gives a future expected return on large US equities of 6.6 per cent, if expressed in nominal terms, and 4.75 per cent in real terms. By now, it has become a cliche for pundits to proclaim that past stock market returns of 10 per cent should no longer be expected, and therefore standard practice for investors to disregard such counsel.
However, past stock market returns of 10 per cent should no longer be expected. At least not if inflation remains dormant.
John Rekenthaler ([email protected]) has been researching the fund industry since 1988. He is now a columnist for Morningstar.com and a member of Morningstar’s investment research department. John is quick to point out that while Morningstar typically agrees with the views of the Rekenthaler Report, his views are his own.