
Senator Jane Hume is treading on ground where many other Liberal warriors were buried at the dispatch box. Whatever you think of Paul Keating, few have matched his devastating one-liners which will live long in the annals of Australian politics. There is even a Paul Keating Insult Appreciation Society on Facebook with 64,000 members. He told John Hewson in 1992: “I want to do you slowly.” In 1984, he said of Andrew Peacock: “Put him down like a faithful old dog” and in 2007, for John Howard, it was: “The little desiccated coconut’s under pressure.”
To give Ms Hume her full title, she is Assistant Minister for Superannuation, Financial Services and Financial Technology, and leads the Government’s prosecution on super policy. And to also give Ms Hume full credit, she is giving as good as she gets in response to Mr Keating at the moment, although he no longer has the benefit of a parliamentary display platform to fully perform his tricks.
Jane Hume and Paul Keating are kicking around a favourite political football, superannuation, but what’s the score at half time?
The scoreboard on early access to super
Treasury initially estimated that $29 billion would be withdrawn from super when the early release was announced in response to COVID-19. With the scheme now extended until the end of 2020, the estimate has been revised to $42 billion. Around 2.6 million people have used the scheme, with 620,000 emptying their super accounts completely. Here is progress to 9 August 2020 according to APRA, reaching $32 billion with the average payment of $7,700 and 97% of applications approved.
Value of applications (cumulative)

What is Hume versus Keating about?
Wherever Paul Keating goes in politics, controversy and sport are sure to follow. He’s not a man with uncertain views, but nor is Hume a woman afraid to defend her policies.
Here’s the rub. In response to the pandemic, contradicting the previous firm policy to lock up super until retirement, the Government and Hume are prosecuting the view on super that “it’s your money”. That is, people are entitled to access it early if they need to.
Consider this interview with Laura Jayes on Sky News on 21 April 2020.
Jayes: Is there a chance here that if we do see a lot of young people take up this offer of essentially $20,000 of early money from their superannuation, does it weaken the system years down the track and is that just putting off a problem for another day?
Hume: Well, we think people are best placed to make those decisions themselves and you’ve got to think about the counterfactual. What would be the effect of leaving that money in superannuation but not being able to pay your mortgage, not being able to pay off a credit card, having to sell something like your car just to get by? So it really is a decision for individuals. We’re certainly not encouraging people to take up the offer but we’re giving them the option to make an assessment about their own financial situation, their own family budgets.
So the money belongs to the investor and if they need it for “their own financial situation, their own family budgets”, they are entitled to have it.
Keating calls this “generational theft”. He spoke at a virtual conference run by Industry Super Australia on 4 August 2020:
“It is a breach of the preservation rules to just let anyone take out their money willy-nilly. There has been no scrutiny whatsoever … The whole point of superannuation was a great public bargain with the community: defer consumption for your working life and you will get a very low rate of tax.”
Keating argued that much of the money was probably spent on discretionary items such as cars, boats and motorcycles, and the long-term savings of young Australians are now compromised. As others have argued, the people who needed money could have been protected by the right fiscal policy:
“Every dollar which came out of young peoples’ super balances could have been funded by one press of the computer button at the Reserve Bank.”
Hume responded in interviews and on Twitter, repeating the “it’s your money” mantra.

In an interview with The Australian Financial Review on 12 August, Ms Hume said:
“The idea that the wagons need to be circled around one sector in order to protect one man’s legacy – especially in a time of crisis – is obscene [and] irresponsible. It demonstrates a fundamental misunderstanding of the system he supposedly set up.”
She argued that access to super had always been available on compassionate grounds. She also criticised the super system generally with another slight at Keating:
“Fees are too high; there are insurances being applied inappropriately that are eroding peoples balances; there are duplicate accounts out there and a tail of underperforming funds; and many of those problems are directly correlated with the origins of superannuation in the industrial relations system.”
Studs up in the tackle, Keating says access is ‘willy-nilly’ theft and Hume says protecting his legacy is obscene. Who has the scars?
Was access ‘willy-nilly’?
One clear point of difference between Hume and Keating is his claim that locking super away until retirement is severely compromised by the ease of access, whereas Hume argues it was more an extension of the existing compassionate grounds.
Qualifying for early release requires a loss of job or reduction in working hours of at least 20% since 1 January 2020. While this sounds like a high bar, the lax part was not so much these tests but the simple online application process with no vetting.
The ATO confirmed the online access was easy. Second Commissioner Jeremy Hirschhorn told a Senate committee that the ATO did not check eligibility due to the dire circumstances around the pandemic:
“This is about getting emergency money to people. We will never have enough information to reject quickly, we will give people their money on the basis of their say so.”
So the ATO assumed people were honest. Brave. The Government does not trust people for anything relating to social security, where pensioners are subject to close scrutiny and checks. After the initial flurry, the Government issued warnings about compliance and penalties, but it did little to halt applications. Hume continued to defend the system and the applicants, saying:
“Australians who have made the decision to access their super early can rest assured that the Morrison government trusts them. They understand that withdrawing some money now comes with a trade-off down the track—but the decision is theirs.”
This is a long way from the previous tightly controlled compassionate access, to say it’s a matter of trust and “the decision is theirs”. Applicants declared their eligibility on an ATO website to receive payment a few days later from their super fund.
Whatever happened to super’s objective?
Remember the good old days – if 2015 can be called old – when most people supported the objective of superannuation. David Murray’s Financial System Inquiry had recommended that:
“the objective of the superannuation system is to provide income in retirement to substitute or supplement the age pension.”
In October 2015, the Liberal Government announced it would enshrine the objective in legislation, it issued a discussion paper in March 2016 and by November 2016, the Superannuation (Objective) Bill 2016, was introduced.
Then it stalled. The years have rolled by, including regular beseeching to put it back on the agenda, to no avail. We are now further away from defining the objective than five years ago.
And let’s not forget the sole purpose test
To quote directly from the ATO website’s SMSF section on the sole purpose test:
“Your SMSF needs to meet the sole purpose test to be eligible for the tax concessions normally available to super funds. This means your fund needs to be maintained for the sole purpose of providing retirement benefits to your members, or to their dependants if a member dies before retirement.
Contravening the sole purpose test is very serious. In addition to the fund losing its concessional tax treatment, trustees could face civil and criminal penalties.”
That’s unambiguous. The fund is maintained to provide retirement benefits.
What was the money spent on?
The most frequently quoted data tracking the use of early super withdrawals comes from consulting firm AlphaBeta (part of Accenture) and credit bureau, illion. They claim that 40% of people who accessed super early had experienced no fall in their income during the COVID-19 crisis, and only 22% in Round 1 and 24% in Round 2 of withdrawals were spent on essentials. Discretionary items included gambling (11% of money spent) and clothing (10%), while 12% in Round 2 was for debt repayment, as shown below. Hume has disputed these results.

The ABS has produced separate data on the way stimulus payments such as JobKeeper have been used.

Notwithstanding the lack of firm evidence, no doubt much of the money directed at retailers such as Kogan and JB Hi Fi, who have experienced rapid increases in sales in recent months, came from both stimulus spending and people accessing their super.
Three implications of the early withdrawals
What are the consequences of this early access? Here are three:
1. Decline in total super in the system in future
Early access to super will compound the adverse impact of COVID-19 on future super balances, with BetaShares estimating the $30 billion withdrawn to date will reduce future balances by over $100 billion:
“An amount between $100 billion and $130 billion represents a very significant future shortfall (which will only increase as further super is released early). It will need to be funded by future Australian governments and therefore the Australian public will ultimately bear the cost, as those who have withdrawn super will be less able to fully fund their own retirement needs.”
Other estimates place this in a broader context of future super reductions due to COVID-19. Current superannuation balances are about $3 trillion, and Rainmaker previously projected retirement savings would reach $10 trillion over the next two decades. Their Superannuation Projection Model has now revised the number to $7 trillion due to the virus, including the impacts of rising unemployment, lower super contributions, lower long-run earnings and reduced population growth.
The early release is only one factor but Alex Dunnin, Executive Director of Research and Compliance at Rainmaker, said:
“This lower projected outlook for superannuation savings could have significant economic consequences on Australia if it is not carefully managed.”

2. Lower personal superannuation balances
Writing in Firstlinks when the early release policy was announced, and assuming savings grow annually at a rate of 3% above inflation less 0.5% administration fees, David Bell calculated the withdrawal of $20,000 has a different impact depending on age. A younger person at 30 loses $50,000 in their retirement balance.
| Current age | 30 | 40 | 50 | 60 |
| Reduction in retirement balance | $50,000 | $39,000 | $30,000 | $24,000 |
The estimates obviously depend on the assumptions and it’s easy to derive bigger numbers. For example, BetaShares reports:
“Based on an annual growth rate of 5% plus CPI, $10,000 withdrawn today becomes a $70,400 nest egg over 40 years. When an average annual rate of 7% plus CPI is used, this increases to $149,745.”
Either way, the predominantly young people withdrawing their super will miss out on compounding over so many years that their super balances will face a big hit.
3. Changes in the management of large super funds
Large super funds, especially industry funds which rely on large numbers of small investors locking in their super until a gradual drawdown in retirement, must now factor in far greater likelihood of withdrawals. If governments believe “it’s their money” then any crisis could lead to further relaxation and access.
As David Elia, Chief Executive of industry super fund, Hostplus, said:
“This has created a form of regulatory risk in the super system that we’ve probably never seen before, and now we’re completely aware of and cognisant of.”
Keating added to his earlier comments that the early access scheme had a “distortionary” effect on investment management by forcing funds to hold more cash.
Industry funds were previously able to hold a higher level of illiquid assets such as unlisted property, infrastructure and private equity than retail funds, and now must be recalibrating their portfolio tolerances for greater liquidity.
‘It’s your money’ versus lockup
Anyone sitting in the ivory tower of a well-paid job and a paid-off mortgage during the pandemic should not judge the struggler who withdraws their super to pay the rent, feed the family or fix the car.
Unfortunately, it is the people with the least in super who are less financially literate who will be left with less in retirement savings. Where the money is used for short-term wants rather than needs, they are doing themselves a disservice. Even if in future they are likely to qualify for the age pension, they should supplement reliance on government support with other assets while drawing a pension. And nobody knows how generous or otherwise the age pension will be 20 or 30 years from now.
Compulsion and tax advantages are usually necessary to make people save for retirement, and Australia has a system recognised as a role model around the world. It included highly-restricted access before retirement, and there will be other crises in coming years where super might be opened again.
Ideally, the Government could have recognised the genuinely needy during the pandemic and set up another scheme to assist them without invading their super. “It’s your money” flies in the face of the strict access rules we have accepted since 1992, and many are compromising their future in exchange for current consumption.
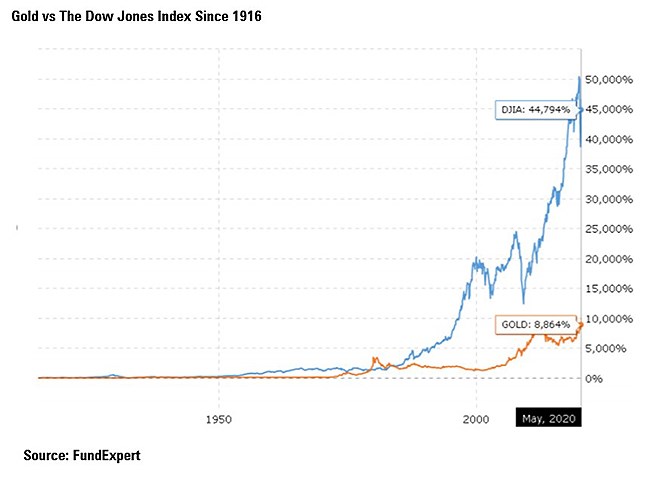
Gold has hit a record high and investors have poured billions into gold tracker funds. But should you invest? Probably not.
It’s little surprise that gold is attracting a lot of investor attention. The price of the lustrous yellow metal recently hit a record high and it’s never been cheaper to invest in the asset. This isn’t the first time that investors have found themselves drawn to something shiny, however. With a reputation as a safe haven at times of uncertainty, gold tends to rise at times when other assets are falling.
Mike Coop, portfolio specialist at Morningstar Investment Management, says: “People have a deep rooted, emotional response to gold. You can see that in how we refer to it in everyday language: good as gold, gold-plated, gold-class. We think of gold as safe, secure and as being the best and that impacts how people view it in investment terms too.”
Yet despite its allure and popularity, some experts say that holding gold is not a sensible investment move – particularly after its recent climb. Here are just some of the reasons not to invest in gold.
Gold is not a safe haven
A safe haven is an asset which holds its value – or increases in value – even in times of uncertainty. Does gold meet that definition? Probably not. Because, while gold sometimes (but not always) rallies during downturns, it tends to lose those gains during better times.
Brian Dennehy, managing director of FundExpert, points out: “Between 1980 and 1982, the price of gold fell 52 per cent. Between 2011 and 2015, it fell 42 per cent. This is not how a safe haven behaves.”
Some might say, instead, that a safe haven protects your money from the erosive effects of inflation. But Dennehy says this has also not played out with gold; he calculates that taking inflation into account the gold price tumbled 83 per cent between 1980 and 2001. And if protection from inflation is a main reason to choose gold, then now is clearly not the time to invest – currently, deflation is a bigger risk than rampant inflation.
Gold is driven by speculation
The stock market is, the old saying goes, in the short-term a voting machine and over the long-term, a weighing machine. So, although share prices may fluctuate for various reasons – panic, euphoria, fashion – for a short period, in the end it is fundamentals that win out.
Over the long-term, the success of a business will be determined by fundamental factors such as profits, return on invested capital, and how it treats shareholders. The same cannot be said of gold.
Because gold doesn’t pay dividends or make a profit or loss, its price is only determined by investor sentiment. If it is in demand, the price goes up, if it is out of favour, the price falls. Coop says: “That means you’re simply relying on other people to be prepared to pay a higher price for an asset than you did.”
While it may be possible to guess which way that trend will go in the short-term, this is speculating not investing. A glance at the performance of the US stock market against gold since 1916 suggests that investing based on fundamentals tends to reap greater rewards.
Gold is not a currency
The main reason many people invest is to get an income. Dividend-paying equities and reliable bond yields produce pay outs that can be rolled back up into your investments, or drawn down to pay the bills. Whether it’s an ETF that tracks the gold price or bullion kept in a vault, gold patently does not pay an income.
Some would argue, instead, that the precious metal is a safe, physical store of value to be used when the going gets really rough. But there are problems with this argument, too. The idea of gold being traded and used in place of traditional currencies hinges on an almost apocalyptic scenario.
Coop says: “You can’t buy your fish and chips with a lump of gold, and a lot of pretty extreme things would need to play out for people to abandon their own currency and use gold instead. It’s a low probability game, and you’re a bit late if you decide to play it after the price has climbed so high.”
Dennehy adds: “If you really believe an apocalypse is likely, you should grow you own food, invest in two goats and live near a reliable and remote water source.”
What are the alternatives to gold?
So, if gold isn’t an insurance policy for your portfolio, what is? “It’s a good question and one that is vexing a lot of people right now,” says Coop. Arguably the best insurance policy is not any single asset but rather to hold a well-diversified mix of investments.
He says high-quality government bonds have done a great job in protecting investors from falling stock markets. Currencies such as the yen and US dollar are often touted as safe havens, but FX trading requires specialist knowledge and can be incredibly risky, he adds.
Dennehy says would-be gold investors might do better to consider stocks in gold mining companies instead of the metal itself, and Coop points to cyclical sectors that tend to do well when inflation rises such as banking and energy.
“Infrastructure is another asset class worth looking at. It’s linked to inflation and demand for this type of service is not very cyclical – the water and electricity is the last thing you switch off,” Coop adds.
This article originally appeared on the website of Morningstar UK.
Rebalancing your portfolio is one of those beneficial habits—like flossing every day or dusting under the refrigerator—that’s easy to let slide. But if your portfolio’s equity exposure crept up over the past few years, the sudden market correction in February and March was a harsh reminder of why it’s a good idea.
In this article, I’ll look at how different rebalancing frequencies have paid off in 2020’s turbulent market, as well as during other market drawdowns. In a nutshell, any rebalancing strategy works far better than none at all, especially when it comes to risk control.
Running through the data
Previous studies have generally found that rebalancing a portfolio at least once a year, or when the stock/bond split drifts significantly away from target levels, can help moderate volatility and keep downside losses in check. I set up a simple balanced portfolio composed of a 60 per cent weighting in stocks (S&P 500) and a 40 per cent position in bonds (Bloomberg Barclays US Aggregate Bond index). As did my colleague Adam Millson for a previous study, I used a starting date of 1 January 1994, and tested various rebalancing frequencies, as well as a static buy-and-hold portfolio. I also looked at a threshold rebalancing strategy that set 5 per cent bands around the starting weights, triggering rebalancing whenever the stock or bond weighting moved at least 5 per cent higher or lower than the target level.
Not surprisingly, the buy-and-hold portfolio felt the most pain during the COVID-19 correction in February and March 2020. Simply letting the stock and bond allocations drift over time would have led to an equity weighting of close to 80 per cent heading into 2020. This equity-heavy posture resulted in the heaviest losses during the market drawdown, with a 27.8 per cent portfolio loss from Feb. 19 through March 23.
Returns in market downturns
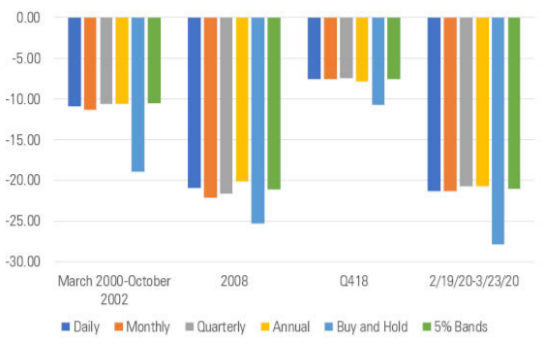
Source: Morningstar Direct, as of 5/31/20.
The other rebalancing strategies all had roughly similar results, with losses ranging from 20.67 per cent (for quarterly and annual rebalancing) to 21.34 per cent (for daily rebalancing). Results for the daily and monthly rebalancing strategies were
a bit worse because investors would have been repeatedly “buying the dip” even during periods of sustained losses. These results were similar to those shown in the fourth quarter of 2018, even though overall market volatility (as measured by the VIX index) was significantly higher in 2020.
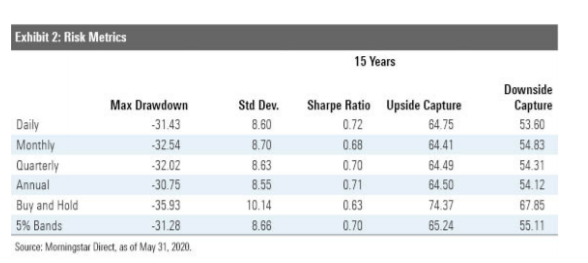
Risk control
With more limited losses during market downturns, all of the rebalancing strategies did a decent job buffering volatility, with average standard deviations roughly 15 per cent lower than the buy-and-hold approach. Overall, annual rebalancing did the best job keeping risk in check, with an annualised standard deviation of 8.55 per cent over the past 15 years. The annual rebalancing strategy also had the lowest downside capture ratio of 54.12 per cent.
Long run returns
Rebalancing isn’t intended to boost returns, but there were some notable differences in performance. Because market trends tend to be at least somewhat persistent (at least in the short term), one might think that letting winners ride through the buy-and-hold strategy would lead to better results. And in fact, that strategy did result in the best annualised returns over the trailing 10 years through May 30, 2020. Even though that period includes the COVID-19 correction, investors who didn’t rebalance would have still had a fair amount of equity exposure as
of late March, when the market started bouncing back. Investors who let their allocations ride would have had an average equity exposure of about 70 per cent during the trailing 10-year period, which paid off during the mostly uninterrupted bull market. Even over the trailing 15-year period, which includes the 2008 downturn during the global financial crisis, was strong enough for stocks overall to give the buy-and-hold strategy an edge.
Other periods weren’t so kind to the lax approach. In fact, over the trailing 20-year period, it posted the weakest annualised returns of any strategy. Investors who opted out of rebalancing would have headed into the tech correction in March 2000 with a 79 per cent equity weighting, which dragged down returns until the market started reversing course more than a year and a half later.
Even over the entire period since 1994, the buy-and-hold approach didn’t pull ahead with higher returns compared with an annual rebalancing strategy. While these results are time-period dependent (in other words, choosing a different starting date would lead to different results), it’s worth noting that the buy-and- hold approach doesn’t guarantee better total returns, even over the longest time periods.
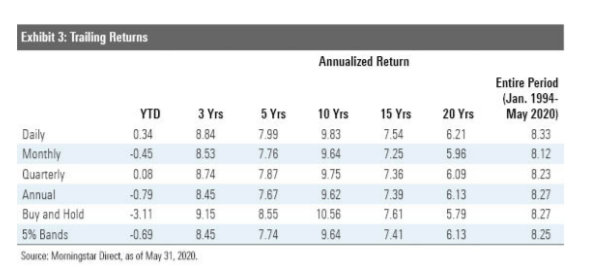
Oddly enough, daily rebalancing pulled out ahead with above-average returns over most time periods. This rebalancing frequency is pretty impractical for most individual investors (unless you have a lot of extra time on your hands and have already organised your sock drawer and worked through your Netflix queue).
Trading issues are another consideration. While commission-free trades are now widely available, daily trading isn’t completely friction-free. Mutual fund trades will typically settle the next day, but trades made with exchange-traded funds won’t settle until two days after the trading date. It’s therefore impossible to reallocate rebalancing proceeds immediately unless you maintain a separate cash account for that purpose. For taxable accounts, daily rebalancing will also result in more- frequent realised capital gains.
Risk-return trade-offs
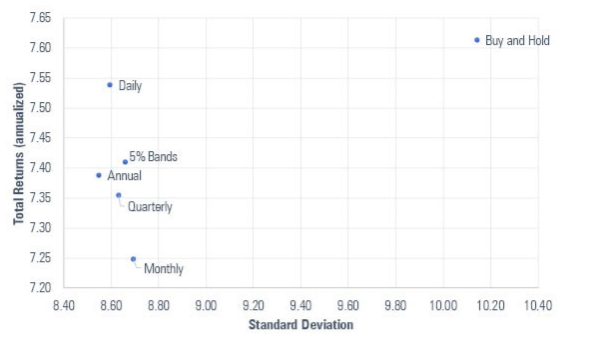
Conclusion
The graph above puts the trade-offs of different rebalancing frequencies into stark relief. As discussed above, no rebalancing at all results in far higher levels of portfolio volatility. All of the other rebalancing frequencies led to similar reductions in portfolio volatility and improved risk-adjusted returns (as measured by the Sharpe ratio) over the trailing 15-year period. The key take-home point is that any type of rebalancing strategy works far better than none. The differences in results between the other strategies aren’t really big enough to lose any sleep over, but annual rebalancing has a slight edge for risk reduction, while a threshold rebalancing strategy pulls out ahead when it comes to upside
This article is general information and does not consider the circumstances of any investor. Minor editing has been made to the original US version for an Australian audience.
On 23 March 2020, Afterpay (APT) traded at a low for the year of $8.01 and 18.8 million shares changed hands. On 3 July 2020, Afterpay hit $70, a rise of almost 800% in only three and a half months. That’s a lot of winners and losers in a short time. When the history of the amazing investing year of 2020 is written, Afterpay will be the feature stock. Co-founders Nick Molnar and Anthony Eisen both own 20.5 million shares or about 8.1% of the company, worth nearly $1.5 billion each at $70. The 30-year-old Molnar is currently Australia’s youngest self-made billionaire, pipping the 32-year-old Melanie Perkins, the co-founder of graphic design platform Canva. With a market capitalisation around $18 billion, Afterpay is an ASX Top 20 company.
Afterpay share price, 1 January to 5 July 2020

Source: Morningstar Direct
Afterpay was founded in 2014 and listed on 4 May 2016 at $1, ending its first day at $1.25. It had received $8 million in private investment prior to the float, including backing from Ron Brierley’s Guinness Peat group, where Eisen had been Chief Investment Officer. Don’t kick yourself for not buying in the float. In the first half of 2016, Afterpay had revenues of only $220,000 and underlying merchant sales were about $3 million a month with 60,000 customers. It now has almost 10 million customers and adds them at 10,000 to 20,000 a day.
The business model, called Buy Now Pay Later or BNPL, is simple. Someone can own a $200 pair of sneakers immediately by paying four fortnightly instalments of $50 with no interest or fees if they pay on time. Merchants are charged a transaction fee as a percentage plus a flat fee, but most promote the product because it increases sales and Afterpay takes the credit risk.
My investment experience and valuing Afterpay
Afterpay has taken thousands of retail investors on a ride few will experience again, leaving behind the most astute professional investors in the country. Relatively few fund managers believe in the value. On 23 June 2020, Morningstar published an article called “Buy now, regret later? How Afterpay is dividing punters and pundits” showing most fund managers are underweight.
A few weeks ago, I mentioned to a colleague that Firstlinks was publishing an article on the estimated value of Afterpay, and he said, “Don’t tell me, I hate that company.” Imagine the mood of the people who sold at $8.01 a few months ago.
How do I feel having dabbled a mere $10,000 in Afterpay in December 2017, selling most of my shares along the way, and turning it (at the moment) into a ‘profit’ of $50,000 when it could have been $130,000 if I had held on?
Here are my Afterpay transactions. You might think a profit of $50,000 is nothing to sneeze at, but it feels like a shallow win.
![]()
So two guys half my age make $3 billion and are in the process of selling 10% of their holdings for $135 million each, and thousands of other people have made small fortunes, while I make a lousy $50,000 on a 70-bagger stock (floated at $1, now $70). I realise $50,000 is better than a poke in the eye but it’s not much of a result for investing in the biggest stock market success of the decade.
I’m not a stock trader. I’m a ‘buy-and-hold’ sort of chap. I prefer the Warren Buffett guidance to ‘only buy something that you’d be perfectly happy to hold if the market shut down for 10 years‘. So the dalliance with Afterpay in the past couple of years is not my usual style. Normally, I couldn’t be bothered trading smallish amounts, but Afterpay is no normal stock.
It’s not possible to value this company on normal metrics. Investors must believe the growth story. Morningstar analysts estimate a fair value of $24.10, with an uncertainty rating of ‘very high’. Citi recently upgraded its target from $27.10 to $64.25. UBS gave it a value of $17 last year then downgraded it to $13 with a ‘sell’ recommendation and more recently to $27. The bulls are Morgans at $68.58, Macquarie at $70, Bell Potter at $81.25 and as we go to press, Morgan Stanley at $101. Like, who knows? The chart below shows the rise since Morningstar initiated coverage with Afterpay heading into overvalued territory.
Morningstar Price versus Fair Value Chart for APT, as at 5 July 2020

Social media is alive with frustrated investors who cannot accept what has happened, and an equal number of true believers.

What are the lessons from this experience?
I’m not a stock analyst but here are some lessons to ponder:
1. Watch your anchoring biases
‘Anchoring’ is a major tenet of behavioural finance whereby an investor places too much emphasis on some prior information or number. I remember thinking when I first sold 500 shares that it would pay for the initial 2,000 shares, covering me for whatever happened in future. The $14.87 sale in March 2020 was influenced by the $8 price a few days earlier, and the $49.45 sale was based on a notion of a $50 ceiling. Even professional investors have arbitrary rules for selling but a stock like Afterpay brings out behavioural biases when there’s not much else to cling to.
2. Discover an information edge
When a stock trades between $8 and $70 in a few months, it shows the market is far from an efficient pricing machine. However, there are times when you might discover something about a company that may not be fully factored into the price, or at least give you more confidence. During my Christmas shopping in December 2017, I was amazed how many stores had an Afterpay sign next to the cash register. ‘Afterpay it’ seemed more common than Amex or Visa. Some stores, such as Rebel Sports, included an Afterpay promotion on every display unit throughout the shop. I asked a friend who was a senior executive in a top-end sneaker business whether Afterpay was popular, and he said about one-third of buyers used Afterpay. One third! I’m not saying the market was unaware of Afterpay’s rapid growth by December 2017, but did it fully allow for younger generations embracing the BNPL idea?
3. Look for companies that customers love
Successful investors look for unique data sources, and scouring the internet for customer feedback is a good measure of repeat business potential. One such source is Trustpilot, and here is a summary of their Afterpay user reviews plus a typical comment (putting aside the merit of people buying things they cannot afford).


4. Check what is happening on Google Trends
Another non-traditional data point is Google Trends. This is available to anyone, and its use should not be confined to professionals doing thorough research.
Here are the results over the past five years for the word ‘Afterpay’. It has been surprisingly steady for a couple of years but a close watch would have revealed it coming to prominence over 2017.

5. Find companies that other businesses promote
This is a variation on a ‘network effect’, where the more people who use a product, the more valuable a business becomes. As Afterpay adds users, more retailers are compelled to join as customers are attracted to the payment method. Over the last year, merchant numbers have increased from 32,300 to 55,400.
Thousands of retailers not only allow Afterpay, but openly sing its praises, which leads to new customers, and more praise, and on it goes. Consider this from a US retailer, Outerknown:
“Afterpay is a service that allows us to offer our customers the ability to make purchases now and pay for them in four equal installments, made every 2 weeks, without any interest.
Just shop Outerknown.com and checkout as usual. At checkout, choose Afterpay as your payment method. You will be directed to the Afterpay website to register and provide payment details (Visa or Mastercard). If you’ve used Afterpay before, just log into your Afterpay account. Then complete your order — it’s that easy.”
Wow. “It’s that easy.” Free promotions like this are better than paid advertisements.
Register here to receive the Firstlinks weekly newsletter for free
6. Check when a company is embedded in another’s process
Afterpay is now embedded into the payment processes of thousands of businesses, in the same way it took Visa and Amex decades to achieve. The move to more buying online is another positive. The Afterpay purchase process is tempting to users about to pay for $200 when on the payment page, they are asked if they would rather pay $50 now and $50 a fortnight, at no added cost.
Similarly, when a company embeds an IT system or platform into its own processes, it is often a major exercise to unravel and change to another supplier. Inertia and routine are powerful ways to retain business.
7. ’You never go broke taking a profit’ is poor advice
Most listed companies are not successful over time, either disappearing or underperforming the index. Ashley Owen’s article, ‘99% of listed companies disappear worthless’ is a stark reminder that investors need strong winners to make up for inevitable failures. A better saying might be ‘Let your winners run’, although there are many examples of companies which have won in the short term and crashed over time. For example, a former market darling, Axsesstoday (AXL) rose strongly in 2018 from $1.50 to $2.50 then quickly went into voluntary administration, leaving the shares worthless and paying bondholders less than 30 cents in the dollar.
These trading rules are dragged out when they work and ignored when they don’t, but simply ‘taking a profit’ is not a reason to sell a good investment.
8. You don’t need to like the product to invest in the company
I will never use Afterpay and most of my Baby Boomer generation will ignore it, but we’re not the target market, so nobody cares. It’s not simply that my financial circumstances do not require me to pay for items in instalments. At no time in my life if I could not afford $200 sneakers would it make a difference to pay them off over four lots of $50.
I am not keen that a product like BNPL facilitates young people buying things they cannot afford. The Afterpay slogan, ‘Shop Now. Enjoy Now. Pay Later.’ encourages buying using debt. Customers are experiencing near-term gratification when they should live within their means in the same way they should not take on credit card debt. At least the Afterpay debt is required to be paid off quickly, whereas credit card debt is often permanent.
9. Retail Share Purchase Plans are inequitable
The February 2020 Share Purchase Plan allocation of 85 shares costing $1,955 was the most given to any retail investor who applied for $15,000 worth. The retail raising was originally capped at $30 million although they accepted $33 million. At the time of the announcement of the plan, Afterpay advised it “was intended to follow shortly after the successful placement of shares to institutional and professional investors (Placement Shares) which raised $317.2 million (Placement).” That’s 10 times as much for professionals as retail.
10. You don’t need to value a company to invest in it
What’s Afterpay worth? Could be $10, could be $100. Here is Morningstar’s opinion. Arguments about the value of companies fly around fund manager offices every day, but normally, an analyst will produce a detailed spreadsheet with future revenues and costs and a discounted cash flow calculation. Amazon was considered a crazy Jeff Bezos business model for 20 years. Tesla cars rate poorly for quality control but the company is now the most valuable car maker in the world. Valuing is more art than science.
Sometimes, an investor must back their personal judgement, buy into the dream and the growth story and overlook the near-term losses. Venture capitalists and private equity are built on this idea because businesses like Tesla, Canva and Afterpay are not valued on Price to Earnings ratios. Of course, we conveniently overlook that there are far more start-up failures than successes when we swoon over these winning companies.

11. A simple, replicable business is not necessarily a bad business
To the outsider, it seems easy for the PayPals, Mastercards and Visas of the world to introduce a similar model. It’s just a variation on the old lay-by, so why don’t major retailers replicate it? Afterpay doesn’t appear to have much of a ‘moat’ beyond its brand and market penetration, something which many professional buyers look for to protect a quality company.
But when anybody says, “I’ll Google it” or “Get me a rum and Coke” or “Let’s Zoom” or “Whatsapp me” or “We’ll Afterpay it”, you know a business has gone beyond a brand.
Where to from here?
I don’t know what Afterpay is worth. Half my ‘profit’ is on paper and it could disappear or double. I could be writing an article in a year about why analysts’ low valuations should have been heeded.
Of course, there are risks. When a stock is priced for perfection, it’s easier for the halo to slip. The looming economic cliff may lead to a significant increase in unemployment and compromise Afterpay’s strong credit record. Somehow, they have kept bad debts below 1% without thorough credit checks.
At some point, there will be a rotation out of growth stocks into value, and we may look back on tech valuations and shake our heads. But this is not like the tech-wreck of 2000. Tech companies such as Microsoft, Alphabet, Facebook and Apple are quality companies with serious earnings. Clearly, Afterpay is not in their league, but as a Top 20 company in Australia, it’s hard to ignore.
Anyone buying Afterpay at $70 is in for a wild ride, but to date, those who sold after a fall have missed the next run. Those buying into a growth story like this should mentally prepare to hang in for the long haul. For a little diversity, the BNPL theme can be backed in other names such as Sezzle, Zip and Splitit, but they are all part of the same bubble. Splitit listed in January 2019 at 20 cents and traded this week at $1.48.
I’m not even sure what to do with my paltry 385 shares. At least they give me the right to participate in the new Share Purchase Plan announced this week, priced at $66. Any fundamental number crunching is little help at this level. You either believe the growth story, or you don’t.
Graham Hand is Managing Editor of Firstlinks. This article is general information and does not consider the circumstances of any investor. An investment in Afterpay carries a high risk of loss and this article is not a recommendation to buy or sell. Every investor should do their own additional research.
Retirement researchers have been sounding the alarm about the 4 per cent guideline for a while. They’ve noted that the combination of very low bond yields and not-inexpensive equity valuations mean that a starting withdrawal of 4 per cent, with that dollar amount adjusted for inflation in each year thereafter, could cause a retiree to prematurely deplete his or her funds over a 25- to 30-year horizon.
The fact that the current pandemic has forced yields lower still—to just 0.7% on the 10-year Australian Government Bonds as of 21 July 2020—imperils the 4 per cent guideline even further.
In an interview on The Long View podcast, recorded in the US in March 2020, retirement researcher Wade Pfau discussed the case against the 4 per cent guideline. He also shared some thoughts on withdrawal strategies that retirees should consider instead.
Pfau is a professor of retirement income at The American College of Financial Services. This excerpt from the interview has been lightly edited; the entire transcript covers other aspects of retirement planning, including long-term care and what Pfau calls “buffer assets”.
Christine Benz: Wade, withdrawal rates are an important component of retirement planning. The obvious adjustment to make in the face of a declining market would be to reduce withdrawal rates. In fact, you wrote this week that it’s important to understand that the 4 per cent rule does not apply today. Basically, you made a very clear statement. Why is the 4 per cent rule broken in today’s environment?
Pfau: Well, there are a number of factors—people are living longer, and the 4 per cent rule ignores taxes, it assumes investors are not paying any fees on their investments, and so forth. But the biggest driver for what I’m talking about right now is the low-interest-rate environment. Low bond yields mean low bond returns in the future. And there’s not really any controversy about that. It’s a very close mathematical relationship. If interest rates don’t change, today’s bond yields will be the bond returns. And then, of course, if you’re holding bond managed funds, well, if interest rates go up, you’re going to have capital losses, which make things even worse. Or vice versa, if interest rates decrease further, you could have capital gains. But effectively, future bond returns are going to be very close to today’s bond yields. And that means spending from bonds is going to be lower mathematically. And for the 4 per cent rule, it’s based on historical data, and we’ve never seen interest rates this low.
We’re also dealing with this high-valuation environment and historically low interest rates, lower than the 4 per cent rule ever had to be tested by. And so, it’s not as clear how stocks can come to the rescue of bonds in a diversified portfolio. If you just take historical average data and plug that into some sort of financial planning calculator, which is kind of the naive approach that still gets used today, that will be assuming you’re going to have 5% to 6% bond returns in the future. The 4 per cent rule looks like it’s going to work 95% of the time.
But if you just lower returns to account for lower interest rates, and because of this idea of sequence-of-returns risk, even if interest rates normalise later to their historical averages, that’s kind of too late if you’re retiring today. Based on those kinds of projections, you’re going to be looking at the 4 per cent rule working more like 60% to 70% of the time. And that’s usually not the amount of safety people want. If you want the kind of safety of at least getting your strategy to work 90% of the time, the lower interest rates are going to push you toward something like 3 per cent being a lot more realistic than 4 per cent as a sustainable strategy in a low-interest-rate environment.
Benz: You mentioned variable spending, Wade, as a way of potentially addressing these conditions. So, a very crude way to do that would be to simply use a fixed-percentage withdrawal and take the same percentage out of a portfolio every year regardless of what the portfolio value is. But that’s obviously not ideal from a quality-of-life standpoint. So, let’s walk through how one could create a sensible variable withdrawal strategy.
Pfau: What you explained would be the opposite end of a spectrum of extremes. The 4 per cent rule is one extreme. Well, it’s 4% of your initial retirement assets, which tells you how much you can spend. And then you just keep spending that same amount every year and you never adjust based on market performance. There’s always going to be a withdrawal rate, but you don’t care what it is, you just keep spending the same amount.
Then what you described is the opposite end of the spectrum, which is, you just spend a fixed percent of what’s left every year. So, you’re always using the same withdrawal rate every year, but your spending will fluctuate, and it could fluctuate quite dramatically just based on how your portfolio is doing. Those are the two ends of the spectrum.
And then, there’s a whole host of strategies in between that try to develop some sort of compromise between thinking you should make some adjustments to your spending. And that does help manage sequence risk. But you don’t necessarily want to adjust your spending too much. In practical terms, just following the required minimum distribution rules to define spending in retirement, that’s going to be related to the fixed-percentage strategy, but it actually is pretty closely aligned with what academic research shows is the optimal way to spend beyond that as well. So, different advisers have proposed different types of variable spending strategies.
One of my favourites is actually from Bill Bengen—and he’s the one who created the 4 per cent rule initially. But he talked about a “floor and ceiling” approach, where you spend a fixed percentage of what’s left every year, but you decide you’re going to have a floor that you don’t want your spending to fall below a certain dollar amount, and then you have a ceiling where you’re not going to let your spending go above a certain dollar amount. So, as long as you’re within that range, you just spend a fixed percent, but you apply the floor and the ceiling. And this helps to manage sequence risk by adjusting your spending. That floor might not be all that much less than what the 4 per cent-rule logic—always spend the same amount every year no matter what—would have had you spending. So, you have the potential to spend more on average, and even on the downside, you’re not really spending all that much less. That can work very well to help manage the sequence risk. That’s a pretty easy strategy to implement. And I think it has a lot going for it. It’s one of my favourites.
There’s a lot of other strategies out there as well. Jonathan Guyton developed his decision rules with William Klinger that are a lot harder to implement in practice and do call for occasional 10% cuts to the distribution that are permanent. But that could be another option as well.
Benz: That’s a good summary. Before we leave required minimum distributions as maybe a benchmark that someone could use, just talk about the virtues of that. It updates with my age and my portfolio value, and so that is valuable?
Pfau: The academically optimal way to spend is, you’re going to adjust your spending every year to reflect your portfolio value and your remaining longevity. As people age, their remaining life expectancy gets shorter. And so, naturally, people can spend a higher percentage of what’s left as they age. The required minimum distribution rules guide that sort of spending. Now, they are conservative, so you could play around with making them a little more aggressive if you want to spend a bit more aggressively. But generally speaking, that’s what academics are saying: spend an increasing percentage of what’s left every year as you age. And that can be the most efficient way to spend down your assets in retirement. That’s where they get attention as an easy way to implement a more efficient and optimal type of way to spend down assets in retirement.
Christine Benz is Morningstar‘s director of personal finance and author of 30-Minute Money Solutions: A Step-by-Step Guide to Managing Your Finances and the Morningstar Guide to Mutual Funds: 5-Star Strategies for Success. This article does not consider the circumstances of any investor, and minor editing has been made to the original US version for an Australian audience.
If your goal is to look out for your loved ones, consider tackling these estate-planning additional jobs.
Estate planning is the easiest financial planning to-do to put off. It’s certainly not fun to ponder your own mortality, and yet that’s the very nature of estate planning. Lawyers are often involved, so it can be hard to get it done on the cheap. And while most financial planning jobs provide at least some payoff during your lifetime, estate planning isn’t as much for you as it is for your loved ones.
It’s no wonder that so many individuals put off creating or updating on an estate plan. But anecdotally, at least, the pandemic seems to be lighting a fire under some people to get serious about creating or updating their estate plans once and for all.
Making sure you have the key estate planning documents in place is important; that means a will, powers of attorney for healthcare and financial matters, and guardianships for minor children, first and foremost. Trusts may also make sense in certain situations. But there are other add-ons that you can think about in the context of your estate plan, especially if your goal is to make life as easy for your loved ones as possible and to ensure that your wishes are carried out after your death. In contrast with a traditional estate plan, you can craft at least some of these documents on your own, without the aid of a solicitor.
- A Financial Overview
In my parents’ later years, I was intimately involved and eventually in charge of their finances, managing their investments, paying their bills from their bank account, and so on. When they eventually passed away, I didn’t have to hunt around for key documents or climb a learning curve about their finances.
But many of us don’t have or want that kind of backup in place, which is why I think it can be helpful to create a financial overview and master directory for your loved ones. (These documents can also come in handy if you’re the main financial decision-maker in your household and your spouse doesn’t pay too much attention.)
A financial overview and master directory go hand in hand.
I recently created such a financial overview for our household and included the following headings:
- Our estate plan (in very broad outlines: where to find the documents and who the key agents are – POAs and executors).
- Our key financial assets (no dollar amounts or account numbers; just where we hold the accounts and who owns them).
- Our insurance coverage (property/casualty, health, life).
- Our house (property ID number, whether there’s a mortgage).
- Cars (VIN numbers, whether there are car payments).
- Regular household bills that we pay.
- A Master Directory
Think of a master directory as a detailed version of your financial overview. Whereas the financial overview is a Microsoft Word document, this is the Excel version. For example, your financial overview might say, “We are each members of the Jill and John Self Managed Superannuation Fund.” But the master directory would include the actual account numbers for those accounts, the URLs, and the names of any individuals you deal with at those institutions. Because the master directory includes sensitive information, it’s crucial to encrypt it or, if it’s a physical document, to keep it under lock and key.
- A Plan for Your Personal Property
Most wills will state that any tangible personal property, like furniture, should be sold and the proceeds added to your estate. But if you have sentimental or valuable items that you’d like to earmark for specific individuals, such as jewellery, artwork, or special home items, you can also create a memorandum of tangible personal property that specifies who you would like to inherit those items. For your own sanity, don’t go overboard in earmarking every little thing for specific individuals; focus on those items you treasure that will also have meaning for the recipients. I found that creating such a memorandum–and matching my favourite possessions to the loved ones in my life who I thought would appreciate them the most–to be one of the most enjoyable and cathartic aspects of the whole planning process. In addition, because the memorandum isn’t technically part of your will, you can update it as you obtain or shed possessions (or loved ones!). Such a memorandum is legally binding in most states, as long as it’s mentioned in your will. But even if the memorandum isn’t legally binding, it’s probably still worth doing and assuming that your loved ones will honour it.
- A Plan for Your Pets
If you’re an animal lover, you know that pets aren’t possessions; they’re part of the family. Thus, more and more estate plans include provisions for pets. There are a few ways to incorporate pets into an estate plan, and they’re a gradation. The gold standard, albeit one that entails costs to set up, is a pet trust. Through such a trust, you detail which pets are covered, who you’d like to care for them and how, and leave an amount of money to cover the pet’s ongoing care. Alternatively, you can use a will to specify a caretaker for your pet and leave additional assets to that person to care for the pet; the downside of this arrangement is that the person who inherits those assets isn’t legally bound to use the money for the pet’s care. At a minimum, develop at least a verbally communicated plan for caretaking for your pet if you’re unable to do so.
- A Digital Estate Plan
Even people who think they’ve ticked off all of the usual boxes on their estate-planning to-do lists may have overlooked an increasingly important component of the process: ensuring the proper management and orderly transfer of their digital assets after they die or become disabled. Just as traditional estate planning relates to the management and transfer of financial accounts and hard assets, digital estate-planning encompasses your digital possessions, including the tangible digital devices (computers and smartphones), stored data (either on your devices or in the cloud), and online accounts such as Facebook and LinkedIn. The laws around digital assets are changing quickly, and different providers have different policies/level of access. But a key first step is taking an inventory of all of your digital accounts and storing it in a secure but accessible location. You can include it as a separate sheet on your master directory, discussed above. Discuss the existence of this document with your executor, and if you have valuable digital assets (cryptocurrency, for example) you’ll want to be sure to discuss them with your attorney and incorporate them into your formal estate plan.
- A Plan for the End of Life
If you’d like to add additional background for your spouse, children, or other loved ones who might be making healthcare decisions on your behalf, check out “The Conversation Project“. It offers a starter kit to help you clarify your thinking and discuss these matters with your loved ones.
It’s also worthwhile to spell out your wishes and any plans you’ve made for funerals, memorials, and the disposition of your body, either verbally, in writing, or both. Maybe your wishes are simply to have your loved ones say goodbye in whatever way gives them the most peace at that time; in that case, tell them that or write that down.
- An Ethical Will
Consider writing or recording an ethical will that spells out your beliefs and values. In contrast with a conventional will, which lays out how you’d like your financial and physical property to be distributed, an ethical will is a way to “hand down” your belief system to your loved ones. The tradition of ethical wills began in the Jewish community, but it has gained more interest across cultures over the past decade. This is a heavy assignment, so don’t too much pressure on yourself to be profound or to write an ethical will all at once. Instead, consider starting your ethical will by jotting down your beliefs as they occur to you. To help remove some of the pressure, balance light bits of wisdom (“always keep a bottle of champagne in the refrigerator so that you can celebrate happy events big and small”) with the deeper life lessons that you’ve learned.
This article is general information and does not consider the circumstances of any investor. Minor editing has been made to the original US version for an Australian audience.
Bonds have been a beautiful thing over the past couple of decades, compounding returns at a decent clip while faithfully filling their traditional role as buffers in down markets. But now that interest rates are close to all-time lows, their future return prospects are much lower.
In this article, I’ll explain why investors saving for retirement should consider shifting their asset allocations to lean more heavily on stocks. I’ll also run through some of the pros and cons of doing that, especially when it comes to downside risk.
Assumptions needed for planning purposes
We generally avoid making predictions about long-term market returns. But for planning purposes, investors need to use some type of return assumptions instead of just throwing up their hands in the face of unpredictable future returns.
Looking at long-term historical norms is a place to start. Over the past 92 years since 1928, Treasury bonds have averaged annual returns of 5.15%, while medium-quality corporate bonds have returned 7.22%. If you subtract inflation, real returns are 2.17% for Treasuries and 4.22% for corporates.
But it’s highly unlikely that bond returns will reach the same level over the next 10 years. The yield on the 10-year Treasury has steadily declined over most of the past 20 years, and the Fed’s recent interest-rate cuts have pushed yields down even further, as shown in the chart below.
Exhibit 1: 10-Year U.S. Treasury Yield Over Time

Source: U.S. Treasury/multpl.com. Data at 31 May 2020
Yield makes up much of the return bond investors earn, so rock-bottom yields suggest future returns are likely to be far lower than in the past, and may not even keep up with inflation. Lower future returns have profound implications for retirement planning. Investors who stick with the same asset-allocation guidelines that worked in the past will likely fall short of their goals.
How should portfolios change?
Take a hypothetical 50-year-old investor who starts with a $300,000 balance invested in a portfolio combining 60% stocks and 40% bonds. If she’s able to sock away $500 per month over a 15-year period, the outcome looks pretty good if you assume the same rates of return we’ve seen over the past 15 years. But if we ratchet down the return assumption for bonds to 1.5% annually, the investor ends up with about $150,000 less, which might translate into a year or two of retirement spending.
Even those projections might be too aggressive because they assume equity returns stay at the same level over the next 15 years. With a more conservative assumption of 7% nominal returns for stocks, the ending balance would total about $264,000 less.
Exhibit 2: Potential Savings Gap

Source: Author’s calculations. Return assumptions are based on weighted returns for a 60/40 portfolio. Assumes a starting balance of $300,000 plus $500 monthly investments over a 15-year horizon. Date as at 31 May 2020.
Stocks to the rescue
Of course, the safest way to improve a long-term portfolio’s prospects is to boost contributions (or reduce withdrawals, if you’re retired). But a higher equity allocation could help fill some of the gap.
If we shift to an 80/20 mix and stick with the more conservative return assumptions, the ending balance gets a bit closer to the original level, reaching $870,000. Even shifting to a 90/10 mix (which would be more aggressive than the typical target-date fund with a 15-year time horizon) doesn’t quite get the ending balance back up to the original level. It would reach about $939,000 instead of more than $1 million.
How much is too much?
Of course, higher equity allocations come at a cost. As shown in the table below, there’s a direct relationship between equity exposure and risk.
The standard deviation (a measure of risk) for a portfolio combining 80% stocks and 20% bonds is about 34% higher than the traditional 60/40 asset mix.
Exhibit 3: Risk/Return Trade-offs for Different Asset Mixes

Source: Morningstar Direct. Data through 5/31/20.
Looking at performance during previous market downturns is another way to gut-check your risk tolerance before making any shifts to your asset allocation. For example, in the COVID-19 correction from 19 February to 23 March 2020, a portfolio with an 80% equity weighting would have lost about 27%, compared with a 21% loss for a portfolio with a 60% equity stake (using the US data above).
Exhibit 4: Performance in Previous Market Downturns

Source: Morningstar Direct. Data as of 31 May 2020.
Conclusion on the right allocation
Ultimately, the ‘right’ asset allocation is incredibly personal. Risk tolerance is a key input, but so is risk capacity, the amount of risk you can take given your proximity to needing to spend from your savings. If you’re within a few years of retirement, having an allocation to safer assets like cash and bonds won’t just lower your portfolio’s volatility; it will help ensure that you don’t have to invade your equity assets when they’re down.
At the same time, low bond yields don’t bode well for future returns. That suggests overweighting bonds is apt to reduce returns, and may result in a shortfall for investors who allocate too much to them in the name of safety.
Investors will likely need to pursue multiple strategies to help address the potential savings gap. Significantly increasing pre-retirement savings and reducing planned spending can improve your odds of success.
But if you’re willing to take on additional risk—and confident that you won’t be tempted to sell during market drawdowns—increasing your equity exposure can help fill part of the shortfall.
There are many coronavirus variations on ‘This Time It’s Different’, but something is happening in stock markets on a scale never seen before. Call it Robinhood traders, the corona generation, YOLO (You Only Live Once), TINA (There is No Alternative) or simply retail investors, but trading by individuals has hit global equity markets in massive numbers. Some daily moves are called a battle between the smart professional sellers and the dumb retail buyers, but since the 23 March bottom, the dumb money has been right. So far.
Professional versus amateur
Most macro articles coming into the Firstlinks’ mailbox recently from professional investors carry warnings about the disconnect between an economy in recession and a booming stock market. We have published many such as here, here and here.
Experienced market experts who have been through numerous investment cycles consider the market’s recovery seriously overdone. It’s called ‘the most-hated rally’ because many people have underestimated it. Magellan’s CIO, Hamish Douglass, was quoted in The Weekend Australian on 13 June 2020:
“Those who know are scratching their heads wondering what is happening while the uneducated are grading on guesses … Uneducated investors are getting excited. The optimism is based on no fundamental facts … I don’t think a V-shaped recovery is likely, or a depression, and we are likely just to muddle through.”
Douglass has increased his cash holding from 6% to 17% during the pandemic, and his former partner and now Portfolio Manager of MFF Capital Investment (MFF), Chris Mackay, was holding cash at 46% of his portfolio at the end of May.
A leading US financial industry newsletter, SA Macro View Daily, in which articles are written by fund managers and other experts, led its Friday edition last week with these three warnings:

In a Firstlinks survey in late April 2020, two-thirds of responses said a new low is coming. Our audience is older and wealthier than at other newsletters, implying SMSF trustees, retirees and advisers were not in a buying mood.
All of which suggests that the rapid rise in the market was at least influenced by another player and perhaps less-experienced retail investors were not the bunnies this time. It’s newbies versus fundies.
Evidence of increased participation by retail
Bestselling author and Barefoot Investor, Scott Pape, has a large retail following, and he recently started his newsletter by saying:
“Something weird was happening at Barefoot. While the headlines were full of people hoarding toilet paper, we were seeing a huge spike in people asking me how they could buy … shares?”
Australian stock brokers are reporting increasing retail activity and a large increase in new accounts. In May 2020, the Australian Securities & Investments Commission (ASIC) took the unusual step of issuing a report on retail investor trading during COVID-19. It includes:
“The average daily securities market turnover by retail brokers increased from $1.6 billion in the benchmark period (Ed. 22 August 2019 to 21 February 2020) to $3.3 billion in the focus period (Ed. 24 February 2020 to 3 April 2020). Retail trading as a proportion of total trading increased marginally, from 10.62% to 11.88% … Retail brokers were net buyers of securities over the focus period, buying $53.4 billion and selling $48.4 billion.
The rate of creation of new accounts (as indicated by their identifiers) is roughly 3.4 times higher during the focus period (compared to the benchmark period). In the focus period, new accounts represented 21.36% of all active accounts.” (my bolding).
In the US, financial market commentary hotly debates the new impact of retail investors. One estimate is that since the coronavirus hit, 10 million new accounts have been opened at fee-free brokers, many by millennials and younger people who are bored at home during the lockup and unable to watch their usual sports and bet on the outcomes. As the market has recovered quickly, social media sites are filled with stories of people making large amounts of money and FOMO has struck.
The question is … are there now enough of them to drive the market?
What are Robinhood, Reddit and TikTok?
For most retirees and professional fund managers following traditional media, this new phenomenon of ‘uneducated’ investors punting around looks misguided. What do these newbies think they are doing in our sophisticated market? What do they know about intrinsic value? The answer is, they don’t know much, and they don’t care.
These new Robinhood traders are having a ‘bro down’ party in the rising market, as satirised in the following variation from an episode of South Park.

South Park’s ‘Go Fund Yourself’ episode satirised Silicon Valley’s boy’s club. Now memes are doing the same to day-traders. SOUTH PARK/COMEDY CENTRAL
In case the meaning of this 4 Point Plan written in ‘bro speak’ is vague, here goes:
- ‘Download Robin Hood’ refers to the US stock market trading app (should be Robinhood) which has experienced incredible growth since the virus hit. It is free to trade and while in theory all users must be over 18, social media suggests older people are giving access to their friends and children.
- ‘Deposit stimulus’ means the special payments made to unemployed people to support them during the crisis, suggesting the ‘found money’ is used to day-trade the market. In Australia, there is anecdotal evidence that the same is happening with JobKeeper and early access to super. Some people have more ‘found money’ than ever before.
- ‘Buy stonks’ is a deliberate misspelling of stocks, but it’s more than that. It captures the impetus on chat sites such as Reddit where thousands of people read a tip which might sound ridiculous, but the consensus and comradery give it meaning. For example, someone makes a case for buying airlines when none of them are flying, based on the argument that Trump will save them, then followers jump aboard and airline shares rise rapidly. The fact that Warren Buffett just sold out gives the story even more gleeful momentum.
- ‘Bro down’ is a meeting of people, usually males, with some common bond, in this case, ramping up stories on social media of which stocks to buy and then boasting about it.
The result is a bunch of new players day-trading and laughing at the world of fund managers and experts. Sure, they are inexperienced, but they work on the theory that stocks only go up, and if it’s a terrible stock that just fell 50%, then that’s even better. It has so much potential.
It sounds crazy to anyone taught to value a company based on the net present value of its expected future cash flows, but in this world, none of that matters. The new traders drove up the price of Hertz after it declared bankruptcy with massive debts and no revenue, and the share price rose so rapidly that Hertz planned a new capital raising.
Where are these communities hanging out?
TikTok is a massive global success story with a billion members who post short dance moves, lip sync routines, cooking sessions or whatever. It’s also dominated by young people and millennials, and Robinhood advertises heavily to this market. The chat function on TikTok includes stories of quick daily market gains with videos on ‘How to Trade’ and ‘Financial Advice’, some of which are agonisingly naive.
Reddit is a large collection of online public forums where people share information and comment on posts by other people. It has become a global feedback site on almost any subject and one Robinhood section has 300,000 members. A popular Australian site is ASX_bets with 8,300 members. Reddit claims to be the number one resource for traders under 30, and they can legitimately collude.
And what of Robinhood? This is now a serious business. It has increased its user base by millions each month since March and embarked on a new share issue valuing the company at US$8 billion. It is privately held, and the app is not available in Australia. Robinhood makes money by selling data to high-frequency traders, which may translate into other activity by large players.
What do the online conversations look like?
It’s a virtuous circle while the music plays. Let’s screenshot some of the conversations to give a flavour, but take these as anecdotes rather than facts.
A former Goldman Sachs Partner, Joseph Mauro, reported that his 10-year-old son can no longer play the hit game Fortnite during the day because his friends are on Robinhood:

Hedge fund manager and writer of the well-known Felder Report, Jesse Felder, tweeted:

Here are some extracts from the Robinhood pages on Reddit as new players reach out for advice, such as:


Even when there is a market sell-off, we see claims that Robinhood traders caused it (although this comment is probably ironic):

Register here to receive the Firstlinks weekly newsletter for free
Their spiritual leader, Dave Portnoy
Dave Portnoy is the founder of a successful sports betting business called Barstool Sports. At the time when the pandemic hit, he had only bought one share in his life. Following the cancellation of most sports events, he turned to day-trading, doing live broadcasts about his portfolio to his 1.5 million Twitter followers as Davey Day Trader Global (#DDTG). He’s a big-time influencer. His handle is @stoolpresidente but watch the foul language. He tells how he is “just printing money“, and “With the volatility, it is kind of like watching a sports game.”
Portnoy’s techniques feed directly into the needs of his audience for instant success, big ideas and brashness, with strategies that make professionals wince. At a time when few fund managers wanted to touch airlines and cruise companies, he saw the selloff as an opportunity, and thousands followed him into these stocks.

Here is a video of Portnoy at “the most successful trading desk in the world“.
On 26 May 2020, Portnoy posted a video about the JETS fund which gives exposure to industrial stocks such as airlines. Daily turnover increased from US$50 million to about US$200 million and the price increased 18% in the next two weeks.
In Australia, brokers claim the Buy Now Pay Later stocks such as Afterpay and Zip have benefited from new traders adding to demand, knowing from their own use that these businesses are serious disrupters. Strong retail interest is reported in travel stocks such as Webjet and Flight Centre. During the heavy market fall for most of March, while professionals sought out traditional strong balance sheets, new players ran with beaten up stocks such as Kogan and The Reject Shop which have since rallied strongly.
Can this retail activity really have an impact?
Australia’s largest retail broker, CommSec, manages only about 5% of market turnover, despite holding well over one million accounts. Overall, ASIC estimates that about 90% of trading is done by institutional brokers. However, other reports such as by broker Bell Potter suggest retail influence is higher. Its Coppo Report recently showed retail brokers as net buyers of $4.6 billion from 23 March to 5 June while institutional brokers were net sellers of $6.3 billion.

Source: Bell Potter, Bloomberg, The Australian Financial Review
Two factors suggest retail influence is larger than their market share implies:
- Share prices are set by the marginal traders. For most stocks, the amount of turnover each day is a small fraction of the total market capitalisation. Prices can move on modest volumes, especially in small-cap stocks with poor liquidity. A collection of retail buyers or sellers following the recommendation of an influencer could move the prices of some stocks significantly. Millions of small amounts add up, especially when supported by a vocal social media presence.
- High Frequency Traders (HFT) are watching the sentiment in places like Reddit, Robinhood and TikTok and either trading ahead of retail or taking it as a guide. Then algorithms and quants that follow market momentum may kick in added support. Robinhood sells its data to HFTs. CNBC commentator Jim Crater recently suggested Wall Street veterans have started buying popular Robinhood stocks early in the day, as the online broker publishes the quantities held by its clients.
Several studies have tried to calculate whether this new group is making money, but the conclusions are complicated. Barclays reported no relationship between the aggregate holdings of stocks by Robinhood traders and the returns on those stocks. Soc Gen said these traders tend to hold both the best-quality stocks (familiar names such as Amazon, Facebook and Google) as well as the poor-quality names they are better known for. It’s more likely the new traders are simply following a rising trend and doing well from it.
How will it end?
Anyone who has spent more than five minutes in stock markets thinks this will end badly, especially when leverage is involved. Although it’s possible to make money in a falling market (say, using bear ETFs or put options) most new players are using a few thousand dollars and going long favoured stocks. In the next severe fall, a valuable lesson will be learned. Dave Portnoy’s estimated worth is over US$100 million after selling his sports betting business, so it won’t worry him to drop the odd million.
We also know there is a major FOMO at play here, where friends on social media boast of their gains and others hate to miss out. This will evaporate when losses become the norm.
The old adage was to sell when the taxi driver starts talking about his favourite stocks. Now the contrarian indicator is millions of overconfident and inexperienced gamblers who have only seen a rising market.
Also consider what has inspired this new generation of market speculators. The US Federal Reserve will do ‘whatever it takes’ to hold up the market. It is even taking the crazy step of buying corporate bonds. The money-printing machine knows no limits to supporting asset prices.
And going into the November presidential election, one of the candidates will set his campaign on making sure the stock market does not fall.

Regardless of what you think of Donald Trump (and there is much to dislike), tens of millions of Americans support him and his Make America Great Again rhetoric. He will do all he can to ramp up the economy for at least the rest of the year. Anyone ruling him out for another term hasn’t seen Joe Biden without a teleprompter.
Eventually, most of the bros will move on when the stonks fall. Given Mr Portnoy is a gambler, let’s finish with the words from the Kenny Rogers song:
You’ve got to know when to hold ’em
Know when to fold ’em
Know when to walk away
And know when to run
You never count your money
When you’re sittin’ at the table
There’ll be time enough for countin’
When the dealin’s done
(Footnote: A tragic update on personal vulnerabilities came the day after this article was published when Forbes reported that a 20-year-old had committed suicide when his balance on Robinhood was reported as negative US$730,000, said to be the result of the timing of some complex option trades).
There is no definitive answer, but here are three things to consider before you invest, writes Morningstar’s Daniel Needham.
We’ve heard questions from many clients about why the market is doing so well right now given how bad the economy is, and whether we will see the lows of March 2020 retested.
They’re good questions, but there might not be clear-cut answers for those who want certainty. We’ll discuss three points embedded in investors’ questions.
Key takeaways
- Markets are unpredictable, especially in the short term. This means we should be prepared to see many different outcomes, including what we’ve seen in recent months.
- Markets predict the economy, not the other way around. Don’t expect the economy to improve because the stock market has risen.
- What is a market? An index’s performance can hide the idiosyncrasies of underlying sectors and types of stocks.
- In our view, stocks that have fallen more or recovered less often have greater potential for future gains.
Point 1: Markets are unpredictable in the short-term
This point is perhaps obvious, yet there seems to be no end to the appetite for predictions from investment managers. It’s not just investing—anyone who watches sports on television fully knows that a) the unpredictable seems to happen a lot, b) humans’ ability to predict any short-term outcome is very limited, and c) we still love to hear and make predictions.
In the short term, one should be prepared for a wide range of outcomes in markets. Yet, we are often surprised at what markets do. Being surprised implies a level of confidence in our expectation that is probably misplaced. So, not only are markets unpredictable in the short term, we are also overconfident in our or others’ ability to predict. With investments, we try to keep a humble confidence about the long-term path of markets. History has shown time and again that market declines are eventually repaired by rebounds and that the general direction of stocks in aggregate is up, as long as their underlying companies are profitable, and managements continue to allocate capital so that its growth compounds. The path, however, is far from smooth and even.
We do find that market prices will depart from market fundamentals, or the aggregate cash flows produced by companies. When a price is below what we think a stock is worth, all else equal, we’ll typically find that to be an attractive investment. This doesn’t require accurate short-term predictions.
Point 2: Markets predict the economy
Bill Miller, the famous value investor who was chairman of Legg Mason Capital Management and later founded Miller Value Partners, observed that markets predict the economy rather than the economy predicting markets. Economic data is historical—it’s backward-looking—while markets are forward-looking. This explains why markets typically rebound before a recession is over, but it certainly doesn’t mean markets are always right.
Is it true today? Have markets correctly seen that the economic impact from the coronavirus will be less than thought in March? We just don’t know.
We do believe, however, that buying assets when they’re attractively priced is usually well-rewarded. Also, doing so removes the need to be right about predictions. Even if markets test new lows, we think they’ll eventually recover and assets bought at attractive prices will do well—regardless of whether they were bought at the most attractive price or not.
Point 3: A market is more than an index
The idea of “the market” is a tricky one, and what we say about a market can depend on how it’s defined. So, it’s important to understand what’s within an index before you talk about it—or invest in it.
Exhibit 1 illustrates how the headline performance number for an index that’s meant to represent US stocks, like the S&P 500, doesn’t tell the full story about the investable universe. Small-cap value stocks have lagged large-cap growth stocks by a wide margin year to date, and the S&P 500 has well outpaced international stocks, represented by the Morningstar Global Markets ex-US Index.
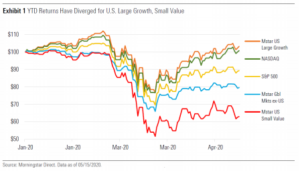
Also, the S&P 500 itself is an agglomeration of other markets, one that changes over time. The composition of the S&P 500 has become increasingly dominated by
stocks that are doing well in the current environment because they benefit from work-from-home consumers or are Internet-related, have strong balance sheets, benefit from globally diversified revenues, or their businesses are defensive by nature (meaning demand for their products is less dependent on the strength of the economy).
Most other stocks are down, some by a lot. So, while it feels like some parts of the market are doing too well currently, other parts are pricing in some negative outcomes for energy companies and banks and outright disaster for airlines, hotels, and cruise lines.
The flaw of averages
This is another example of “the flaw of averages.” When you add market-capweighting—or the fact that larger companies make up more of the total worth of a
market—it’s the flaw of averages on steroids.
The flaw of averages is illustrated by the man who sticks his feet in the freezer and his head in the oven so he can feel comfortable, on average. To give you a sense of the “the oven” in the US stock market, Exhibit 2 shows the weighting in the S&P 500 of five big tech stocks: Facebook (FB), Amazon.com (AMZN), Microsoft (MSFT), Apple (AAPL), and Alphabet (GOOG). We think all these firms benefit from the positives being rewarded by today’s markets mentioned earlier—internet-based and global businesses that are benefiting from the work-from-home environment, and they all have strong balance sheets. Even though they’re technology stocks, not defensives, investors aren’t treating them as cyclical stocks.
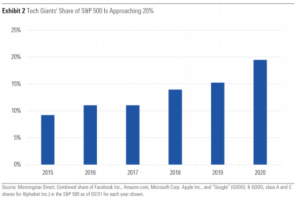
What does this mean for portfolios?
While we will never have a satisfactory answer to the question of what is driving the market, we do think one can respond to the prices and opportunities presented.
The market is facing a wide range of possible economic outcomes with more uncertainty than usual. In the wisdom-of-the-crowd model, accuracy is driven by the diversity and accuracy of individuals’ guesses. We don’t see anything to suggest a greater diversity among guessers, and most investors would say their guesses have a wider range than normal, so the average accuracy may be much lower than normal.
This means the market’s accuracy may be hindered, and the crowd’s wisdom may have lost a few IQ points. We think it also could mean opportunity for investors
willing to be different from the crowd.
For those businesses whose stock prices are higher than they were at the end of January 2020, one has to wonder whether this environment should call for higher valuations. Mark us as sceptical, but there are still select opportunities.
We find those opportunities through our valuation-driven investment approach. Our valuation research leads to calculations of the returns we think an asset class
will experience over each of the next 10 years, averaged and adjusted for inflation.
As shown in Exhibit 3, US small-cap value stocks are poised for much higher returns—according to our valuation-based, forward-looking return estimates— than US large-cap growth stocks.
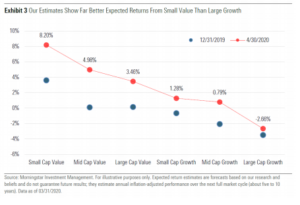
We chose to show these valuation-implied return forecasts for US small value versus US large growth to stick with the theme above. We’re also seeing similar gaps between US and international stocks and among sectors, with the energy and financials sectors being priced for the best returns, according to our calculations.
In our opinion, market-timing is not possible, however, we think the returns for value, international, and energy stocks in US dollars at current prices look attractive for a long-term US investor.
One should never say never, but I have never nor will I probably ever again experience the level of uncertainty that currently exists. Everywhere one looks, uncertainty abounds. How can anyone predict the outcome of something that has never been experienced? When you have experienced something or have an historical perspective you can do something about it. When you don’t know, uncertainty becomes overwhelming. Risk escalates. No one knows what the future holds and personal biases only muddy the waters. Objectivity should be key, intellectual humility its companion.
The sheer breadth and depth of the disruption caused by coronavirus to the global economy and two behavioural patterns of society at large have been a real, and perhaps overdue, wake-up call. Hopefully, selfishness and greed will make way for more compassion and sharing, together with increased recognition of the effects of isolation that many currently encounter as a part of normal daily life.
Across the board, the coronavirus has exposed our weaknesses and frailties. Among others, overdependence is one such weakness. Unlike the Spanish Flu epidemic, which infected an estimated 500 million, or one third of the then world’s population, and a death toll of over 50 million, coronavirus has invaded every nook and cranny of today’s social and economic landscape. Global supply chains have been ruptured and our overdependence on China exposed.
There are likely to be many changes in the way we live and globalisation, even capitalism may ultimately suffer. Things we have taken for granted are now being questioned. Perhaps it is also the appropriate time for investors to review their portfolios from a dependence viewpoint. Ensure your portfolio is diversified and not isolated or too exposed to any one country, sector or thematic.
Australia’s dependence on China has been laid bare. China is by far our largest trading partner, accounting for at least 37% of all exports. Of our top five goods and services exports – iron ore, coal, petroleum gases (LNG), education and tourism – it is number one in iron ore,
education and tourism. That does not include agricultural products such as wheat, barley, beef, dairy and wool, wine, seafood, the list goes on. How we address the situation will be crucial. Geopolitics will present more and more challenges.
Not a pretty picture, but markets accepting
The US April jobs report revealed 20.5 million jobs lost equating to an unemployment rate of 14.7%. Neither number was unexpected. In fact, both were below expectations of 22million and 16% respectively. The private sector lost 19.52 million jobs and government 980,000. The economic shutdown is a private sector scourge. The US Bureau of Labor Statistics noted the unemployment rate was understated by around 5%. While the re-opening process has begun, the May jobs report could see the unemployment rate close to, perhaps above, 20%.
The share market chose to ignore the data, which was the worst since records began in 1948, and initially rose strongly, with investors looking through telescopes beyond the pandemic to recovery. Subsequent warnings from Dr Anthony Fauci and Fed chairman Jerome Powell have dampened enthusiasm.
With the new decade less than five months old, is the share market comfortable with the possibility it may take the rest of the decade before the US unemployment rate revisits the recent 3.5% low? Even if the US banned the importation of all manufactured goods and replaced them with domestic production, increased automation would curtail the rate of decline in unemployment. As the economy reopens, workers in the over-50 cohort may not all be re-hired. Businesses and consumers are likely to remain cautious, so investment and consumption may not rebound with the strength and sustainability currently expected. Predictions of a “bull-at-the-gate” response could be disappointed. Hospitality, tourism and travel are likely to lag significantly, with social distancing and fear of a potential secondary outbreak front of mind. These sectors are large employers of the younger demographic. The “new normal” post COVID-19 environment is unlikely to resemble that of pre-2020 for many years, if ever. The transition to even some level of normality is likely to be measured in years not months. Consequently, investors will need to be patient for a return to normalised returns. Preservation of capital remains the number one priority.
Clearly, the normalisation of government debt and central bank balance sheets could be a work-in-progress for most of the current decade. But many over-leveraged companies, the zombies, are unlikely to make it through to 2022 and the cost to their lenders is significant and probably much more than financial markets have reckoned. Fancy a record number of corporate drownings despite a sea of liquidity. But that liquidity will dry up as the US Treasury borrows to fund the government programs, bleeding the private sector, regardless of asset purchases of the Fed.
In a move previously thought to be on the brink of the impossible, the Fed has started purchasing corporate debt exchange-traded funds. The program is being administered through BlackRock. Jerome meets Larry or It’s a Mad, Mad, Mad, Mad World is the only show currently playing on Broadway.
After an initial rebound in employment as economies reopen, a plateauing is more likely and hours worked will remain meaningfully below 2019 levels, perhaps for years. Consequently, GDP growth will follow a similar path and there is also a correlation between GDP growth and corporate earnings growth. Currently the market appears to be expecting a V-shaped economic recovery. The risk the economic pandemonium will resolve smoothly and without incident is low. There is material downside, if it does not eventuate
Greed, arrogance and hubris pervade financial markets, which choose to ignore their overdependence on central bank monetary policy and government fiscal stimulus. Rarely do markets ask why. In a webcast held by the Economic Club of New York on Tuesday, one of the world’s top money managers 66 year-old Stan Druckenmiller said, “the risk-reward calculation for equities is the worst I have seen in my career”, adding government stimulus programs won’t be sufficient to overcome the world’s economic problems from the COVID-19 downturn. “The consensus out there seems to be: ‘Don’t worry, the Fed has your back. There’s only one problem with that: our analysis says it’s not true.” When the ruggets pulled the foundations of sand will be exposed. The Fed can’t support the zombies forever.
What are the chances of a repeat?
History repeats itself is not a prediction or prophecy, neither is it marked by self-fulfilment. It refers to something that has happened in the past, recurs in the present. While the past is finite, it is also vast so that recurrence is likely.
The Nasdaq Composite has been the driving force behind US markets for several years, including the S&P 500, and its influence has gotten stronger over the past three years. The FAANGs cabal—Facebook, Amazon, Apple, Netflix and Google (Alphabet)—has outperformed most of their index companions and all five are members of both the S&P 500 and Nasdaq Composite. Microsoft has the largest market capitalisation of all US companies and is the leader of the S&P 500/Nasdaq pack. It’s almost got to the point where the Nasdaq goes others follow.
Now, recall in the 2000 Tech boom, Nasdaq was also the frontrunner. The index soared from near 2,000 in June 1999 to over 4,600 April 2000. It fell sharply and quickly, reminiscent of the recent March collapse, then rallying. That was the first of three 40%-plus rebounds. The final washout saw the index at just over 1,100 in October 2001, 76% below the April 2000 peak.
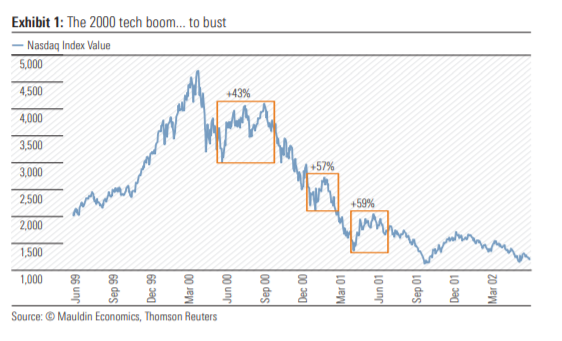
I realise the FAANGs plus Microsoft are much larger and stronger companies than the leading companies of Nasdaq 20 years ago. But mostly all companies pull back when markets falter, some more than others. The market capitalisation of the FAANGs is US$4.2 trillion representing 32% of the Nasdaq’s capitalisation. ETFs own an estimated 24% of the FAANGs— concentration risk in the index and ownership.
Aussie exports boom—China the crutch
Australia’s record trade surplus of $10.6bn in March took the 1Q surplus to $19bn and could mean 1Q20 GDP may have avoided a negative read. Net exports will be an important contributor to 1Q GDP. The monthly surplus shattered the previous high-water mark of $7.8bn in June 2019 and was well above forecasts of $6.8bn. Iron ore exports recovered strongly from February’s cyclone-affected shipments, while both coal and LNG were also solid contributors. Non-monetary gold was a feature increasing by over 220% to $3.6bn. With the Chinese economy reopening, renewed demand for iron ore underpinned a 15.1% or $5.6bn jump in exports of goods and services as imports fell 3.6%, after a 4.6% decline in February. Making the performance of goods exports more impressive, services exports, mainly tourism and education-related, fell 9.4% following an 8.5% slide in February.
Another meaningful surplus is expected in April, getting 2Q off to a solid start. Iron ore will lead the way, while falling imports will continue to support the net exports number. But whatever the contribution net exports make to 2Q GDP, it will not save Australia from racking up a double-digit negative read.
The NAB’s April Business Survey painted a predictable dismal picture, with business conditions in all non-mining industries “deeply negative”. While confidence bounced from March’s nadir the readings of both conditions and confidence remain understandably very weak. The fall in capacity utilisation and employment paints a sombre picture for investment going forward.
The Westpac-Melbourne Institute Index of Consumer sentiment provided a shot in the arm, rebounding from a despair-laden April read of 75.6 to 88.1 in the 4–8 May survey. In the four-week period between surveys, the consumer has gone from facing a prolonged shutdown in the wake of a severe virus outbreak to a gradual reopening and sharply reduced infection rates. The consumer is in a much better place psychologically.
Australia lost almost 600,000 jobs in April resulting in a rise in the unemployment rate from 5.2% in March to 6.2%. The modest rise was due to a record fall in the participation rate from 65.9% to 63.5%, equivalent to a 490,000 fall in the work force. Critically, hours worked fell 9.2% and underemployment jumped to 13.7%, providing a more accurate picture of the devastation coronavirus has had on the economy. The unemployment and underemployment rate at 19.9%. Despite partial reopening it is possible the May unemployment rate could rise further.
In fixed interest land, two significant events. The Australian Office of Financial Management (AOFM) priced $19bn of Australian government bonds with a maturity of December 2030 at 1.00%. Bids totalled $53bn. Woolworths priced a 5-year bond at 1.85% (US$400m) and 10-year at 2.80% (US$600m). Demand totalled US$2bn. Investors are buying for capital gain, on the expectation yields will continue to fall and prices rise. There may be some safe-haven interest, but yield appears to be a secondary issue.
In reference to easing and tightening monetary policy, the late Paul Volcker, perhaps one of the best chairmen of the US Federal Reserve said, “easing is the easy part, tightening isharder.” In the coronavirus environment, the combination of stimulus, support and survival packages unleashed by the central banks and governments are synonymous with “easing”. The tightening or withdrawal of the benefits provided to businesses and workers will be harder. This is when political bipartisanship will be sorely tested.
Oil—Is the tide turning?
A quick technical update from my friend, Your Technical Analyst Regina Meani. While Saudi Arabia will cut production by a further one million barrels per day starting 1 June, the focus remains on demand.
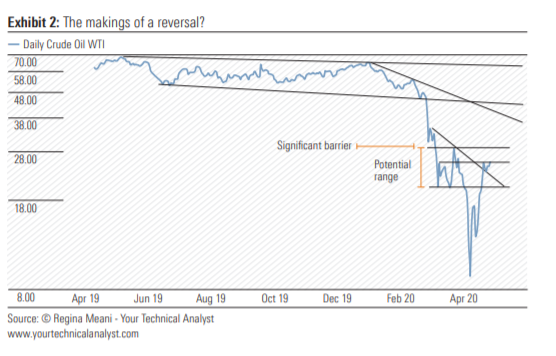
Summary
The impacts of the coronavirus pandemic have reverberated aggressively across the globe. Immediateterm societal priorities are on protecting public health and stabilising financial and employment markets.
This period also serves as a reminder of global interconnectedness, systemic risk, and the vulnerabilities and tensions between economic, social, environmental, and governance considerations. The climate change resulting from anthropogenic emissions has already had a harmful effect on human and natural systems. Efforts to combat climate change by reducing greenhouse-gas, or GHG, emissions have taken on greater urgency. The 2015 International Paris Agreement to limit global warming to well below 2 degrees Celsius above pre-industrial levels recognised that any warming beyond that threshold would have devastating consequences. Many governments, particularly in Europe, have responded with policies to incentivize renewable energy and to tax carbon and greenhouse-gas emissions. Investors also are becoming increasingly aware of climate-change-related risks and the need to transition away from carbon-intensive activities. Pressure is mounting on asset managers, pension funds, and other asset owners, including in Australia, to more thoughtfully consider carbon risk.
In order to mitigate the impact of climate change as economies transition to low-carbon consumption, there will be opportunities for companies to innovate and adapt to a greener world. Conversely, companies that don’t evolve will be threatened by stranded assets and outmoded business models. With this backdrop, Morningstar has developed a suite of carbon tools that empower investors in identifying carbon risks within investment portfolios.
In this report, we have utilized Morningstar’s carbon tools to compare carbon risk in managed funds categorised within Morningstar’s Australia-domiciled large world equity and large Australian equitymanaged fund categories. We compare the characteristics of Morningstar® Low Carbon Designation™ funds in Australia with global findings, so that climate-aware Australian investors can benefit from those insights, given sustainable investing in our region is still somewhat in its infancy.
Key Takeaways
× Climate change poses both physical and transitional risk–Morningstar’s carbon tools empower investors in identifying the risks and opportunities for companies and within portfolios.
× Carbon risk, as calculated by Morningstar partner Sustainalytics (currently 40% owned by Morningstar), is a forward-looking view of a company’s management of its risks and opportunities in the transition to a low-carbon economy.
× Overall carbon emissions for the Morningstar Australia GR Index are 54% higher than the Morningstar Global Markets GR Index. This is driven by Australia’s overweight in high-carbon-emission sectors such as energy and materials and the predominance of coal in electricity generation.
×Overall carbon risk for the Morningstar Australia GR Index is only 18% higher than the Morningstar Global Markets GR Index. This indicates overall stronger management of carbon risk by companies in the index, but it also reflects regulation in the operating environment.
× Morningstar Low Carbon Designation denotes portfolios with low-carbon risk and low fossil-fuel exposure:
- Twenty percent of all Australia-domiciled and U.S.-domiciled world large-equity funds received the Morningstar Low Carbon Designation. In comparison, 33% of Europe-domiciled world large-equity funds received this designation. The EU Action Plan on Sustainable Finance has been an impactful regulatory development.
- Only 6% of Australian large-equity funds received the Morningstar Low Carbon Designation. This proportion in vastly lower than large domestic-market equity categories in U.S. and Europe.
- Only one fund that received the Morningstar Low Carbon Designation in the Australian large-equity category had an explicit Sustainability objective within its product disclosure statement objective, adding complexity in the selection of funds for climate-aware investors.The limitations of the smaller universe size in this category is acknowledged.
- In large world categories and in large domestic equities in regions other than Australia, large-growth funds, received the highest proportion of the Morningstar Low Carbon Designations.
- The downside capture ratio for Australian large world funds receiving the Morningstar LownCarbon Designation was 78%, compared with 92% for large world blend category overall, indicating better protection in falling markets. Those funds also displayed quality factors such as higher returns on equity and lower debt/capital ratios.
- Few large Australian growth funds received the Morningstar Low Carbon Designation. In contrast, a significantly higher proportion of large Australian value funds received the Low Carbon designation than domestic-equity funds in other regions. This is explained by Australian large-value funds generally having higher exposure to financials with lowercarbon risk.
Understanding and Measuring Carbon Risk
The material risks posed by climate change are well articulated in Morningstar’s April 2018 paper “Measuring Transition Risk in Fund Portfolios.” It details physical and transition carbon risks that are material and helpful in understanding the varying risks and opportunities for companies.
Physical risk, results from the increased severity and incidence of extreme weather events and from the longer-term changes in precipitation and variability of weather patterns due to rising temperatures and rising sea levels. These risks can have disparate impacts on industries and on companies within a given industry, both in terms of their operations and in demand for their products and services. The location of a company’s assets and supply chains is critical, with physical effects at times differing even over a few kilometers.
Transition risk, also referred to as carbon risk, addresses how vulnerable a company is to the transition away from a fossil-fuel-based economy to a lower-carbon economy. Specific transition risks include policy and legal regulations limiting carbon emissions; pressure on firms to align their strategies with the Paris Agreement’s 2-degree scenario; switching costs to new technologies; and changing consumer preferences.
Morningstar’s carbon-related data points are a subset of Morningstar’s extensive range of sustainability metrics valuable for sustainability assessment. Key Morningstar carbon metrics include: carbon risk rating, carbon intensity, portfolio fossil fuel involvement, and low carbon designation. Further low-carbon discussion, including Morningstar’s own low-carbon indexes, can be found in Morningstar’s January 2019 paper “Preparing for a Low Carbon Economy: Investing in the Era of Climate Change.”
Morningstar’s Carbon Risk Rating
The Morningstar Carbon Risk Rating is underpinned by a company-level assessment undertaken by Morningstar’s sustainability business partner, Sustainalytics. Morningstar provides an asset-weighted carbon risk score based on company-level portfolio holdings, where zero shows negligible carbon risk in a portfolio and 50 indicates severe carbon risk.
The Carbon Risk Rating differs from a simpler carbon-footprinting approach, which solely looks at carbon emissions. Emissions are useful alongside other reported metrics. Morningstar makes this information available with the carbon intensity data point: metric tons of CO2 per million USD Revenue. However, when using this data point, investors should note that the extent of reported emissions can vary significantly according to the included scope. Scope 3 emissions refers to indirect emissions resulting from activities in the company value chain such as purchased or sold goods or services. These can be complex calculations, but they can be very impactful on the reported number. For example, in fiscal year 2018 BHP 1 & 2 emissions totaled below 15 million tons of CO2, yet scope 3 emissions, largely due to their customer’s processing and use of iron ore into steel, generated 570 million tons of CO2. Carbon footprinting is also a backward-looking exercise which reflects past performance but does not provide a necessarily meaningful view on what lies ahead.
In contrast, the Carbon Risk Rating by Sustainalytics is a forward-looking view that incorporates the amount of carbon emissions, but looks at them in the context of the mitigation strategy planned by the company (such as targets to reduce emissions) and the extent to which company activities and products might be impacted by the shift to a low-carbon economy.
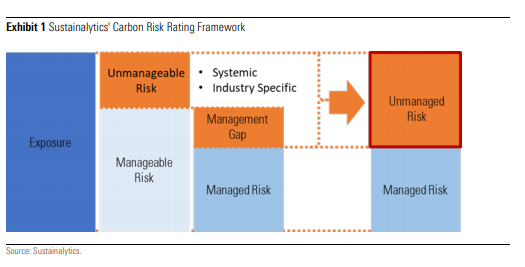
In considering BHP’s (ASX:BPH) efforts to reduce its own carbons emissions, Sustainalytics rates BHP as medium risk, in the 48th percentile compared with subindustry diversified metal-mining peers. BHP faces higher-than-average exposure to carbon risks in part due to its product portfolio, which includes coal and oil and gas producing assets. However, BHP has an overall strong management of ESG risks, including its board-level sustainability committee and discussion of climate-related risk factors and a riskmanagement approach aligned with the recommendations of the Financial Stability Board’s Task Force on Climate-related Financial Disclosures, or TCFD.
In a contrasting example, iron ore and lithium miner Mineral Resources (ASX:MIN) is ranked by Sustainalytics in the 32nd (lower risk) percentile for subindustry relative to carbon-own operations risks. Mineral Resources faces lower exposure to carbon risks–yet, measures to manage those carbon risks are comparatively weaker than BHP, with only partial reporting of GHG emissions (no Scope 3 reported), a trend of increasing emissions and no clear targets to reduce them.
The distinction in consideration of emissions only, compared with overall carbon risk is made clear in the comparison of BHP and Mineral Resources that score closely at 19.5 and 17.5, respectively, indicating that despite BHP’s much higher emissions, positive action by its management to mitigate carbon risk is beneficial to the company in the transition to a low-carbon economy.
Carbon Risk by Region and Sector
In Morningstar’s October 2018 report “Great Funds, Low Carbon” average carbon risk is shown by sector. Predictably, energy is high carbon risk, with the materials and utilities sectors also having above-average carbon risk. The chart below shows the asset-weighted carbon risk by sector for Australia and the world. For Australia, the ASX 200 is used. For global sectors iShares’ global sector exchange-traded funds are used: energy (IXC); utilities (JXI); materials (MXI); industrials (EXI); real estate (REET); financials (IXG); telecom services (IXP); consumer discretionary (RXI); consumer defensive (KXI); information technology (IXN); healthcare (IXJ).
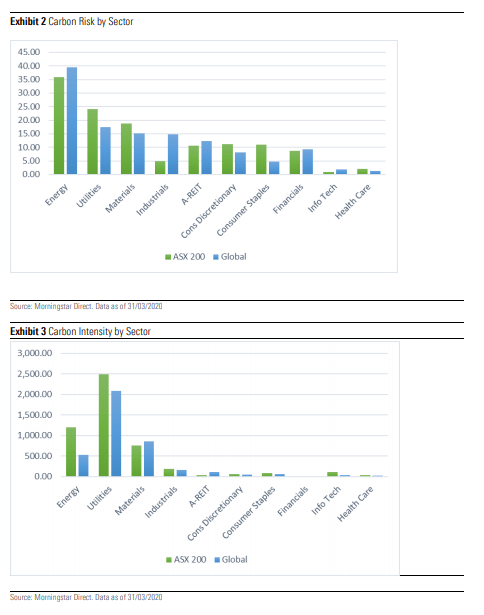
“Morningstar Sustainability Atlas of April 2019” ranked Australia in a higher carbon-intensity quintile than carbon-risk quintile, and noted that Australian companies are doing a good job of managing carbon risk, given this market’s fairly high level of carbon Intensity. It is interesting to note Australia’s carbon intensity and carbon-risk scores have barely changed since then but both now reside in the third quintile. This is due to the shift in quintile boundaries, indicating that whilst countries overall have reduced their carbonrisk scores, Australia has lagged in comparison
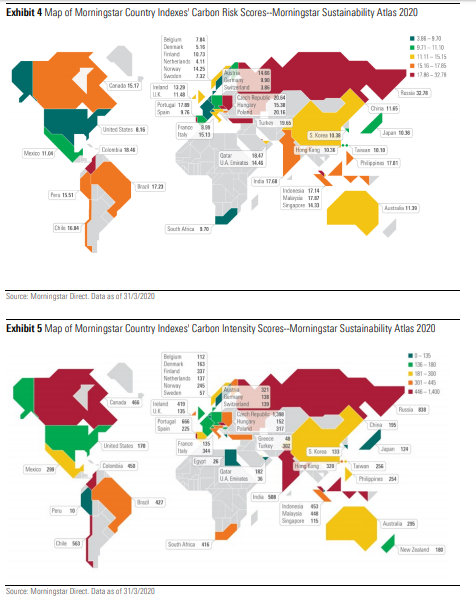
Australia’s overall carbon-risk score is affected by sector-weighting differences. Although the Australian market is overweight financials–a sector with lower-average carbon risk–compared with global markets, it is countered by the Australian market overweight to materials that have above-average carbon risk.
There are also differences in average sector scores for Australian companies compared with global peers. Emissions for the ASX 200 Energy sector far exceed average energy companies globally, yet ASX 200 energy companies had lower-average carbon risk than global peers.
The carbon-risk score considers the company’s operating environment, which, in this respect, is Australia’s policy vacuum on energy and climate. The absence of a carbon tax or strict emissions reduction regulation/targets is favorable from a short-term financial materiality point of view. However, Sustainalytics cautions that this could increase risk over the medium-long term, assuming that governments that delay a carbon-reduction policy might have or be forced to enact more stringent regulation in the future. Therefore, companies in these regions may risk unpreparedness if they fail to take steps early on and adapt to a carbon-constrained environment. Regardless, there are examples of leading companies with progressive climate strategies and commitments, going beyond current government policies, which helps to explain the apparent discrepancy between emissions and carbonrisk scores.
Portfolio Fossil Fuel Involvement
Acknowledging the outsize carbon risk and emissions resulting from identified sectors, Morningstar calculates the extent of fossil-fuel involvement within a portfolio. This is determined by looking through to the asset-weighted holdings of a portfolio alongside data provided by Sustainalytics. In order to be considered as having low fossil-fuel involvement, a portfolio averaged over the trailing 12 months must have less than 5% of revenue from: thermal coal extraction, thermal coal power generation, oil and gas production, oil and gas power generation, and less than 50% revenue from oil and gas products and services.
Low Carbon Designation
So that investors can quickly identify funds that have low-carbon risk, there is the Morningstar Low Carbon Designation, denoted in our reports by the symbol below.

Low portfolio carbon risk score <10 (trailing 12m).
Low level of fossil-fuel exposure <7% portfolio (trailing 12m).
Comparing Australia-Domiciled Funds
World Large-Equity Categories
For Australia-domiciled funds, approximately 20% of strategies in the world large category received the Morningstar Low Carbon Designation. This is consistent with world large funds domiciled in the U.S. In comparison, 33% of world large funds domiciled in Europe receive the Low Carbon designation. Given the comparable global investment universe, this supports the view that Europe is at the forefront of climate-aware investing. Morningstar’s April 2020 “Investing in Times of Climate Change” report identifies 405 funds with a climate-aware investing objective.
The scale and rapid growth rate of this segment has been helped by significant regulatory developments, including the EU Action Plan on Sustainable Finance. The large number and size of climate-aware funds dwarfs other regions.
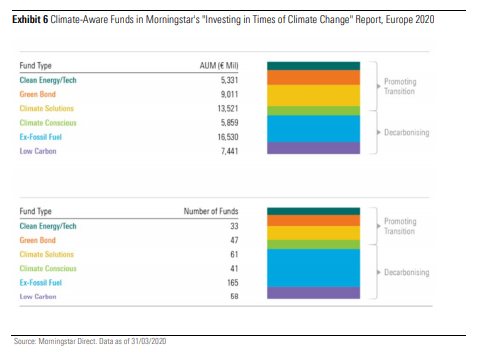
This report is illuminating for regions outside of Europe, including Australia, in articulating the breadth of approaches available to asset managers and investors in achieving lower carbon-risk outcomes.
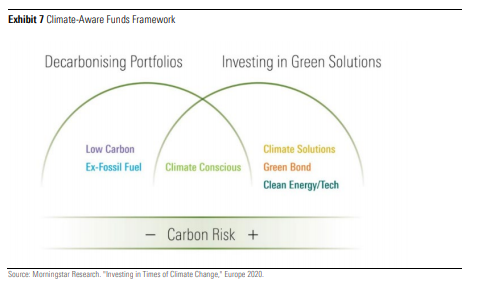
We also observed that Australia-domiciled large global funds receiving the Low Carbon designation displayed a better-than-average protection from falling markets. This is evident in the lower downside capture ratio for this group compared with peers (using the world large-blend category) or the index (using Vanguard MSCI International ETF VGS tracking the MSCI World ex Australia accumulation index as a proxy).
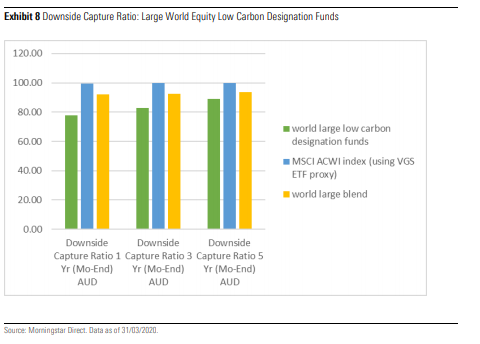
In order to identify the reason for the lower downside capture ratio we checked if these funds showed a bias to low volatility. However, their beta and standard deviation were roughly in line with index and category. We considered whether quality factors could also be attributed for the lower downside capture ratio and found this to be true. We measure quality using portfolio average return on equity and found low-carbon-designation fund portfolios delivered slightly higher ROEs than the index and higher ROEs than the world large-blend category. We also found these portfolios had lower debt/capital ratios. This quality bias alongside lower carbon risk are appealing portfolio attributes for climate-conscious investors.
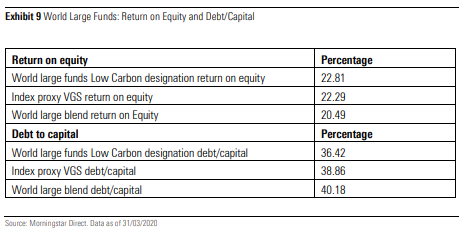
Though Australian investors have fewer choices of funds with explicitly climate-aware objectives, by using Morningstar’s carbon tools we identified a set of global large-cap equity strategies under current Morningstar Analyst Rating™ coverage that received the Morningstar Low Carbon Designation (listed in order of carbon-risk score).
The strategy with the lowest carbon-risk score in the world large category is IFP Global Franchise, a fund that does not have an ESG focused objective. We note that about 5% of that portfolio is invested in British American Tobacco PLC as at 31 March 2020. Investors should be aware that the Low Carbon designation is intended to identify carbon-risk considerations only and not broader sustainability risks. Morningstar’s carbon metrics are a subset of extensive ESG data available to investors in order to evaluate ESG risks within portfolios. Approaches to sustainable investing are broad, and it is important for investors to understand their nuances and ensure their alignment to a strategy.
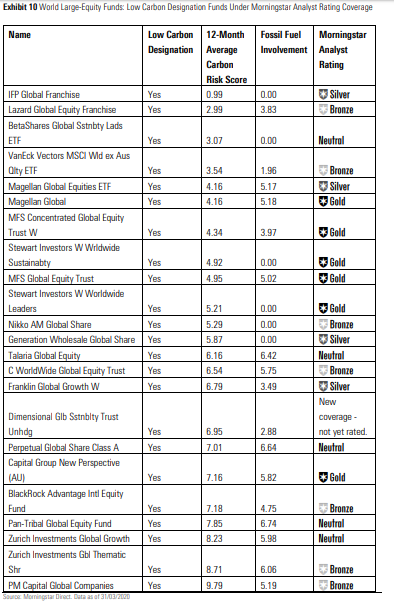
Some of the funds on the list are broad-focused with no explicit sustainability objective, while some are strategies with a strong ESG integration. Generation Investment Management, for example, places sustainability at the forefront of its investment process, aiming to identify companies with sustainable attributes that are well managed for the long term, have a culture of integrity, and demonstrate respect for their shareholders. It is unsurprising to find the Generation Wholesale Global Share portfolio had lower carbon risk. Similarly, Stewart Investors are known for investing in companies that provide socially important and sustainable services. Both their Worldwide Sustainability and Worldwide Leaders strategies received Low Carbon designation.
We expected to see AXA IM Sustainable Equity and AMP Capital Ethical Leaders international share in the above list, given the ESG incorporation in their objectives. However, both narrowly miss the Low Carbon designation due to their fossil-fuel exposure being 7.06 and 7.26, respectively (not below 7.00). AXA IM Sustainable Equity uses a systematic low volatility and quality-factor investing process for a strongly diversified portfolio that incorporates lower carbon-risk scoring but does not totally eliminate fossil-fuel exposure. AMP Capital Ethical Leaders International Share is a multimanager strategy with an ethical charter by which underlying managers must abide. The threshold for fossil fuels within the charter was reduced from 20% to 10% in April 2019 (but at the time of writing, AMP Capital was considering further limiting that exposure).
Australian Large-Equity Categories
Less than 6% of strategies in the Australian (domestic) large-equity categories received the Low Carbon designation, a significantly lower proportion than domestic U.S. or European large categories. The limitations of the smaller universe size in these categories is acknowledged for analysis of this group, however, its comparative size also suggests that fund managers in Australia have a lower emphasis on carbon.
The chart below compares the percentage of domestic large-equity funds receiving the Low Carbon designation by category. In Europe and the U.S. more than 70% of domestic large-growth strategies received the Low Carbon designation, and this is because large-growth funds tend to be overweight tech and underweight energy. In Australia, however, large-value funds had the highest proportion of portfolio’s receiving the Low Carbon designation.
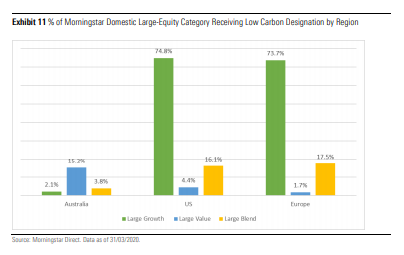
While noting again that the limited universe size may distort results, we compared the sector exposures for Australian large categories with world categories in order to explain this distinction. The chart below reveals the high weight of financials for Australia large-value portfolios. As discussed above, that sector has a lower carbon risk.
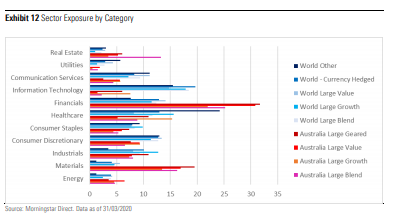
Despite having fewer large Australian equity funds receiving the Low Carbon designation, there are still funds that are noteworthy for the lower carbon risk within their portfolios. The large Australian equity funds listed below all receive an Analyst Rating as well as the Morningstar Low Carbon Designation. These are listed in order of carbon-risk score.
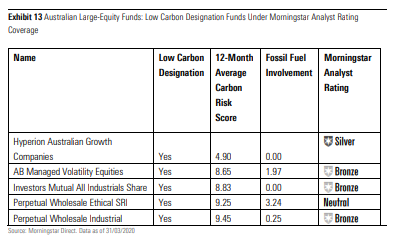
Interestingly, only one of these, Perpetual Wholesale Ethical SRI, has an explicit ESG focus stated in the fund PDS objective.
Despite the absence of a stated climate-aware objective, Hyperion Australian Growth Companies boasted the lowest carbon risk score of Australian large-equity strategies under analyst coverage. Hyperion’s quality and long-term growth focus leads to an overweight to the healthcare and technology sectors that have low-carbon risk, while having virtually no exposure to materials and energy. Whilst we note that Hyperion Asset Management has a detailed ESG Policy and Framework, its low-carbon risk score was an outcome of their process rather than an intended objective. This situation is revealing of the complexities for climate-aware investors in selecting a fund that manages carbon risk. The excerpt below is taken from the Hyperion Australian Growth Companies’ PDS.
“Labour standards and environmental, social and ethical considerations are taken into account, but only to the extent that they are likely to affect the future long-term financial performance of the investment. Generally speaking, the investment manager does not have a fixed methodology or weightings for taking labour standards and environmental, social and ethical considerations into account when selecting, retaining and realizing investments of the fund.”
Pendal Ethical Australian Share, with a carbon-risk score of 12.88 and fossil-fuel exposure of 17.42, is a good example of an Australian large-equity fund under our coverage that didn’t meet Low Carbon designation requirements, despite the incorporation of ESG in its objectives. Pendal Ethical Australian Share’s PDS refers to exclusion of investment in companies mining uranium for weapons manufacture, alcohol or tobacco, gaming, weapons, or pornography. Investors seeking climate-aware portfolios should note that those exclusions do not relate to carbon risk. The fund seeks exposure to companies offering leading environmental and social practices, products and services–as of 31 March 2020, BHP makes up more than 5% of that portfolio. While many could consider BHP as having implemented leading ESG programs, the company does not qualify as a low-carbon investment. In fact, Sustainalytics considers BHP at medium carbon risk (score of 19.5). BHP also has roughly 20% of its revenues from fossil fuels.
Conclusion
As societies seek to manage the profound effects of climate change, we anticipate the greater consideration of carbon risk in portfolios. We expect that global asset managers will launch more climate-aware funds in coming years. But for Australian investors, it will be more of the evolution of existing strategies to incorporate climate-change considerations, such as a lower-carbon footprint and reduced exposure to fossil fuels. Investors concerned about carbon risk can utilize Morningstar’s suite of carbon tools and incorporate the Morningstar Low Carbon Designation into their fund-selection process. It is also important that investors and their advisors are diligent in ensuring their alignment with a fund’s level of carbon exposure, portfolio holdings, and investment objectives
In the iconic Australian film, The Castle, the family lawyer, Dennis Denuto, is struggling to make his case in court, bumbling around with a copy of the Australian Constitution. Finally, he sums up in a segment that has both entered Australian folklore and become required viewing for law students:
“It’s the vibe of it … It’s the Constitution. It’s Mabo. It’s justice. It’s law. It’s the vibe and … ah, no, that’s it. It’s the vibe. I rest my case.”
The Constitution has little relevance to his case. It was simply the vibe of the thing. There’s a similarity now with the assumptions used in calculating future superannuation balances.
Retirement planning should start decades before the end of full-time work. In a wonderful world of returns well in excess of inflation rates, driven by compounding over long periods, bond and equity markets will provide the financial resources for a comfortable retirement far quicker than if returns struggle to beat inflation. But is all that in the past?
Superannuation balance calculators usually assume a nominal rate, then discount the future amount by an inflation factor, currently about 2.5%. In this discussion, 7.5% nominal and 5% real are considered approximately the same.
‘Two cents’ worth’ on super projections
The most popular website for starting to understand investing, including superannuation, for many Australians is ASIC’s Moneysmart. It includes a superannuation calculator designed to determine how much super a member will have when they retire. The inputs include age, income, desired retirement age, super balance, employer contributions, personal contributions and fund fees.
The default investment return is set at 7.5% (before taxes, fees and inflation), updated as at 17 April 2020.
Similarly, every major superannuation fund provides its members with some type of online calculator. Over 90% of the members of AustralianSuper, Australia’s largest super fund, choose the ‘balanced’ option, with an objective of CPI plus 4% and an investment timeframe of 10 years. The return assumption is about 7% at the moment.
With Moneysmart at 7.5% and a leading industry fund at around 7% for the default option, the question must be asked: Are they dreaming?
The most obvious factor reducing future returns is the fall in interest rates. Global and Australian markets are at the tail end of a 30-year bull market in bond rates. Fixed income and to a lesser extent, cash, have been an attractive part of the asset allocation in the last few decades.
The extraordinary result is that between 1950 and 2019, the 20-year rolling returns (in nominal terms, not adjusted for inflation) for the S&P500 averages 17% per annum, while bonds delivered 12% and a 50/50 blend a wonderful 14% (Australian market returns would be marginally less).
That’s a retirement tailwind that should go straight to the pool room.
However, the starting point for future returns is a cash rate and bond rate of 0.25%. The Reserve Bank has signalled ultra-low bond rates for many years to come, driven by the imperative to recover in a post-coronavirus world.
But these were glorious investment conditions enjoyed by Pre-Boomers, Baby Boomers, and to some extent, Generation-X. Unfortunately Gen-Y (the Millennials) and Gen-Z are unlikely to have it so good.
All that matters now is the future
While there are as many forecasts in the world as there are economists, let’s draw on four forecasts to glimpse into the future.
1. Elroy Dimson and the London Business School
The Global Investment Returns Yearbook is a global authority on long-run asset returns. Its current edition quotes the lead author, Professor Elroy Dimson forecasting lower future returns because:
“It’s real interest rates that provide the baseline for all risky assets, and when real interest rates are low, so are expected returns.”
Professor Dimson, together with his colleagues Professor Marsh and Dr Staunton, expect prospective real returns from equities to be somewhere in the region of 3.5%. However, in a typical 60/40 balanced portfolio used for the default option in most Australian super funds, 40% of the portfolio in fixed interest will probably contribute little.
This means the future balanced portfolio may deliver a real return of only about 2% a year.
Global Investment Returns Yearbook, 2020 edition, likely future returns

Reproduced with permission from The Global Investment Returns Yearbook, written by Elroy Dimson, Paul Marsh and Mike Staunton. Copyright © 2020. See acknowledgement at the end.
2. Robert Shiller’s implied future market returns
Nobel Laureate, Professor Robert Shiller of Yale University, invented the Shiller Price/Earnings (P/E) Ratio and it has become a standard to measure the market’s valuation. Further details are available here and his data base is here.

As at 4 May 2020, the current Shiller P/E of 27 was 57% higher (the red line above) than the historical mean of 17 (the black line above).
Based on current P/Es and reversion to the mean to calculate the future stock market return gives around 0.2% (real) a year. (For source and more information see Gurufocus).
The market is expensive and this will reduce future returns. However, Shiller places it in the context of the alternative of the extremely low rates on bonds. He wrote in The New York Times on 2 April 2020:
“On balance, I’d emphasize that the stock market is not as expensive as it was just a month ago. Based on history, we would expect to see it to be a reasonable long-term investment, attractive at a time when interest rates are low.”
3. Research Affiliates’ interactive forecasts
The work of Research Affiliates and its expected return models allows investors to check forecasts across a wide range of asset classes.
Research Affiliates’ Selected Returns for 10 years, as at 31 March 2020

These real returns offer little prospect of achieving the 4% to 5% assumed in superannuation calculations.
4. Schroders Australia
Schroders Australia gives a local perspective, and for Australian equities over the next 10 years, the forecast is 10.2% (nominal):

In other asset classes, forecasts are 4% for US equities, 6% for global equities, 7.5% for A-REITs and 1% for Australian Government Bonds. This means an allocation of 60/40 (say 30% global equities, 30% local equities and 40% bonds) is forecast to deliver about 5.25% nominal, or 2.75% real.
What should a superannuation member do?
For all the expert opinions, personal judgement of a realistic future return is the final arbiter. For extra security in retirement, instead of expecting 5% above inflation (or a vibe of 7% to 7.5% nominal), aim for closer to 2% to 2.5%.
Baby Boomers who have already built their retirement savings will need to watch drawdown levels, as spending 5% of a pension fund might erode capital quicker than expected. Millennials and Generation Z who are saving may need to put more into superannuation or work longer than their parents to achieve the same balances. The reality is that return for risk payoffs are now lower.
Here’s some final words from Robert Shiller’s April article:
“As a practical matter, my advice is to look at your portfolio to make sure that it is not so heavily weighted to stocks that further losses would be unbearable. Otherwise, I’d try not to worry too much about the stock market. Most likely, it will do moderately well in the coming years, even if there is a risk that you will need to be very patient.”
If someone suggests a 7.5% future return assumption on a balanced fund, “Tell ’em they’re dreamin'”.
In our recent Reader Survey, about 40% of respondents reported portfolio losses of over 20% between January and March 2020, although the market rise since the lows has pared back some of the pain. Anyone relying on their investments to fund regular spending will not only be concerned about the loss in capital value, but also the reductions in dividends. National Bank has lowered its interim dividend from 83 cents to 30 cents and ANZ Bank has cancelled it completely in a sector which traditionally provides one-third of all dividends in the listed market.
Market recovery patterns
Contrasting ‘investors’ with ‘traders’, most people do not make radical changes in their portfolios based on short-term volatility. That’s a good thing, as picking tops and bottoms is almost impossible, even for professional fund managers who stare at screens all day. A well-designed investment plan should focus on long-term goals and needs, and not worry too much about monthly variations. Volatility is the cost of participating in the long-term benefits of share investing.
Regardless of an investor’s ability to look long term, two questions remain:
1. How often does a diversified share portfolio lose money?
2. How long does it usually take to recover?
We opened the Morningstar Direct database for the Australian All Ordinaries Accumulation Index to measure the total returns (including dividends) over one year, three years and five years since 1983. For the five year, we did a check using the Canadian Total Return Index, given the similarities between the Canadian and Australian markets.
There are good reasons to take comfort from the charts, and the pictures ‘tell a thousand words’. Of course, Covid-19 is a unique threat, and only time will tell whether ‘this time is different’.
One-year returns
Australian equity investors should expect to lose money for one year in every four to five years. Anyone who considers this loss of capital unacceptable should hold a more diversified portfolio including other asset classes, because over time, the same pattern will probably repeat.
(In the chart, 0.1 equals 10%, 0.2 equals 20%, etc. Yes, the All Ords rose 67% in 1983, and fell 40% in 2008 and rose 40% in 2009).

Three-year returns
Moving to a three-year horizon of annualised returns (that is, 1985 shows total returns over 1983, 1984 and 1985, annualised) shows good years regularly offset down years, such that over 90% of three-year periods produced a positive result. Over the period, only the severe loss of the GFC carries into other years.

Five-year returns
Similarly for five-year performance, now about 19 times out of 20, the All Ords produced a positive result.

Canadian Total Returns over five years
The Australian economy has experienced almost 30 years of economic growth (which will be punctured in 2020), so as a quick check on whether the above numbers are an Australian miracle, here are the Canadian Total Returns numbers for five years. There are no five-year losses.

A longer-term perspective of 120 years
Taking the data back to 1900 shows annual returns are positive in 80% of years, and the average annual return (nominal, not adjusted for inflation) for the All Ords Accumulation Index is 13.2%. Remember that inflation has reached double digits in the past so this number in no way reflects real returns or the potential for the future.
Over this longer horizon, and measuring returns over a decade, Australian shares have generated positive returns 100% of the time and 82% for US shares.
All Ords Accumulation Index, annual returns for all years since 1900

Bull and bear years since 1980
Finally, defining bull and bear years as 20% rises or falls in this Vanguard chart of the All Ords index shows that in the last 40 years, persistence with equity markets usually pays off. The bear markets have been much shorter and shallower than the bull markets.

Is the past a prologue?
We will only know if this time is different when we look back in a few years, and given the uncertainty in the market, there could be another leg down from the recent drop. Taking history as a guide suggests those who do not panic are likely to be rewarded over the long term.
Past performance does not necessarily indicate a financial product’s future performance.
Executive Summary
Near-term news is likely to get uglier, but increased collective effort globally is expected to lead to containment of the coronavirus outbreak sometime over the next nine months. We base our view onhistorical analysis of previous pandemics as detailed in our March 9 report, “Coronavirus: Widespread Disease but Drug Pipeline Progress.”
Experience with previous pandemics informs our assessment of a range of likely outcomes for global economic growth in 2020. We expect near-term impact to be savage, shaving off 2 percentage points from global GDP growth. However, we anticipate a vaccine ready to be deployed by mid- to late 2021, setting the stage for a return to normality. We expect a quick recovery of the global economy in 2021. The fast and furious monetary and fiscal interventions announced by central banks and governments globally provide enormous tailwinds for the world economy to grow above trend and undo most of the damage by 2024.
It has been difficult to keep on top of the rapidly shifting environment, but collectively we find more opportunities to buy than sell shares at the current level. Because this event presents a sharp short-term economic fallout for many companies, we think this crisis will certainly favor companies with economic moats and financial strength. We think there are a number of moaty names that investors should consider adding to their portfolios as well as heavily sold-down stocks that could see a good postvirus bounce.
In this report, we highlight 10 stock picks for each of the four main regions that Morningstar equity analysts cover: North America, Europe, Asia, and Australia and New Zealand. We can’t begin to suggest when equity markets may bottom out, but we like where we see good value versus risk. We also focus on answering key questions investors may have about the impact on specific industries. We discuss emerging trends and disruptions and assess the likely near- and long-term impacts of those issues.
Key Takeaways
- We expect the coronavirus impact to be severe in 2020, with global GDP growing 2% below trend. This presents near-term downside risk to consensus earnings estimates and dividend yields.
- However, markets are too pessimistic, extrapolating the weak economic outlook for too long. We believe a treatment is likely to take the edge off the coronavirus scare from late 2020, with a vaccine available as soon as mid-2021. An abatement in active cases coupled with treatment and vaccine breakthroughs are potential catalysts for a change in market sentiment.
This blog post is an extract from a research piece titled “Coronavirus: Market Temperature Check” on Morningstar Adviser Research Centre. Log in to Adviser Research Centre to read the full article or start your free trial today.
Watch as Christine Benz and Karen Andersen discuss Morningstar’s latest views on stopping the spread of the virus as well as the economic implications.
The circumstances of the current market crash might be unique to the coronavirus pandemic, but they lead investors to wonder: Are such drops normal for equity markets, or is this different?
During the global financial crisis of 2007–09, some observers described the events that unfolded as a “black swan,” meaning a unique negative event that couldn’t be foreseen because nothing similar had happened before. But the data I’d seen from Ibbotson Associates, a firm that specialized in collecting historical market returns (and which Morningstar acquired in 2006 and merged into Morningstar Investment Management LLC in 2016), demonstrated a long history of market crashes. Some ended up being part of a larger financial crisis.
So, if these “black swan events” happen somewhat regularly—too frequently to render them true black swan events—then what are they? They’re more like “black turkeys,” according to Laurence B. Siegel, the first employee of Ibbotson Associates and now director of research for the CFA Institute Research Foundation. In a 2010 article for the Financial Analysts Journal, he described a black turkey as “an event that is everywhere in the data—it happens all the time—but to which one is willfully blind.”
Here, I take a look at past market declines to see how the current coronavirus-caused market crisis compares.
How Frequent Are Market Crashes?
The overall number of market crashes depends on how far back we go in history and how we identify them.
In this case, I consider market crashes over the past nearly 150 years. The chart below uses real monthly U.S. stock market returns going back to January 1886 and annual returns over the period 1871–85, which I originally compiled for Siegel’s 2009 book, Insights Into the Global Financial Crisis. Here, I use the term “bear market” (generally defined as a decline of 20% or more) interchangeably with the term “market crash.”
Each bear-market episode is indicated with a horizontal line, which starts at the episode’s peak cumulative value and ends when the cumulative value recovers to the previous peak.
Market Crash Timeline: Growth of $1 and the U.S. Stock Market’s RealPeak Values
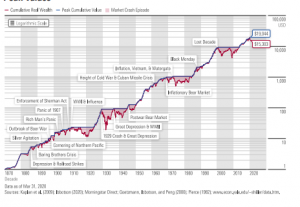
The chart shows that over this period of almost 150 years, $1 (in 1870 U.S. dollars) invested in a hypothetical U.S. stock market index in 1871 would have grown to $15,303 by the end of March 2020.
But it wasn’t a smooth ride to get there. There were many drops along the way, some of which were severe.
The market always eventually rebounded and went on to new highs, but it may have been hard to believe this during some of the long-term bear markets, including:
- The 79% loss due to the crash of 1929, which led to the Great Depression, the worst drop on the chart.
- The 54% drop from August 2000 to February 2009, also known as the Lost Decade. The second-worst drop on the chart, this period started when the dot-com bubble burst. The market began recovering but not enough to get the cumulative value back to its August 2000 level before the crash of 2007-09. It didn’t reach that level until May 2013—almost 12 and a half years after the initial crash.
- The 51% drop between June 1911 and December 1920. This market downturn, the fourth-worst on the chart, may be most relevant to today’s situation, since it included the influenza pandemic of 1918.
These examples show that market crashes have occurred numerous times throughout the 19th, 20th, and 21st centuries (even before the coronavirus crash). Recognizing their frequency can help provide a better sense of the risks of equity investing.
Measuring the Pain of Market Crashes
To measure the severity of each market crash in a way that takes into account both the degree of the decline and how long it took to get back to the prior level of cumulative value, I calculated a “pain index” for each one.
The pain index for a given episode is the ratio of the area between the cumulative value line and the peak-to-recovery line, compared with that area for the worst market decline of the past 150 years. So, the crash of 1929/first part of the Great Depression has a pain index of 100%, and the other market crashes’ percentages represent how closely they matched that level of severity.
For example, the market suffered a 22.8% drop during the Cuban Missile Crisis. The crash of 1929 led to a 79% drop, which is 3.5 times greater. That’s significant, but the market also took four and a half years to recoverafter that trough, while it took less than a year to recover after the trough of the Cuban Missile Crisis. So, the pain index, considering this time frame, shows that the first part of the Great Depression was actually 28.2 times worse than the Cuban Missile Crisis downturn.
The chart below lists the bear markets for the past nearly 150 years, sorted by the severity of market decline. It also shows the pain index and pain index ranks.
Largest Real Declines in U.S. Stock Market History
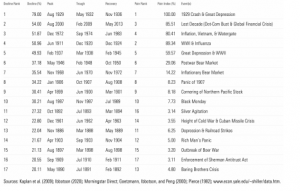
A Direct Comparison of the Most Severe Market Crashes
The chart below places the recent stock market sell-off into the context of the five other most severe market crashes to compare their time to recovery.
The 2020 Coronavirus Sell-Off: How It Compares to U.S. Stock Market Performance in the 5 Most Severe Bear Markets Since 1871
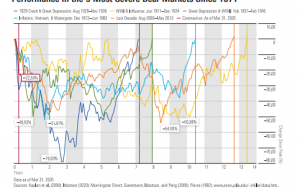
In terms of steepness, the current decline is serious—it roughly matches the initial sell-off during the crash of 1929. The other most severe episodes include the inflationary bear market during Vietnam/Watergate, the second half of the Great Depression/World War II, the Lost Decade, and the World War I/influenza pandemic downturn that I previously mentioned.
Naturally, there’s a lot of variation in the length and severity of each episode. These five market crashes had an average of 57 months between when the decline began and when the market hit its trough, 125 months between when the decline began and when the market reached its previous peak, and a 57.15% decline. And in addition to these episodes, there were also 12 other bear markets over the 150-year period. Overall, bear markets have occurred roughly every nine years.
It’s impossible to know how long this particular decline will last and how long the recovery will take, but these averages make it easier to understand how many times the sky also seemed to be falling over the past nearly 150 years—frequently for longer periods of time—and that the market did always eventually recover its value, and then some.
This pattern is also present around the world. For instance, in Canada, there has been a market decline about once every seven years over the past 64 years. The nuances vary—Canada’s average time to recovery is about 34 months—but the overall trend of regular market crashes and subsequent recoveries is similar.
With Risks Come Rewards for Patient Investors in Equity Markets
This historical stock market return data provides clear evidence that market crashes aren’t as unique as one might have thought. The term “black turkey” is more apt, since they appear every so often—and today’s coronavirus-caused crash is only the most recent example.
Given what this data shows about the regularity of market declines, it’s clear that market risk is about more than volatility. Market risk also includes the possibility of depressed markets and extreme events.
These events can be frightening in the short term, but this analysis shows that for investors who can stay in the market for the long run, equity markets still continue to provide rewards for taking these risks.
This checklist provides behavioral techniques to help clients manage their emotions and their investments.
As the market pendulum continues to swing back and forth, many investors may be struggling to rein in their emotions. During these troubling times, financial advisors can use behavioral coaching tactics to help their clients manage their emotions and avoid making rash decisions.
However, we know this is easier said than done. Client conversations during market volatility tend to be more rooted in the need for reassurance rather than investment analysis. During times of high stress and uncertainty, both of these issues become more complicated as we struggle internally to tune out irrelevant information, have the strength to stick with the plan, and resist the urge to follow a fearful herd.
To help advisors manage clients during market volatility, we created a conversation checklist. It features behavioral techniques you can use to combat the psychological struggle your clients may be facing right now.
A Framework for Handling a Variety of Client Situations
Investors will handle their emotions in their own ways during these turbulent times—not all of them will necessarily be in a state of panic. Some investors may be wary of the situation and curious as to how they should respond. No matter how your client feels, there are steps you can take now to ensure their emotions don’t interfere with their financial decisions.
Our checklist offers suggestions for how to navigate client conversations based on a few different situations:
- If your client is relatively calm but is reaching out to you, this is the time to prepare your client for any emotions that may appear down the road.
- If your client is already overwhelmed by the current volatility, focus on ways that you can help them avoid knee-jerk reactions. The aim of this scenario’s techniques is to help your client take a step back from their emotions and engage in a more thoughtful decision-making process.
- If your client hasn’t connected with you yet, you can be proactive in developing the appropriate way to handle the situation.
Our checklist breaks down the messaging you can use with your clients in all of these situations. It also discusses the tangible next steps you can suggest clients take to stay calm, manage their stress, and remain focused on the bigger picture.
Helping Investors Through This Tough Time
As investors struggle with changes in their routine, market volatility, and COVID-19, an advisor’s role as a behavioral coach may be more important than ever. Behavioral techniques can be an effective way for advisors to help ensure that these current stressors don’t impact their clients’ financial decisions.
The Psychology of Volatility: A checklist for client conversations during
turbulent markets
Investing is more than a mathematical analysis of risk and return. It’s a struggle with ourselves to tune out irrelevant information, to have the strength to stick with the plan, and to resist the urge to follow a fearful herd. Morningstar’s behavioral insights team created this conversation checklist to help advisors guide their clients through this internal struggle and stay on track with financial plans during market turmoil.
Scenario 1: Markets are dropping, and a client calls you to find out how
to respond
Protect against the psychology of panic. Talk to your client about how we all can fall prey to biases and panic, so we should expect it, then handle it.
- Share how our emotions can be our own worst enemy when it comes to investing. Fear narrows attention and induces people to fixate on shortterm headlines, rather than long-term goals.
- Strengthen that point with supplementary information, such as this article that explains where these emotions come from and how we can overcome them in investing.
Set the right narrative. A key lesson from behavioral finance is that raw information (like volatility) can be interpreted many ways, depending on the narrative. As an advisor (and behavioral coach), you have an opportunity to set that narrative, using core lessons from behavioral finance:
- Many people run away from falling markets, and because of that, it can present opportunities for finding good values in the marketplace.
- Short-term volatility is an inevitable part of investing. That’s why our focus is on long-term performance toward investor goals
- Remind your client that their financial plan was developed with their goals in mind, and (if they are) that they’re still on track to meet their long-term goals with their current asset allocation and time horizon.
Set up future frictions. If a client is paying attention to what’s going on in the outside world but hasn’t panicked, it’s an ideal time to prepare for future concerns. In particular, you can agree on intentional points of friction that will help your client take a step back from their emotions if they start feeling panicked later:
- Agree on a three-day wait rule, where you can’t act on certain client decisions for three days.
- Agree that a loved one or a spouse must sign off on certain client decisions before you can act on them.
Commit to the future. Ask your client to write a letter to their future selves. This letter should entail two things: why your client started investing in the first place (their goals) and why it’s important to stick to their financial plan no matter what. This letter then becomes a promise to themselves to hold steady throughout volatility.
Scenario 2: Markets are dropping, and a client calls you, panicked
Review the techniques above. Depending on their emotional situation, you may still be able to:
- Teach in the moment on the universal nature of our investing biases–researchers have found that these insights on how we all suffer from them can help people recognize and overcome them.
- Set the right narrative of opportunity, of countering the herd, looking for long-term value, and focusing on goals.
Focus on something else: Goals. Remind your client why they are investing in the first place. This can be accomplished with a simple conversation regarding their investing goals or an in-depth exercise that helps slow down and dig into the goal-generation process.
Focus on helping others. One way to help your client break free from an undue focus on short-term performance is to focus on the good they can do for others–in both daily life and investing.
Decrease the noise. Ask your client to ration their access to the news. Trysetting up rules for when to catch up on market news. Researchers have found that the more frequently people look at market news, the more it warps their investing behavior. Some financial media is designed to be sensational and attentiongrabbing, but this kind of approach typically doesn’t promote even-keeled, longterm thinking. Encourage your client to turn down the noise.
Practice anxiety reappraisal, which is reframing nervousness as excitement. Help your client see a downturn as a way to buy securities at a discount.
Scenario 3: Markets are dropping, and a client hasn’t called. Should you be proactive?
Prepare, but wait. Get your response and the information you need to support it ready, but don’t assume they are panicked. People close to the industry feel volatility much more, and faster, than people outside the industry. There’s some initial evidence that reaching out to people and telling them “don’t panic” gives them a signal that they should panic.
Introduction
Financial professionals know that market volatility is inevitable—what goes up must come down—and, accordingly, we prepare for it in the investing decisions we make for ourselves and our clients. But the severe shock brought on by COVID-19 brought unprecedented volatility and repercussions that have reverberated through our daily lives. How can we make sure our clients’ emotions don’t get in the way of their better judgement when making financial decisions? And how can we plan ahead, when things are calmer, for the emotional rollercoaster that comes with future market movements?
Questions like these are the ones behavioral science tries to answer. We know that our minds can lead us astray, especially when making financial decisions, but there are ways that advisors can help clients stay on track. This guide explores behavioral principles and techniques you can implement to help investors stay on track during market turmoil. We begin by explaining why our minds can be our own worst enemies during volatile times, and then we dive into a framework that advisors can use to help investors avoid mental missteps.
A Behavioral View of the Mind
Researchers sometimes characterize the complexity of our minds as two stylized “Systems:” System 1 and System 2.1 Both are essential and important in their own right, but they operate quite differently. System 1 helps us make everyday decisions and react quickly when we need to, while System 2 helps us make more deliberate decisions and work on more complex tasks. For both our intuitive reactions (System 1) and conscious thought (System 2), our minds try to save energy by using shortcuts to make decisions more quickly. Normally this works well, but biases pop up when our natural shortcuts lead us to the wrong conclusions. When they affect our finances, many biases can have big implications.
Volatile times can also make us more prone to behavioral mistakes. The emotional rollercoaster that comes with extreme volatility can cause distraction that nudges us to depend on our System 1 more often. Because of COVID-19 containment efforts, the everyday schedule and habits that help us make daily, easy decisions—like what time to eat lunch or get up in the morning—aren’t there anymore, so our minds must work overtime. On top of that, our minds may be largely occupied by other worries—the health, safety, and economic troubles of loved ones and ourselves.
An overworked, tired, and distracted mind is bound to take more shortcuts than usual, forcing us to depend on System 1 more often and increasing the chance we’ll be swayed by behavioral biases.2
Behavioral science research has documented over a hundred different biases that can lead us astray when making decisions. This paper focuses on a few select biases that are particularly pernicious when it comes to market volatility.
Recency Bias
When we predict what’s going to happen in the future, our minds naturally reach for what happened most recently.3 In part, that is because our brains have an easier time remembering what just happened versus what occurred further in the past. Although this shortcut usually works out for us in everyday life, it can result in us placing undue importance on recent events when we make investing decisions. For many investors, this means that when their portfolio drops 10%, recency bias convinces them that it will continue dropping.
Herding Behavior
When you’re choosing which restaurant to order takeout from, you might consider looking at their reviews online. If one restaurant has plenty of rave reviews, while the other has only a few subpar comments, you will choose the restaurant with plenty of rave reviews. With restaurants and many other parts of our lives, it can be a good idea to follow the crowd. During market volatility however, many investors are overreacting, so the crowd’s usually going in the wrong direction.4 And going against the crowd, especially during times of uncertainty, can feel extremely unnatural.5
Action Bias
“Well, at least you tried.” This common consolation can be comforting and justified in many decisions. Prior research has found that the urge to take dramatic action can trick us in cases where the statistically correct choice is thoughtful inaction.6 During times of volatility, sometimes resisting the urge to “Sell! Sell! Sell!” could be the right decision.7 Doing nothing while markets are dropping is extremely hard for us, however, because it goes against our instinct to take action. In our minds, it hurts less to try something and lose, compared with doing nothing and losing the same amount. If investors don’t calmly think about the appropriate course of action, and give in to action bias instead , it can make their losses objectively worse, but, to them, it can feel subjectively better.
Overconfidence Bias
Do you believe you are an above-average driver? If you said yes, you have agreed with about 90% of all drivers in a famous study of everyday people who said they were above-average drivers.8 Even though we know we all can’t be above-average drivers, our minds tell us that we must be better than the rest. This is overconfidence bias. We all tend to be unrealistically optimistic about our chances of success.9 When it comes to making investing decisions, this can result in investors making rash choices and believing that, when push comes to shove, they will be spared the pain others will experience.
Confirmation Bias
Even if we try to engage in proper research before making a decision, our minds will automatically pay more attention to information that supports our current beliefs. Confirmation bias is our tendency to find and interpret information in a way that supports our opinion, and it can derail even the most wellmeaning investor who is trying to keep up with the news.10
Loss Aversion
One of the most well-known and often-cited behavioral biases, loss aversion, also comes into play with investing. Specifically, a 10% portfolio loss feels a lot worse than a 10% gain for many investors because we are loss-averse: Experiencing a loss generally feels twice as bad as gaining the same amount.11 As market volatility continues, investors may experience strong emotional reactions that cloud judgment. Those are six of the most important biases that come into play during times of volatility. Here are ways advisors can effectively work with clients as they encounter these biases and more in their practice.
Where to Intervene: The Five Steps From Information to Action
Volatility itself is just data: numbers going up and down. A few things happen between a person seeing those numbers and reacting, and at each step there are ways to help change that emotional response for the better. We mapped out the decision-making process during volatility into the following five steps:
1. Investments
2. Information
3. Emotion
4. Decision
5. Action
At each step, we can examine what may be going on in an investor’s mind in those moments, what it can mean for their finances, and behavioral techniques you can use to guide investors in the right direction. Each step contains two sections: One focused on what can be done to prepare before volatility and another focused on interventions that can be implemented while volatility is in full swing.
Investments: Selecting and Setting Expectations
Before
Use bucketing and mental accounting. Even though money is fungible, our minds sometimes assign a purpose to each dollar we generate and spend. We subconsciously place our money into separate accounts, or buckets, intended for a planned purpose ranging from something simple, like gas money, to something meaningful and important, like a child’s education.
One way to help investors manage their emotions during volatility is to help bring out the meaning behind each dollar—such as with a bucketing strategy. Labeling accounts with the investing goal that this money will achieve makes it easier for investors to stay connected to that purpose when volatility arises. A reminder that selling investments from a particular bucket means taking money out of the college fund may be the nudge investors need to stay invested.
Understand risk tolerance. The common approach to preparing clients for volatility is to ask them about their risk tolerance and create a portfolio accordingly. Many investors, however, may not know how they’ll react when losses begin. It’s hard to predict just how strong our emotions will be when markets take a turn for the worse. This is, in part, a limitation we all need to plan for: We should assume that self-reported risk tolerance changes over time, especially now. We can dig deeper by using simulators to help people experience volatility beforehand and looking at past behavior—with data if available.12
Set realistic expectations. It may be worth reminding investors that a well-constructed portfolio that has substantial equity exposure will lose value about one-third of the months in its lifetime. Some investors may not realize that this kind of volatility is normal and should be expected. Helping people understand what “normal” turbulence looks like can help them better understand the journey. Where possible, advisors should make this expectation visual and vivid—don’t just show statistics, but paint a picture to help clients feel the experience of volatility.
During
Focus on goals. We have all seen how focusing on short-term prices can lead to bad choices. While a longer-term focus can help, it’s not always clear how to create that focus. So, we developed a three-step process that can help investors slow down and reconnect with their long-term goals. The process first asks investors to write down their top three investing goals. After that, they’re given a master list of common investing goals and asked to check off the goals they think are important but forgot to mention in the previous round. After that, investors are asked to revisit their top three goals to see if the process has given them new insights into their true priorities. Because it helps investors systematically understand their own preferences when it comes to their financial goals, our research found that most investors end up changing at least one of their top three goals after going through the exercise, so in the context of volatility, it can help investors reconnect with and commit to their goals.
Information: How Much Is Too Much?
Constant market updates can put anyone on edge, especially during market volatility. This tendency to be impacted by the mere frequency of receiving information is called myopic loss aversion. It’s a combination of loss aversion—our heightened sensitivity to losses than to gains—and a narrow focus on the “now,” which can be amplified by how often people check their performance. Every time a client checks their portfolio, they are slicing results into smaller timeframes and giving themselves more opportunities to make bad choices.13 In a study run with experienced financial traders, researchers found that even financial professionals are not immune to myopic loss aversion.14 The more often traders saw price changes, the more risk averse they became, prompting them to repeatedly adjust their risk exposure and undermine overall performance.
Before
Set a regular schedule. How often do you think your clients check their portfolios? Even if your client doesn’t check their portfolio frequently under normal circumstances, their behavior may change when things get rough. You can’t prevent your client from checking their investments, but you can help them focus on long-term performance instead of daily changes. Explain to your client that you will meet with them on a regular basis to discuss their progress towards their goals. Though there may be price changes in the meantime, during those check-ins, you will make sure they are still on track to meet their goals. This long-term, goal-centric view is one of the most valuable nudges an adviser can provide.
During
Set a crisis schedule. As volatility happens, you can also actively encourage clients to avoid checking portfolios every day (or even more often). Prices change with such velocity during volatile times that some clients may even need a reminder that they shouldn’t constantly refresh their portfolio performance page or tap at their cell phones. These are the times when you can work with your client to structure how often they check their portfolios or look at market news. Start off by encouraging your client to catch up on the news only once at the end of the day, or even just once a week.
Emotion: Understanding Our Biases
Many investors don’t appear to recognize that their investing decisions are impacted by their emotions. Our research found that investors don’t understand the importance of advisors helping them manage their emotions.15 This blind spot can be dangerous, especially during market turmoil when our emotions take the driver’s seat more than ever. Nevertheless, advisors can help. Here are some techniques advisors can use to handle the emotional response to market volatility.
Before
Educate about biases. Before volatility hits, clients may benefit from understanding the psychology behind their emotions. Research finds that educating people about the biases we all face, as investors and human beings, helps them recognize the impact of biases in their own decisions.16 In the adviser-client relationship, this can mean discussing behavioral concepts with your client and explaining prevalent biases, such as recency bias, herding behavior, and action bias. A “we all have this” approach avoids judgment and condemnation to help investors (and advisors alike) recognize the challenges we all face.
During
Set the narrative. Market volatility typically presents many opportunities that arise from mispricing, where quality investments sell for low prices, but this may be hard for clients to recognize. This is a time for advisors to re emphasize to clients that logical investing decisions should be made based on the quality and value of the investment, not just price. Helping your clients think about market volatility using this framework gives them a narrative they can depend on during downturns.
Anxiety reappraisal. We can’t completely erase our biases, but we can find ways to accommodate our biases when it comes to investing decisions. Instead of trying to suppress our biases, we can harness those emotions and rename them. Research suggests that the physiological basis of anxiety—like a faster heart rate or wobbly knees—is actually very similar to that of excitement.17
Anxiety reappraisal
Takes feelings of anxiety and calls them by a new name: excitement.18 Instead of letting investors give in to the anxiety that can come with market fluctuations, advisors can help clients get excited about the possibility of buying some securities at a discount and maybe reaching some of their stretch goals.19
Look to help others. There are also ways to help us manage the emotions around our finances in ways that don’t concern our finances at all. Recent events have left many people struggling, and encouraging clients to see what they can do to help their communities and fellow human beings during tough times may help them control their own emotions.20
Decision: Intervening at the Right Moment
Even if an investor’s panic can’t be reframed or avoided, there are ways to prevent emotions from impacting their final decisions.
Before
Pre-commitment devices. These devices are techniques that help investors persevere through future moments of weakness by locking in decisions during moments of strength.21 When you’re developing a financial plan with your client and they’re optimistic and at ease, ask your client to write a letter to their future self. This letter should explain what they really care about, what matters to them in their finances, and why they’re going through all this trouble in the first place. Once your client is finished, ask them to commit to and sign the document, then give it back to you. When there’s volatility and your client calls you, panicked, send them this letter. There on the page, in their own words, is a reminder that explains why staying on track is important to them personally.
During
Add friction. There are also other ways to introduce friction during those crucial moments to prevent your client from making a hasty decision. When clients make a sale decision with Betterment, an online investment company, clients are presented with a gentle reminder of that trade’s tax consequences. Betterment found that people hate paying taxes even more than they dislike the prospect of losing value in a further market downturn.22 This layer of friction prevents clients from falling prey to recency bias by prompting them to think twice about their actions and nudging their “System 2” brains into action.
Explain the opposite. Another nudge that may help turn investors around can be to ask them to explain the opposite.23 If they’re starting to lean toward selling most of their investments to avoid future losses, ask them to explain why someone else might buy those same investments. This technique is a great way to combat confirmation bias. If your client mentions that many of their acquaintances have cashed out, ask them to think about why it might be a bad choice to follow them.
This lesson—of looking for opposing opinions—can also help investors when they’re looking at information online and may need help getting a balanced picture. If they keep coming across sites and articles that support their opinion to sell now, for example, challenge them to provide data that convincingly shows the opposite. Some investors may need an explicit reminder to keep an eye out for perspectives that differ from their own.
Vividly remember lessons from history. Amid panic, it’s easy to fall prey to recency bias and believe that the market’s going to continue dropping. At the same time, it can be hard to remember what happened last time. We can’t predict the future, but historically, markets have always recovered. Many investors may benefit from being reminded of this fact. For example, Exhibit 1 shows how investors who got out of the market during the Great Recession of 2008/2009 were a lot worse off after just a few years than those who weathered the storm. Looking back at previous examples of volatility can help investors make more-prudent decisions when it matters most.
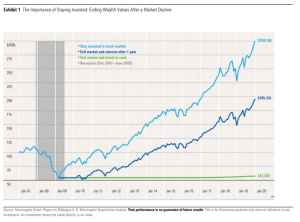
Action: Setting Up Barriers
Despite your best efforts, there will always be clients who still want to take action by pulling out of the markets during a downturn. At this point, advising your client not to sell off will only fall on deaf ears, or, in the worst-case scenario, anger them to the point where you lose their business. Though it seems like your hands are tied, advisors can still help their clients thoughtfully reevaluate their plans by slowing down the action.
Before
Cool-down periods. Setting up barriers to action can give your client time to take a step back from their emotions and engage their “System 2” brains.24 One way to create these barriers is to come to an agreement with your client beforehand that says regardless of their decision, you, as their adviser, cannot act on it for three days. Or you could agree that a loved one or a spouse must sign off on decisions before you can make any changes. These tactics create a built-in cool-down period that gives your client time to move past their own biases and see if they have made a logical decision.
During
Take a strong (different) action. As previously mentioned, we can be prone to action bias during volatility: As our portfolios hemorrhage money, we want to do something to stop the bleeding. Instead of trying to suppress that urge to take action, a better strategy may be to redirect it. When an investor wants to make a move, guide them toward taking the right action instead of simply telling them not to take the wrong one. Times of volatility can be opportunities to rebalance an investor’s portfolio—when stocks are down and bonds are up, we maintain our asset allocation by selling high and buying low25— increase their savings rate to take advantage of market weaknesses, take advantage of tax-saving opportunities, and capitalize on lower interest rates. As advisers, you can help clients redirect their attention and need for action toward moves that can help them take control of the finances, even during times of market volatility.
Working Around Investing Biases During Times of Volatility
We all know to expect market volatility, but the emotions we feel during it can be even more dangerous than market movements themselves. When stress and anxiety are high, it’s easy to give in to our biases and let them cloud our better judgments. This is when we must remember that our biases are fundamental to who we are, and we can never completely erase them.
Interventions such as changing the frequency of information or reframing market volatility can help your clients overcome their biases, not do away with them. Using techniques from behavioral science, we can also plan for times of stress and volatility. We can work to prevent biases from derailing financial plans, by making it easier for clients to make the right decision when it counts, stay focused on the long-term, and help them successfully reach their financial goals
Coronavirus is affecting the global economy to a greater degree than any previous event.
Global supply chains are so interwoven that the initial disruption in the world’s largest
manufacturing centre triggered a meaningful slowdown in world trade and economic
activity. The spread of the virus and the ensuing lockdowns in critical economic hubs in
the US and several countries throughout Europe sent concern levels off the charts. For
now, the developed economies are taking the brunt of the impact.
Stimulus packages by governments and central banks are similarly unprecedented. In the
GFC, central banks bailed out the financial system. Liquidity was pumped into the system
via unconventional quantitative easing as trillions of dollars of financial assets, including
sovereign bonds, corporate bonds and residential mortgage-backed securities, were
purchased from banks and other financial organisations. This liquidity, associated with
all-time low interest rates, was the driving force behind a record-breaking run in risk asset
prices, predominantly equities, in recent years.
In the current crisis, it is labour—the workers—and consumers who must be bailed out,
just as capital—the financial system—was bailed out in the GFC. In the post-GFC bull
market, capital had a fantastic run. Investment returns were supercharged. Over the same
period, labour’s share of national income declined. Perhaps the coronavirus outbreak is
nature’s way of evening up the slate. Now the shoe is on the other foot and this could be
another example of reversion to the mean about to play out.
Disappointingly, comments from a Wall Street strategist, “What the Fed did is important
because it does help in the credit markets. But it’s not enough from an equity market
perspective”, demonstrate Gordon Gekko’s “greed, for the lack of a better word, is good”
mantra is alive and well, despite the trillions made since 2008. This is selfish, gluttonous
and very disturbing.
While central banks have unleashed substantial packages, governments have also raised
the stakes on the way to a combined “all in” approach to settle the economic disruption.
With governments being much more proactive in underwriting the rescue, in normal
circumstances their debt levels would meaningfully increase. Governments will require
their respective central banks to crank up the printing presses to provide the vital liquidity
to inject into the workforce and support consumption.
But due to the sheer scale of the monetary rescue package, some suggest Modern
Monetary Theory is now being put into practice, with central banks to print cash without
any corresponding government liability. This blows apart the traditional fundamental
principle of double-entry bookkeeping and accounting that states every financial
transaction has equal and opposite effects in at least two different accounts, which
satisfies the accounting equation: Assets = Liabilities + Equity. Going down this route could open a potential Pandora’s box for financial engineers.
It is likely central banks will be required to purchase bonds from governments to monetise
the economy. Central bank balance sheets will move to levels previously only thought of as
fictional. The US Federal Reserve’s (the Fed) balance sheet could increase to over US$8
trillion, from the current record US$4.7 trillion, as Chairman Jerome Powell stated the Fed
will buy US Treasuries and mortgage-backed securities “in amounts needed” to support the economy while launching new lending programs to support commercial, municipal and asset-backed debt markets. Translated into Mario Draghi-speak, this means “whatever it takes”.
It is unlikely institutional investors will line up to buy meaningful swags of government
bonds at current depressed yields. Just as central banks are the lender of last resort, they
may also become the buyer of last resort in the current crisis.
Ideas to think about before the dust settles
When the coronavirus is finally referred to in the past tense and things return to normal,
there will be a lot of soul searching. But financial markets along with all aspects of life will
ultimately normalise. I want to focus on a couple of ideas, some might think of as inane or
even insane.
The widespread closure of offices and the forced remote working will have management
asking questions. Subsequently, there will be reviews into productivity and the physical
and mental wellbeing of their employees. A key question is likely to be, “what is the right
balance between working in an office or from home in future?” The outcome is unlikely to
be positive for the owners of office towers. Going forward, are office REITs likely to be a
good investment?
Are there opportunities in the unloved retail REITs—Scentre (SCG), Unibail Rodamco
Westfield (URW) or Vicinity Centres (VCX)? Are very depressed prices signalling dilutive
equity raisings are on the way? I think shopping malls will continue to have a meaningful
place in the retail industry, while acknowledging the intrusion of the online digital channel.
Once the self-isolation period is past, malls will be crammed as the population craves for
open spaces and fresh air.
I have always thought investors should not buy vanilla REITs at a premium to their net
tangible asset (NTA) backing. Over the past decade, some have developed funds
management operations providing valuable annuity streams of income. Goodman Group
(GMG), Charter Hall (CHC) and Dexus (DXS) to a lesser extent, come to mind. The greater
the importance the funds management in the group income stream the larger the likely
premium to NTA. (Exhibit 1).
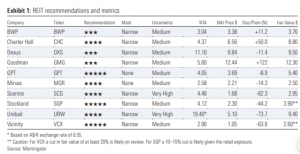
In the frantic search for yield, many REITs sold at premiums to their NTA as security
valuations were pushed higher by low discount rates and property valuations assisted by
declining capitalisation rates, both linked to the falling risk-free 10-year bond yield.
Remember, cash flow is the most important determinant of valuation, not the discount rate
applied to the cash flow.
Australia is one of a few, perhaps the only, country in the developed world with the
potential to double its population over the next 50 years. New Zealand may also qualify on
a smaller scale. Population growth will be a long-term tailwind for the owners of Tier 1,
strategically located retail assets. Humans are social animals. They do not enjoy prolonged
confinement, as the current situation is proving, and are likely to continue purchasing most
of their requirements in bricks-and-mortar facilities. There may be an opportunity in the
beaten-down retail REITs space.
Elsewhere, the embarrassing scenes in supermarkets of recent weeks reiterated the
demand for necessities had soared to levels never seen in this country, not even in
wartime. The elevated demand is global and while it is obvious the suppliers are flat out,
packaging companies are also sharing in the positive environment. Manufacturers of
flexibles, rigids and cardboard, including Amcor (AMC), Pact Group (PGH) and Orora (ORA)
are likely to report strong 2H20 and FY21 results. Brambles’ (BXB) CHEP pallets would be in
high demand across its global operations to support the movement of packaged goods
throughout the economy.
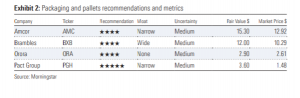
I am not suggesting one starts buying any or all the above companies now. In a rapidly
changing world, there could be changes to our ratings and forecasts. I have tried to provide some ideas that could be revisited when the investment climate justifies. Our recommendations are valuation rather than timing-based, which is relative in times of extreme volatility.
The Tina (there-is-no-alternative) Turner anthem Simply the Best drove and best described
the surge in equity markets and the investors worldwide joined in. But despite calls for
caution and prudence, I suspect not many investors tuned into and embraced Johnny
Cash. So, now perhaps they are humming Roy Orbison’s It’s Over and maybe Crying.
Dividend yields of 4% and 5% in January and February have morphed into “temporary”
paper capital losses of 30% plus. In some cases where the dividend has been withdrawn,
the yield was illusory. It will take several years for the capital value to return, but just as
was the case for purchases made prior to November 2007, value in sustainable companies
will return.
Markets are currently finding a little breathing space as more and greater rescue packages are announced. The sellers are showing some signs of exhaustion and the bear has nodded off, both temporarily. We will see rallies in this unfinished bear market. Use rallies to cleanse your portfolios of the lesser quality holdings. This bear still has some life. Continue to use cash sparingly and be careful when new equity is being shopped around at what may look like an attractive discount.
Yes, everyday we are getting closer to a vaccine and the pandemic being classified as past.
But economic disruption will continue for some time. It looks like Australia and several
other countries will record negative GDP growth in 2020. Record debt levels persist and are
being added to, so the underlying problem will still exist even once the virus has passed.
Other non-related comments
With the government’s attention on the health and economic crisis are the energy
companies up to their old tricks? I just received notice from AGL Energy that my expiring
plan would move to a new plan in May. Based on the same annual consumption, the
increase is 18.3%. So much for electricity prices falling, as the government suggests. AGL
has one less customer. Are you in the same boat?
Isn’t it strange the recent rainfall on the east coast, where most of the country’s population lives, has put out the bushfires and filled up the dams, just as we now need to wash our hands multiple times a day?
Initial shock
Typically, bear markets have four stages.
Stage one is recognition. Almost everybody shrugs off a bear market’s initial slide as being an ordinary event. The markets rise, and they fall. Treating every bad week as the bear’s arrival would not only shred one’s nerves, but would cause poor performance, should the investor act upon that instinct. Nine times of out 10, realising a quick 5 per cent or 10 per cent loss would result in a permanent 5 per cent or 10 per cent loss, as stocks quickly return to their previous level.
This market achieved stage one during its third week. Stocks were up slightly for the year, before suddenly dropping 11 per cent in the last week of February. In response, advisory firms issued reassuring notes about how these things happen, and market volatility is natural. The stock market surged the following Monday, failed to hold its gains, and then collapsed in week three—that is, last week. The bear was on.
Stage two is panic. This occurs when shareholders realize that the standard advice failed. Buying on the dip wasn’t easy money, as it is nine times in 10. Rather, it led to greater damage. Along with the pain (and regret) of unexpected losses comes the surprise that the conventional wisdom was wrong. Investors’ faith is tested—and some are found wanting. They sell first, then ask questions later.
We are currently in stage two. It could hardly be otherwise. Along with 1987’s bust, the current stock market crash—it fully deserves that name, with the Dow at the time of this writing being down 34 per cent from its peak—has been the fastest stock-market descent since The Great Depression. It is difficult to apply rational analysis when so much happens, so quickly.
View from the bottom
Stage three is stabilisation. Stocks halt their decline, thereby ending the impression that they will do nothing but fall. The panic subsides but the situation remains grim. Investors believed during the first stage that stock prices slide on a whim. Now they realise that equities stumbled for good reason, and that until that reason is eliminated, they will continue to struggle. Shareholders’ losses will not soon be recouped. This period is marked by turbulence. Stocks rally, sometimes furiously, only to be knocked back down. Investor sentiment varies between guarded optimism that the end is at least remotely in sight, and despair that the hope was false. This is typically the bear market’s longest period, extending for several months.
Stage four is anticipation. This is when stocks start their recovery. As with the bear market’s beginning, almost nobody recognises its end until after the fact. The news at the time tends to be almost unrelievedly grim, accompanied by articles about how stocks’ golden days have passed. However, some investors perceive economic improvement distantly in the future. They make their bids, and stocks begin to rise.
A classic case occurred in March 2009. The recession was in its terrifying midst. Real US gross domestic product declined that quarter, and the next quarter, and the quarter after that. The Morningstar Ibbotson Conference was held that month to empty seats, with the keynote speaker predicting several more months of equity losses. The rally began the next day.
Looking forward
This scheme applies to bear markets that are primarily caused by recession fears. In addition to the two historic bears charted above, the scheme can be used to map the much smaller slump of 1990, and 1981’s decline, and 1970’s sell-off. Of course, the details for each of those markets vary, sometimes substantially—it would be reductive to imply otherwise—but the pattern is roughly similar.
However, the blueprint does not work for bear markets that arise from other causes. For example, the stock market’s grinding decline from 1973 through 1974 doesn’t map well to the four stages, because it was caused by steadily increasing inflation fears. The 2000-02 technology-stock implosion also fails the test, because the major concern as the New Era concluded was that equity prices had risen too high, not—aside from some of the Internet stocks—that earnings would disappear.
The question then becomes, does the current bear market fall into the first category or the second?
The former would be greatly preferable. With that scenario, the enormous uncertainty about the spread of the coronavirus, and the economic damage that the containment efforts will wreak, disappears over the next few months. The problems will remain large and numbers, but they will at least be known quantities—and the financial markets are adept at planning for what is known.
Should the picture become clearer, the four-stage scheme figures to be relevant. Fairly soon, I should think, stocks will enter the third stage, that of stabilization. That doesn’t mean that they won’t decline further, but the struggle will at least be bounded. Within months, not years, the stock market recovery should begin.
On the other hand, should uncertainties remain high and unresolved, perhaps because the virus’s behaviour confounds the scientists, or because the financial stimulus efforts prove ineffective, then all bets are off. I do not know how to analyse such a situation. I hope that I never shall.