Cost is a key consideration for investors. Morningstar research and academic studies have repeatedly
demonstrated that fees are a reliable predictor of the future success of a fund. Indeed, we revamped our Morningstar Medalist Rating methodology in 2021 to gauge the rated share classes by their respective fees to better reflect the impact on their net-of-fees expected alpha.
This is not to say that investors should only look at fees when evaluating funds. Qualitative factors such as the investment team, investment process, and parent organization are also vital when determining a fund’s outperformance potential. Still, lower-cost funds generally have a greater chance of outperforming their more expensive peers. In this article, we provide evidence to show the predictive power of fees across most categories.
The Test
We examined a pool of funds that investors would have had access to at the beginning of a given historical period. That includes funds that no longer exist. This aims to mirror the experience of investors and the potential choices they would need to make, without requiring prior knowledge of subsequent fund closures. To ensure relevance to Australian-based investors, we included only share classes that are domiciled in Australia.
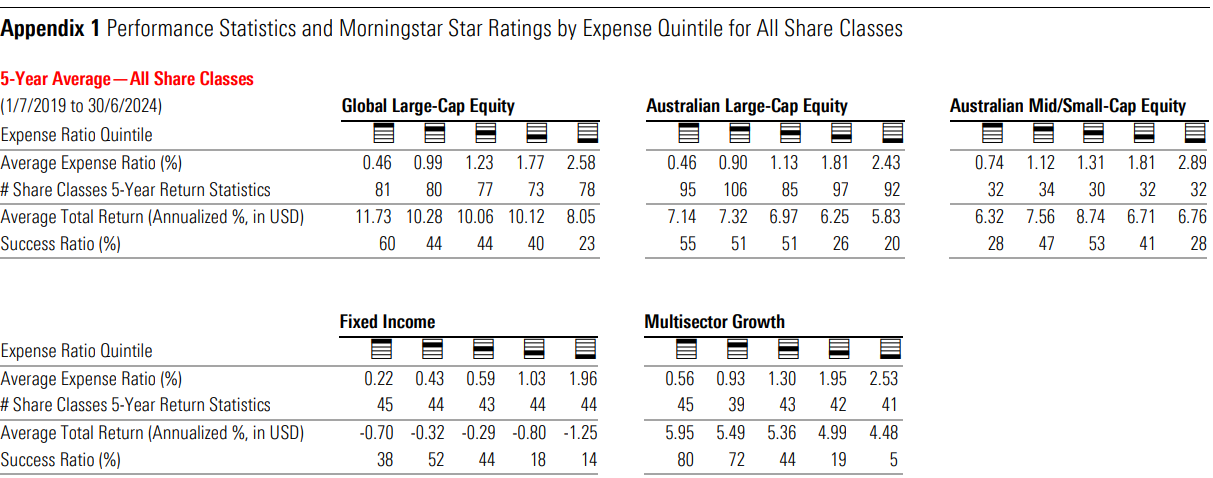
For our test, we began by grouping broad categories to build significantly sized categories, namely, combining style factors for equity funds and grouping Australian and global-bond categories. Then we split fund share classes into fee quintiles based on their relevant grouping. Here, we focused on core asset classes that Australian investors typically consider when building their portfolios, such as Australian largecap equity and fixed income. Then, we looked at the relationship between the average total returns and average fees across the quintiles of these categories for the five years ended June 2024. For each quintile, we further calculated a success ratio, which indicates the percentage of share classes that survived and outperformed their Morningstar Category peers. Only share classes that did both counted toward the success ratio, as it is hard to argue that funds that no longer exist or underperformed were successful. In other words, the success ratio factor in funds that were merged or liquidated over the ensuing time period, which investors may have invested in at the time.
We used “representative cost”, a Morningstar proprietary data point that indicates the reoccurring costs for the share class as levied by the management group, calculated using the fee measure most relevant to the local market. This measure does not include one-off costs nor costs levied by third parties such as investment advisors or platforms.
The Result
Across most categories that we examined as part of this study, the cheapest quintile achieved a higher
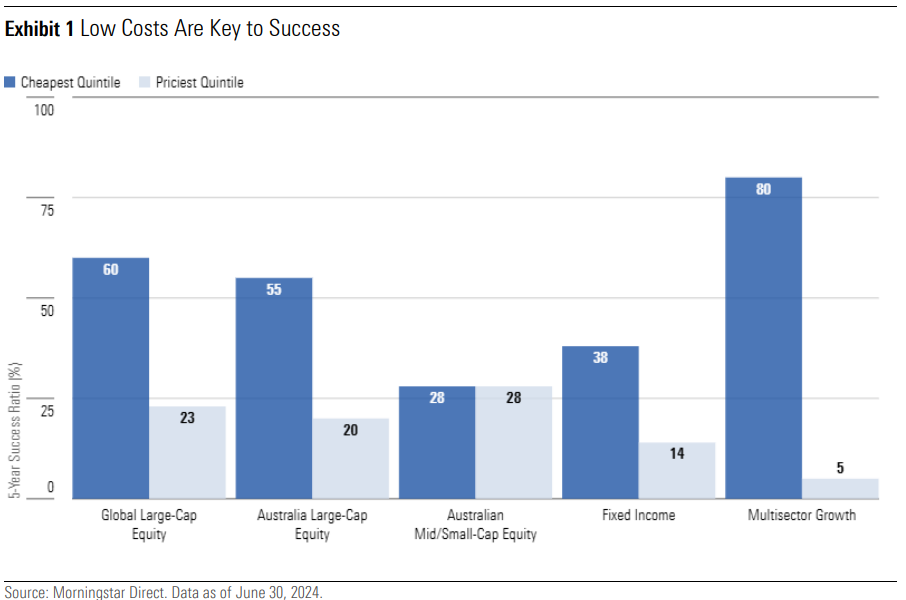
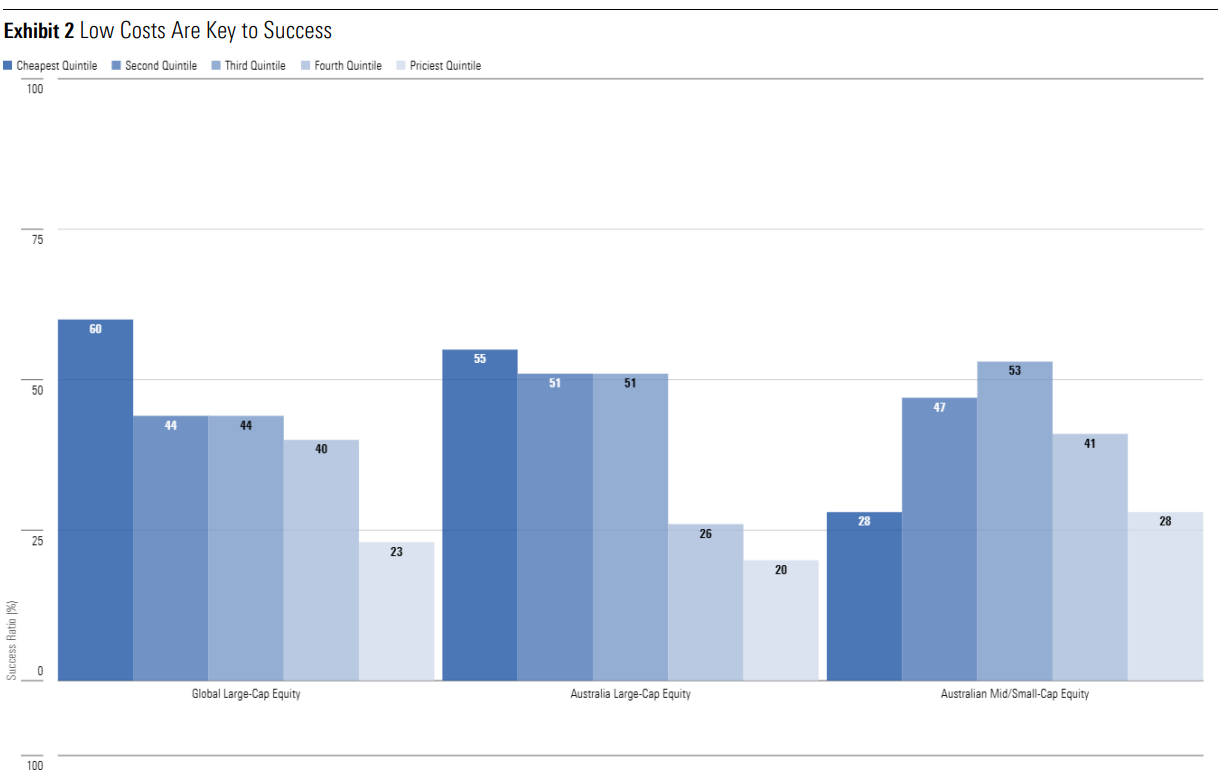
success ratio than the most expensive fee quintile, illustrating the power of fees. As an example, in the global large-cap equity group, the cheapest quintile recorded a success ratio of 60%, while the priciest option recorded 23%. A similar trend was seen in the Australian large-cap equity group (55% versus 20%).
The categories contained a significant number of passive funds in the cheapest quintile. Recent years have been a challenging time for active managers to beat their passive peers as returns have been dominated by a select few sectors. Globally, technology companies have had stellar performances, with sector exposure growing from 16% to 24% of the global index. The catalyst is the promising potential growth of artificial intelligence. Locally, large banks have been beneficiaries from the rising interest-rate regime. These factors did not help active equity managers who aim to produce returns above the benchmark through diversified portfolios.\
An outlier where the power of fees has shown no benefit is the Australian mid/small-cap equity group. The success ratio of the cheapest and priciest quintile is equal at 28%. The cheapest quintile’s low success ratio is attributed to consistent missteps in stock selection by active managers, as measured using the information ratio. In contrast, the most expensive quintile was hampered by higher fee share classes of existing funds provided by secondary distributors. Although the underlying funds were mostly successful, the higher fees posed too much of a drag to achieve success in these cases. Within this category, fees had no predictive power, and medium-term performance was dependent on a manager’s skill.
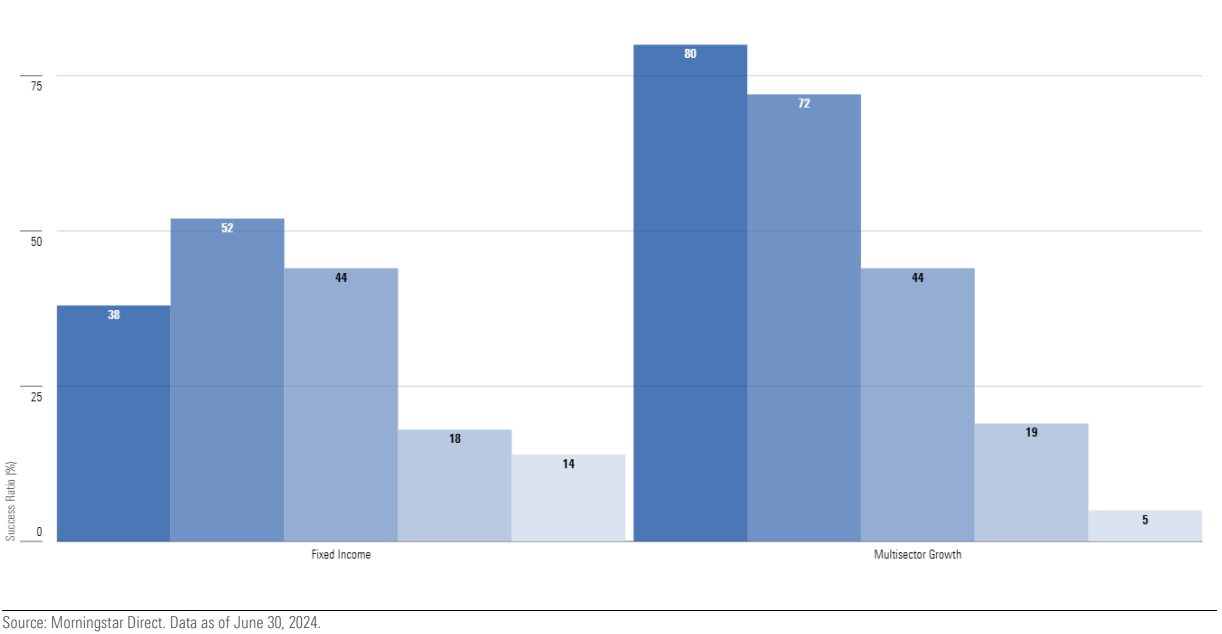
The dispersion was smaller within the fixed-income asset class; the cheapest quintile’s success ratio was 38%, and the most expensive quintile was 14%. Over the tested period, active managers have been able to capitalize on the rising interest-rate environment by shifting their portfolios to shorter-duration positions—a lever unavailable to passive funds. Similarly, they have been able to adjust their credit risk exposure, benefiting more from a tightening in credit spreads than their passive peers. Taking a longerterm view, active fixed-income managers can produce stronger returns over the economic cycle owing to a consistent overweight in corporate credit relative to the index. This is particularly evident within Australian fixed interest, where the conventional benchmark has a considerable skew—around 90%—to government and government-related issuance. Thus, active managers tend to underperform the index in risk-off conditions while outperforming in more sanguine markets. Being compensated for the additional risk with higher yields tends to bolster index-relative performance through the cycle.
Ultimately, our analysis suggests that although active fixed-income managers are often able to outperform the index gross of fees, the outperformance does not always compensate for the corresponding fees.
The disparity between the cheapest and priciest quintile was the most shocking in the multisector growth category, where the cheapest quintile logged a success ratio of 80% versus the most expensive quintile’s 5%. We have long acknowledged the ongoing difficulties for active managers to consistently add value through dynamic asset allocation, as the ability to predict market conditions continues to be a challenging endeavor. So, it was unsurprising to find that the cheapest, most successful quintile was heavily comprised of multisector funds that used passive components. That said, the poor result of the most expensive quintile has been exacerbated from the number of secondary distribution of funds that are burdened by inefficient legacy fee models.
Taking a step back from specific examples, we see the two metrics are negatively correlated, albeit with some exceptions. Notably, Australian mid/small-cap equity funds and fixed-income funds. The former being a unique case where fees had low predictive power, but skillful managers proved crucial in achieving success, as no simple rule described the distribution. While, as highlighted in our analysis of fixed income, active managers are able to outperform broad bond indexes through their available levers.
This is discernible from the higher success ratio in the second fee quintile—which was predominantly
comprised of active funds—when compared with the cheapest quintile (52% versus 38%). Investors can expect higher returns from active managers, at the cost of taking on additional risk. It is important for investors to be aware of this relationship and pick an option that suits their risk tolerance.
Overall, it is clear that fees play a key role in predicting a fund’s success, though the strength of the
correlation differs across categories.
 Morningstar


