Executive Summary
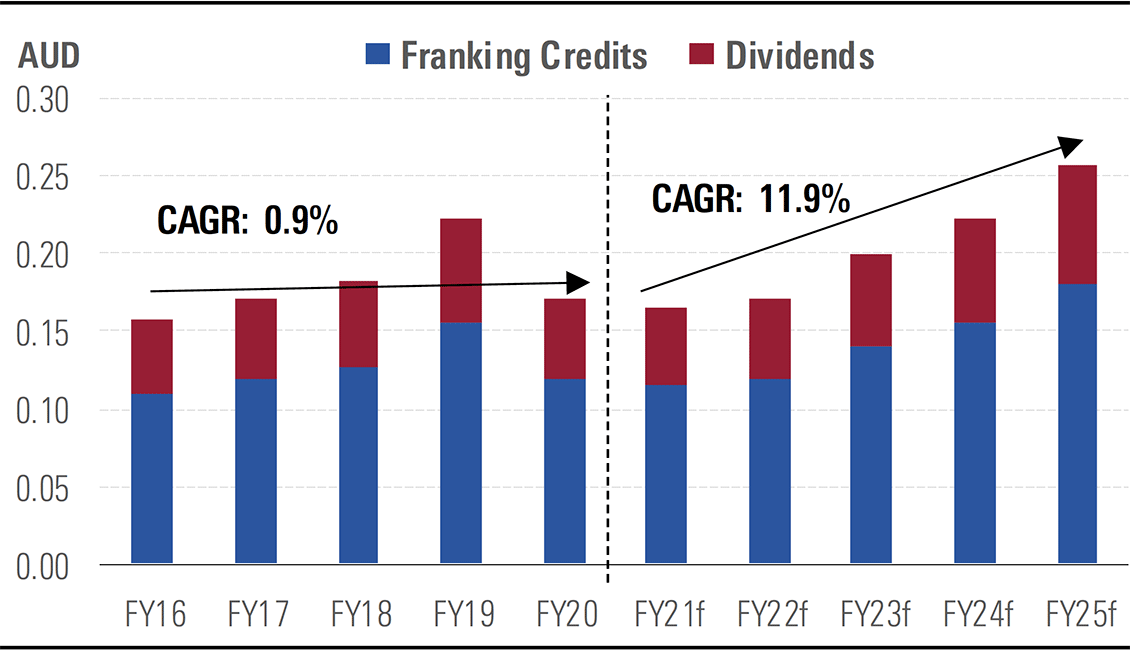
Income investors face a challenging environment following repeated interest rate cuts which have caused asset yields to compress. The Reserve Bank of Australia’s indication that its target cash rate won’t increase until at least 2024 has caused some investors to claim “there is no alternative” to equities as a source of yield. In Australia, dividend payout ratios are relatively high due to the dividend imputation system, which returns corporate tax to Australian resident taxpayers via franking credits with dividends, creating additional income for Australian resident taxpayers.
Morningstar’s fair value estimates exclude the value of franking credits because they only have value to Australian resident taxpayers. However, franking credits can materially increase the income earned from Australian equities by Australian resident taxpayers. Contrary to a common misconception, the gross value of franking credits does not vary with a shareholder’s marginal rate of tax, and is equivalent to other sources of gross income, such as bank interest and dividends on shares.
We’ve identified 10 franked income stock ideas from our Australian and New Zealand coverage list of 189 stocks. The additional income from franking credits highlights several companies with 3-star ratings which appear more valuable when the value of franking credits is incorporated into our analysis. Our shortlist is based not only on the short-term dividend yield, but also on the gross yield including franking credits and other indicators of dividend sustainability, such as our Economic Moat rating.
Income is an important source of returns for Australian investors
Australian dividend imputation encourages dividend payments
Australia’s taxation system favours returns to shareholders through dividends. Dividends are tax advantaged for Australian resident taxpayers and Australian corporates are fully aware of the value of dividends in the hands of shareholders.
The Australian dividend imputation system was introduced in 1987 to avoid the double taxation of Australian resident taxpayers whereby dividends were effectively subject to both corporate and personal income tax. The payment of franking credits with dividends enables Australian resident taxpayers to reduce their personal tax liability but, since 2002, franking credits are also refundable, meaning taxpayers with a low or zero marginal tax rate can generate additional gross income from franking credits. Notably, franking credits, like dividends, are received equally by all Australian taxpayers irrespective of their personal marginal taxation rate.
The dividend imputation system encourages Australian companies to return capital to shareholders via dividends and leads to relatively high payout ratios, as illustrated in Exhibit 1. This happens despite the existence of the capital gains tax discount, or CGT. It also reduces the appeal of directing capital to other potential uses, such as reinvestments in the business, growth by acquisitions, or on-market share buybacks.
Exhibit 1: Payout ratios are relatively high in Australia
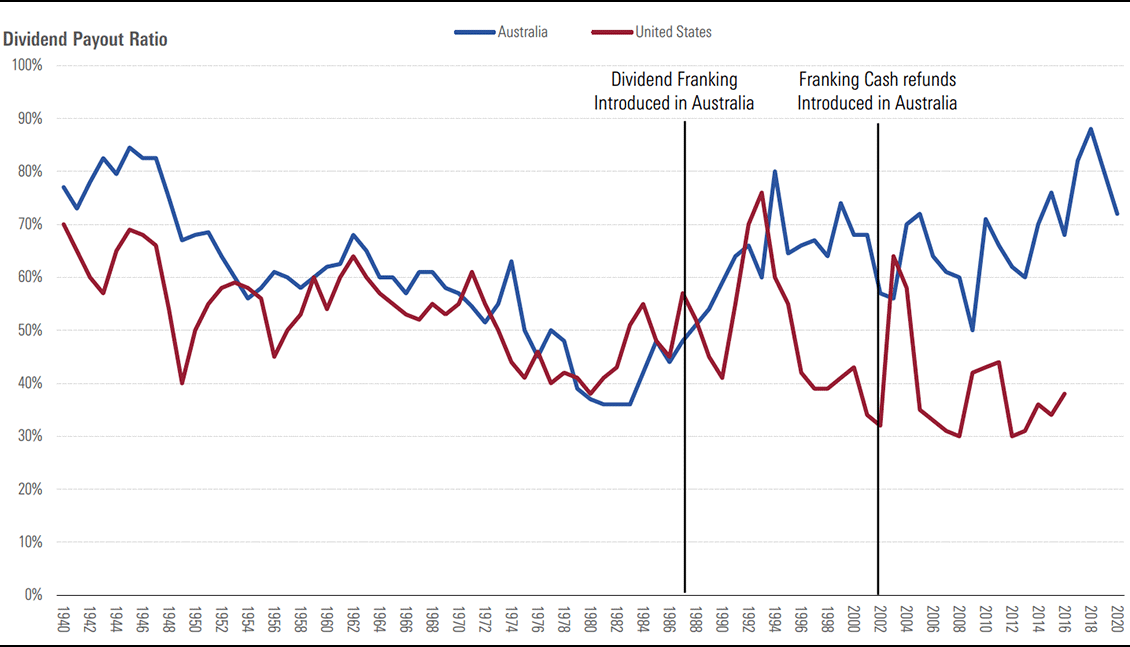
Source: ‘A History of Australian Equities 2019’ Reserve Bank of Australia, Morningstar
Franking credits have little legislative risk
We consider the legislative risk of franking credits to be relatively low, but not zero. In the 2019 Australian federal election, the Labor party proposed removing the cash rebate for franking credits, which the coalition government under John Howard introduced in 2002, while retaining franking credits as a tax liability offset. The logic behind this policy was that dividend imputation was designed to eliminate double taxation rather than eliminate taxation altogether, which is effectively what happens when zero percent income taxpayers receive a cash return of corporate tax. However, the Labor party underestimated the public backlash to this policy, particularly from retirees and SMSF investors, some of whom rely on the income from franking credits. Although the removal of franking credits is a risk, the experience of the Labor party in 2019 suggests the risk is likely low given the apparent political cost. The growing population of retirees and their need to fund retirement means the risk of a regulatory change could diminish in future.
Income is important in Australia, but the equity market is concentrated and domestically focused
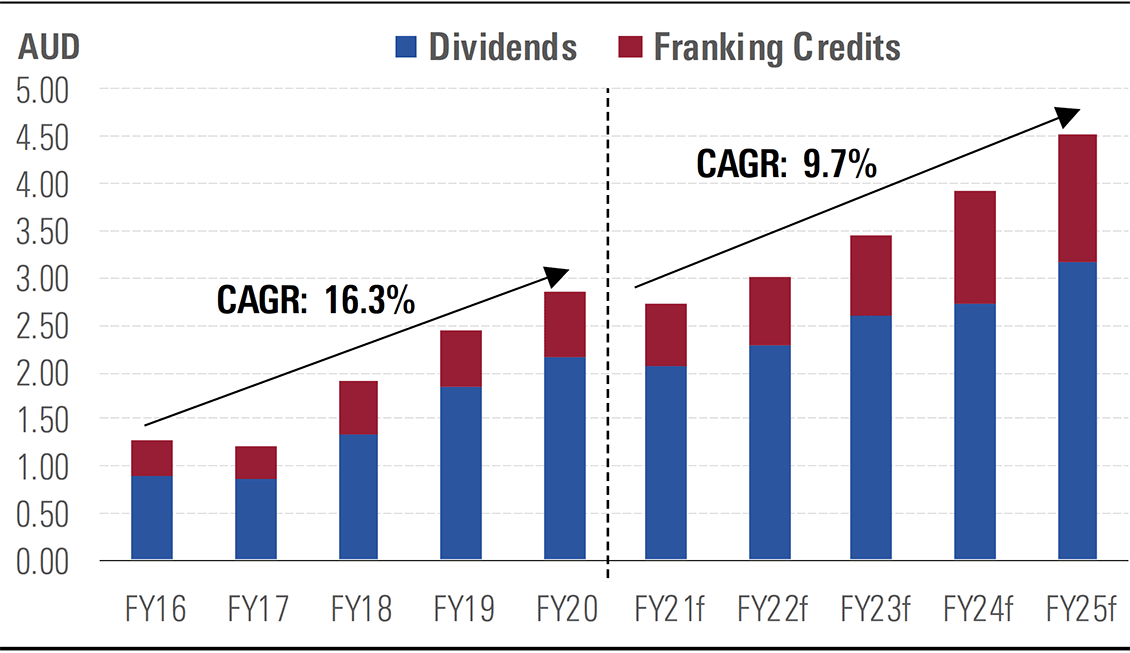
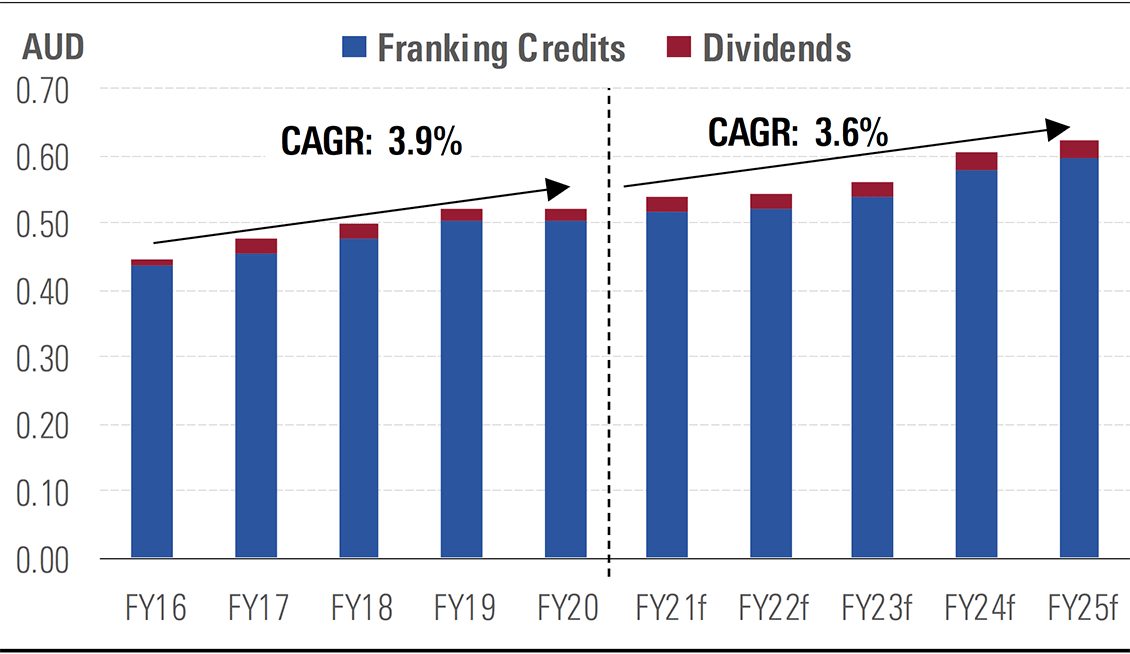
As shown in Exhibit 2, dividends and franking credits comprised around 70% of the total return of the S&P/ASX 200 Index over the past decade, which highlights the importance of income to long-term Australian equity investment returns. However, the Australian market is relatively concentrated across financial and resources stocks, as illustrated in Exhibit 3, and arguably domestically focused. This means that a portfolio of Australian equities may be more highly correlated, or less diversified, than investors perceive. The Australian market’s large exposure to resources companies also arguably increases environmental social and governance, or ESG, risks and resource companies’ earnings volatility can increase dividend volatility.
Exhibit 2: Franking credits increase the long-term total return of Australian resident taxpayers
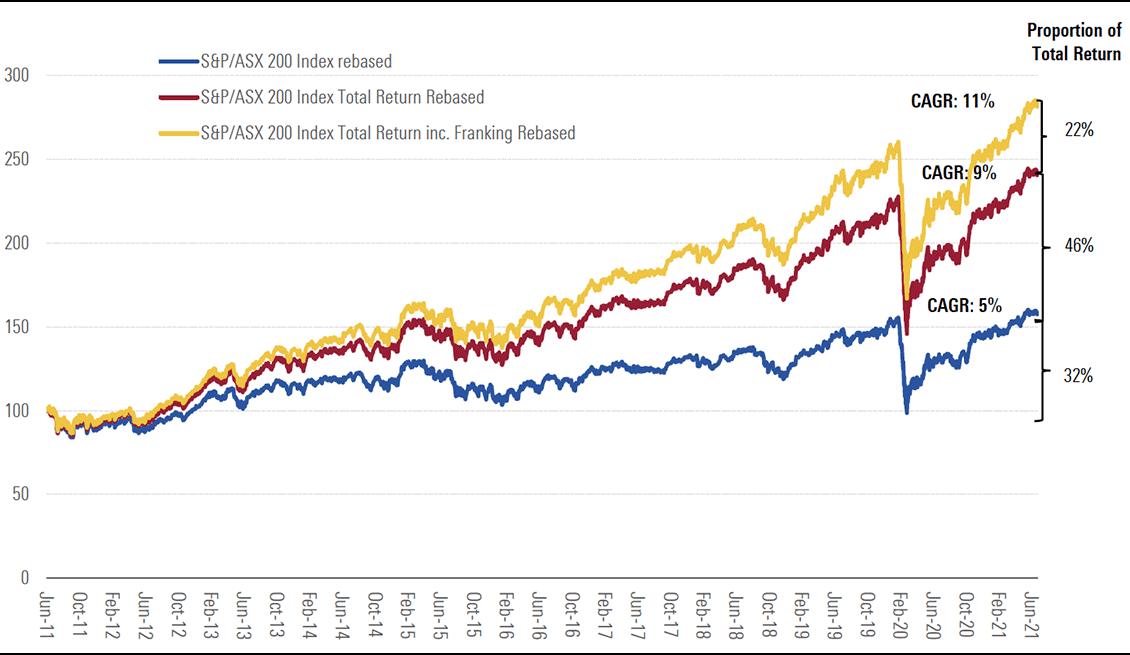
Source: www.spglobal.com, Morningstar
Exhibit 3: The S&P/ASX 200 is relatively concentrated in resources and financials stocks
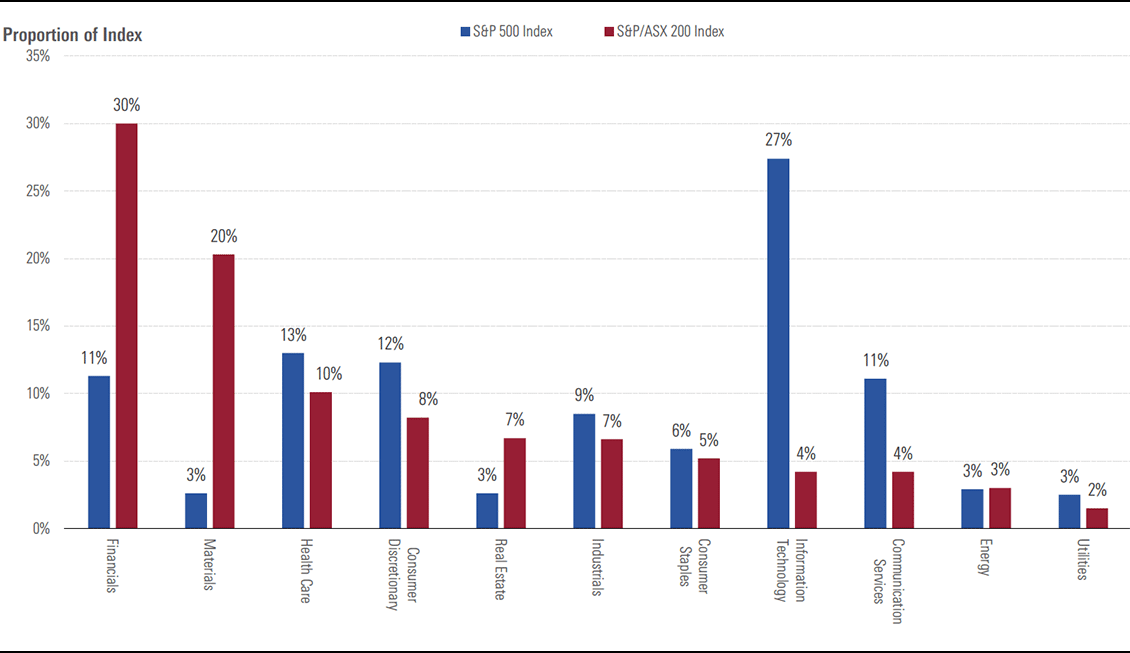
Source: www.spglobal.com, Morningstar
Franking credits have significant value for Australian resident taxpayers
Morningstar’s fair-value estimates exclude franking credit value
Investors should usually focus on the total return earned from their investments rather than the source of the return, be it income or capital growth, but franking credits can make income a preferable source of returns for Australian resident taxpayers. Morningstar’s fair value estimates do not incorporate the value of franking credits because they only have value for Australian resident taxpayers.
Franking credits can materially boost earnings and FVEs for Australian resident taxpayers
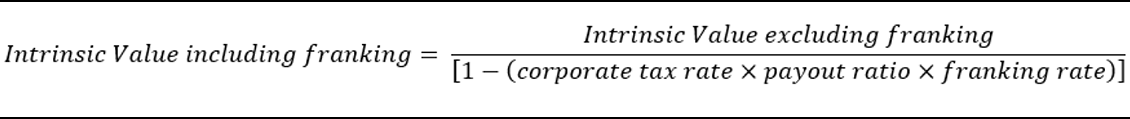
For Australian resident taxpayers, franking credits increase the income received from shares. This effectively boosts the cash flows from dividends to those shareholders, and in turn the intrinsic value of those shares to those investors. As franking credits are a rebate of corporate tax, they can be thought of as an increase to the company’s net profit after tax, or NPAT, based on the formula shown in in Exhibit 4.
Exhibit 4: The value of franking credit income

Source: Morningstar
We can use the formula in Exhibit 4 to estimate the increase in intrinsic value for Australian shareholders due to franking credits by assuming the corporate tax rate, the payout ratio, and the franking rate remain constant and that NPAT approximates to free cash flow over the long term, as shown in Exhibit 5.
Exhibit 5: The value of franking credits
Source: Morningstar
As shown in Exhibit 5, a higher dividend payout ratio and franking rate create a larger boost to the intrinsic value. We have estimated the value of this benefit for varying payout ratios and franking rates in Exhibit 6. We’ve also highlighted the current average franking and dividend payout ratio for the Australian companies we cover, being an average payout ratio of around 75% and franking rate of around 60%, which implies an average boost to intrinsic value of around 15% from franking.
Exhibit 6: Franking credit value increases with payout ratio and franking rate
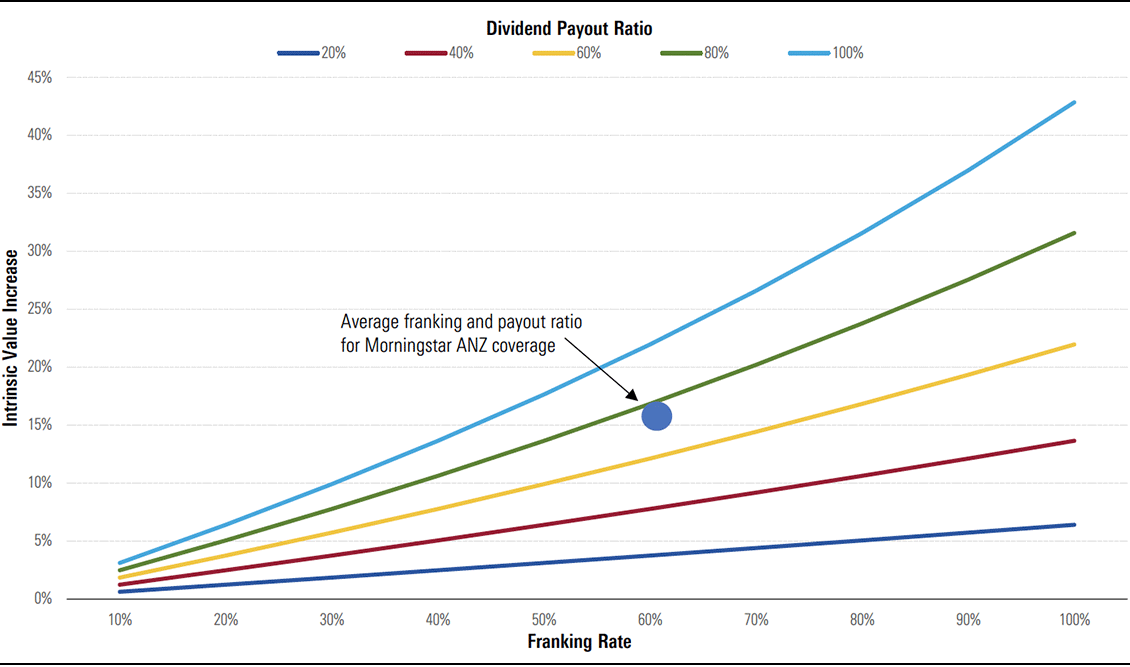
Source: Morningstar
Franking credits create additional value for Australian resident taxpayers
As discussed previously, franking credits can be thought of as increasing the cash available for distribution by a company, via a lower corporate tax liability, which effectively boosts the intrinsic value for recipients of franking credits. However, the theoretical value of the franking credits depends on the size of the increase and the fair value uncertainty rating of the stock. For example, a company with a low fair value uncertainty rating, and requiring a lesser margin of safety, is more likely to screen as attractive when franking credits are considered. Exhibit 7 highlights some of the biggest beneficiaries when adjusting the intrinsic share value for franking credits.
Exhibit 7: Franking credits can effectively boost star ratings for Australian taxpayers
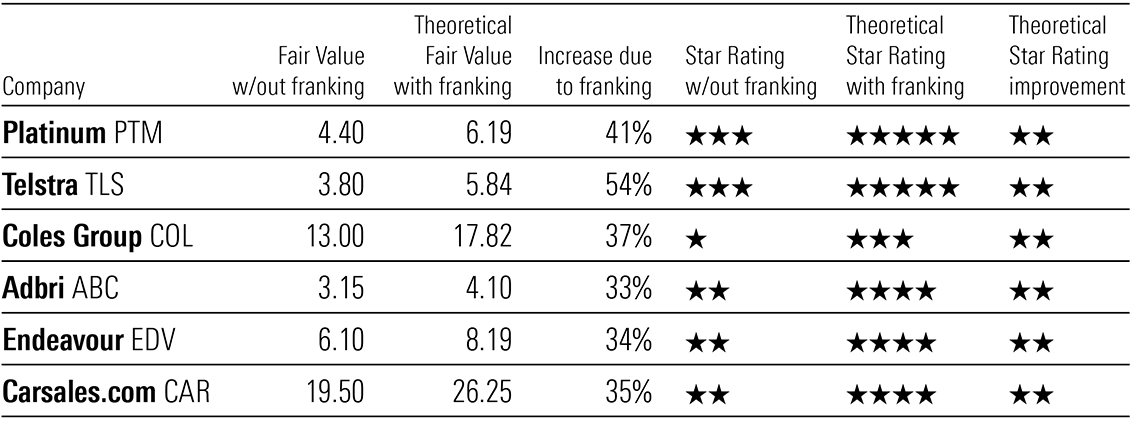
Source: Morningstar, Data as at August 2, 2021.
Australian income investors shouldn’t fear higher interest rates
Morningstar’s cost of equity already incorporates higher interest rates
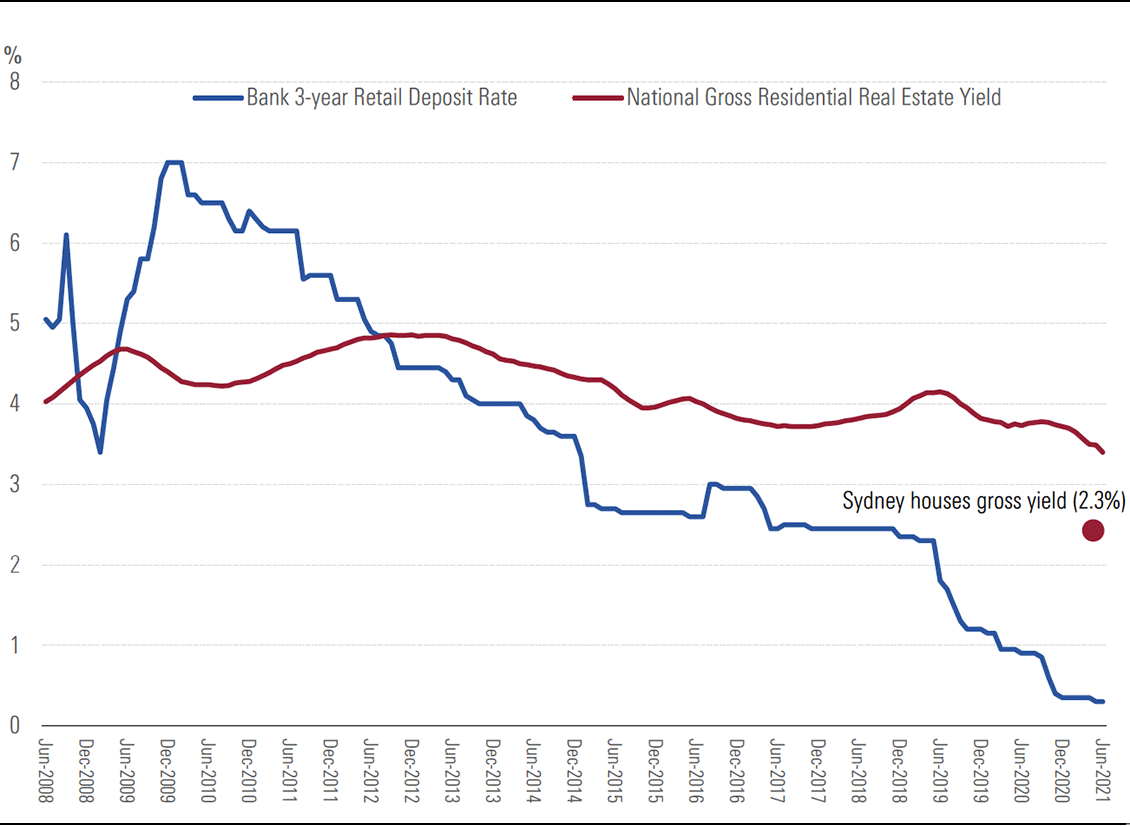
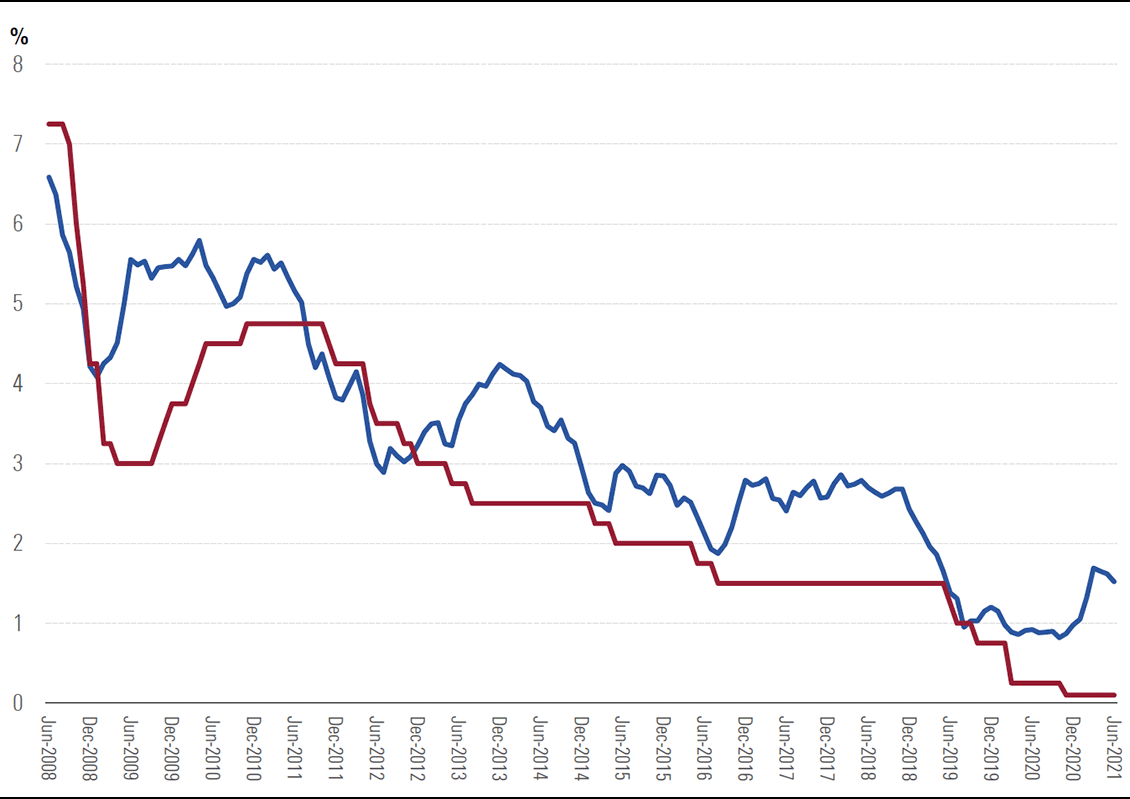
Australian income investors have been impacted by falling interest rates in recent years, as illustrated in Exhibit 8A, which has crushed interest rates on deposit accounts and compressed yields on residential real estate, as shown in Exhibit 8B. However, with most Western central bank interest rates close to zero, it’s understandable that investors seeking income are concerned about interest rates and income stock yields moving higher, potentially causing capital losses from income stocks.
Morningstar’s fair value estimates are based on our assessment of a “fair” return for equity investments which we consider to be 9% per year for an “average” stock, roughly equal to the long-term historical total return of the equity market. Put another way, we believe equity investors should require a return that is equal to a “midcycle” risk-free interest rate of 4.5% plus an equity risk premium of 4.5%. Although our risk-free rate assumption may seem conservative relative to the current risk-free rate, it provides a margin of safety against the risk of interest rates moving higher.
Exhibit 8A: Interest rates have fallen in recent decades
Source: Reserve Bank of Australia, Morningstar
Exhibit 8B: Traditional sources of income have declined in recent years
Source: www.spglobal.com, Morningstar
Inflation could push rates and yields higher but possibly not to long-term historical levels
While we can see rising inflation risks and the likelihood of interest rates increasing over time, it will be a long road for rates to get back to historical long-term averages, if they do. While we do see some risk to equity valuations from rising interest rates, we do not think those risks are acute or are likely to suddenly materialise, nor should they deter investors from equity investments. The latter is supported by the relatively low returns on offer in alternative investments such as fixed interest.
The COVID-19 pandemic caused the Reserve Bank of Australia, or RBA, to cut its target cash rate to practically zero to stimulate the economy, but low interest rates aren’t a uniquely virus-related phenomenon. Rather, both nominal and real interest rates were already at record lows before the pandemic and have arguably been trending lower for the past 40 years. Economic analysis published by the Bank of England in 2020 also indicates that real interest rates have been gradually falling for centuries rather than decades, implying that weak interest rates could be at least partly a structural rather than cyclical phenomenon.
In 2017, the RBA published a report entitled, The Neutral Interest Rate, which found that the “neutral” interest rate, which enables full employment and stable inflation, had fallen to around 1.0% in 2017 from 2.5% in 2007. This implied a “neutral” nominal cash rate of around 3.5%, assuming 2.5% inflation. However, in June 2021, economists at the Commonwealth Bank estimated the RBA’s nominal cash rate would be “neutral” at just 1.25%.
In July 2021, the governor of the RBA, Philip Lowe, also said that Australian “full employment” likely corresponded to an unemployment rate in the low-4% range and that low wage growth would likely prevent the RBA’s cash rate from increasing before 2024.
It’s worth remembering the RBA’s mandate is to “…contribute to the stability of the currency and full employment…” which it achieves by “…conducting monetary policy to meet an agreed medium-term inflation target…” Importantly, the RBA is not tasked with managing residential real estate prices, meaning management of inflation, particularly wage inflation, and unemployment will remain primary objectives of the RBA. However, inflation has consistently plotted below the RBA’s target range of 2% to 3% over the past decade, as illustrated in Exhibit 9A, and wage inflation has missed the 3% target, with the RBA’s forecasts for wage growth repeatedly too optimistic over the past decade, as illustrated in Exhibit 9B.
Exhibit 9A: Inflation has missed the RBA’s target in recent years
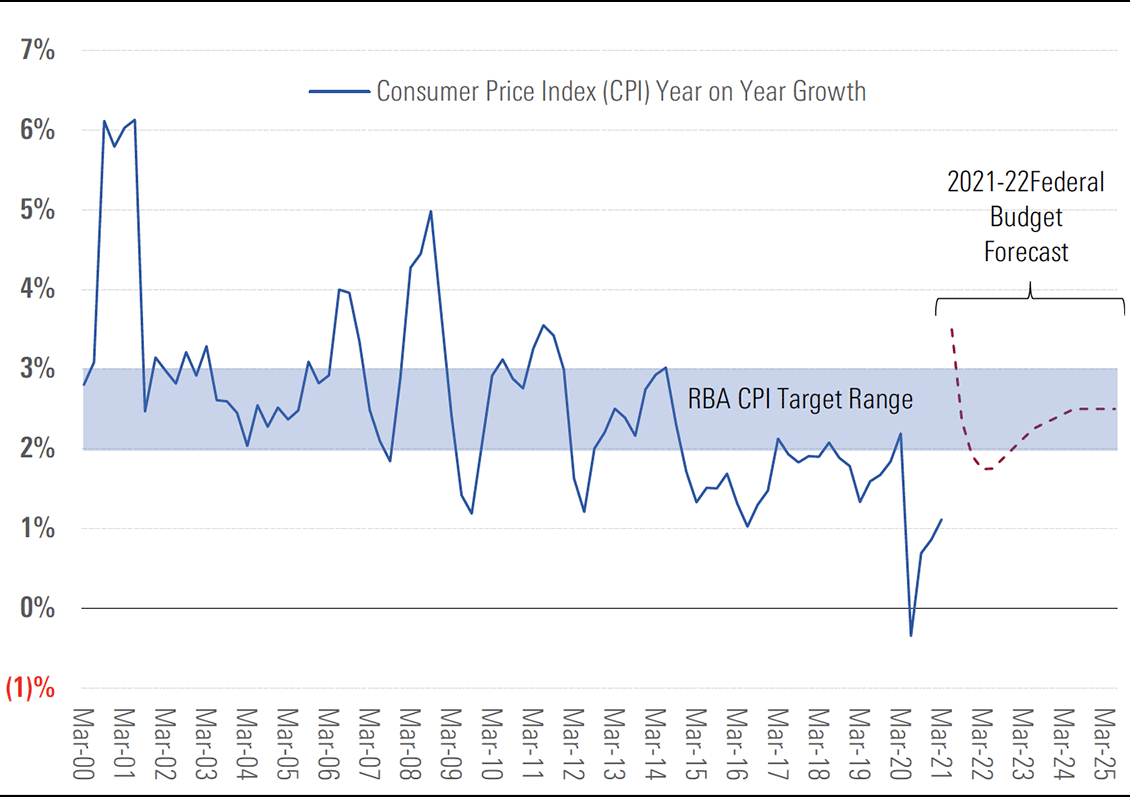
Source: Reserve Bank of Australia, Australian Bureau of Statistics, Morningstar
Exhibit 9B: Wage inflation has repeatedly missed the RBA’s targets
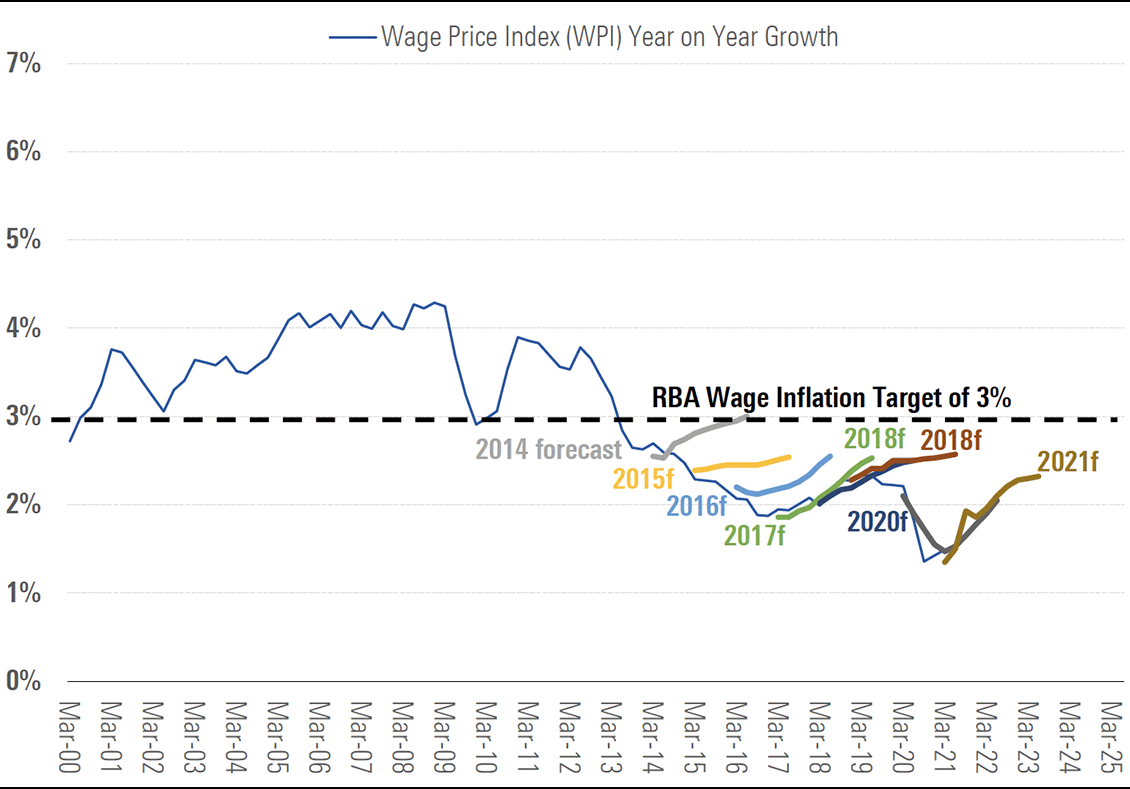
Source: Reserve Bank of Australia, Australian Bureau of Statistics, Morningstar
In May 2021, the Australian federal government released its 2021–22 federal budget and highlighted the speed with which gross domestic product, or GDP, and unemployment had recovered, as illustrated in Exhibit 10A. Although the current increase in virus cases and related lockdowns, particularly in Sydney, mean the short-term economic outlook has since deteriorated, it’s likely the subsequent recovery will be equally quick as it was in 2020.
However, the bigger issue facing the RBA is what comes after the pandemic. For example, Australian GDP growth is particularly dependent upon Australia’s relatively high population growth grate which in turn is based on relatively high immigration. Although unemployment has recovered quickly, international borders remain closed, and immigration has effectively stopped, as illustrated in Exhibit 10B. RBA governor Philip Lowe recently indicated Australia’s high rates of immigration are a headwind for wage growth, which leaves the economy in a catch 22 situation whereby immigration is needed for GDP growth but may stymie wage inflation, and therefore result in low interest rates, as occurred in recent years. The other challenge facing the economy is the increase in government and household debt which arguably creates a headwind to higher interest rates.
Exhibit 10A: Employment was strong before the June 2021 lockdowns
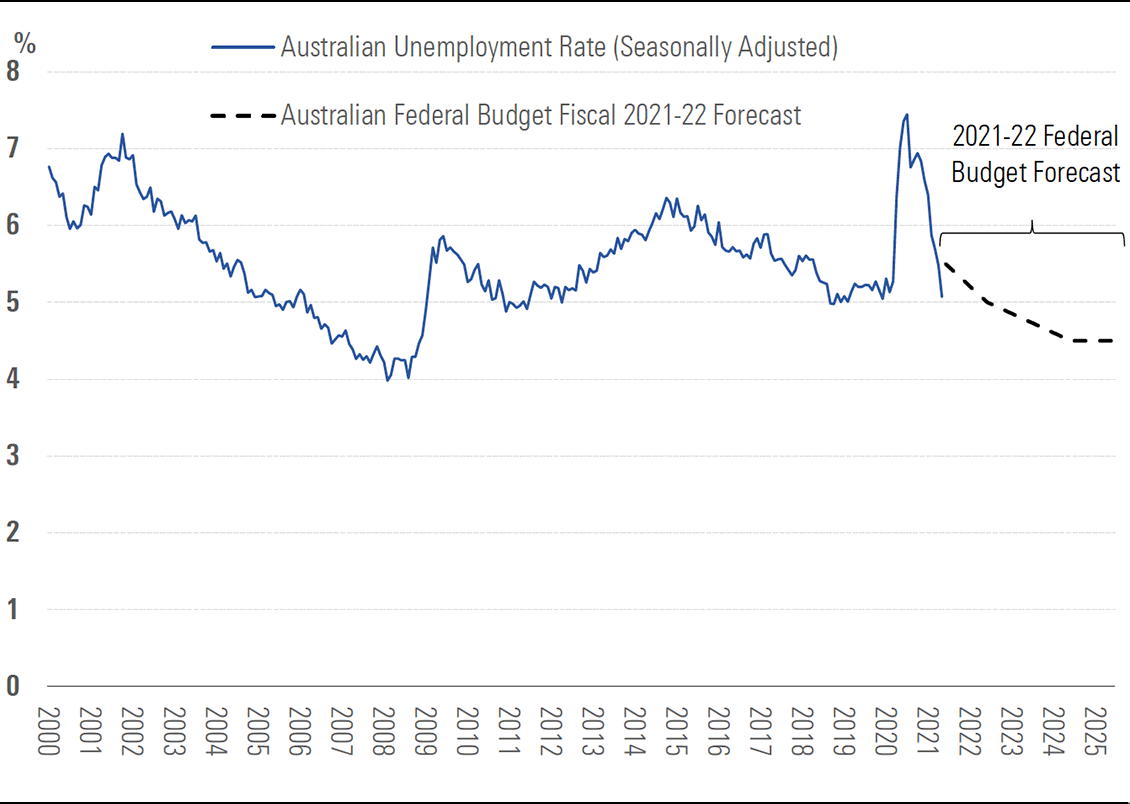
Source: Australian Bureau of Statistics, Australian federal Government, Morningstar
Exhibit 10B: Immigration should recover from mid-2022
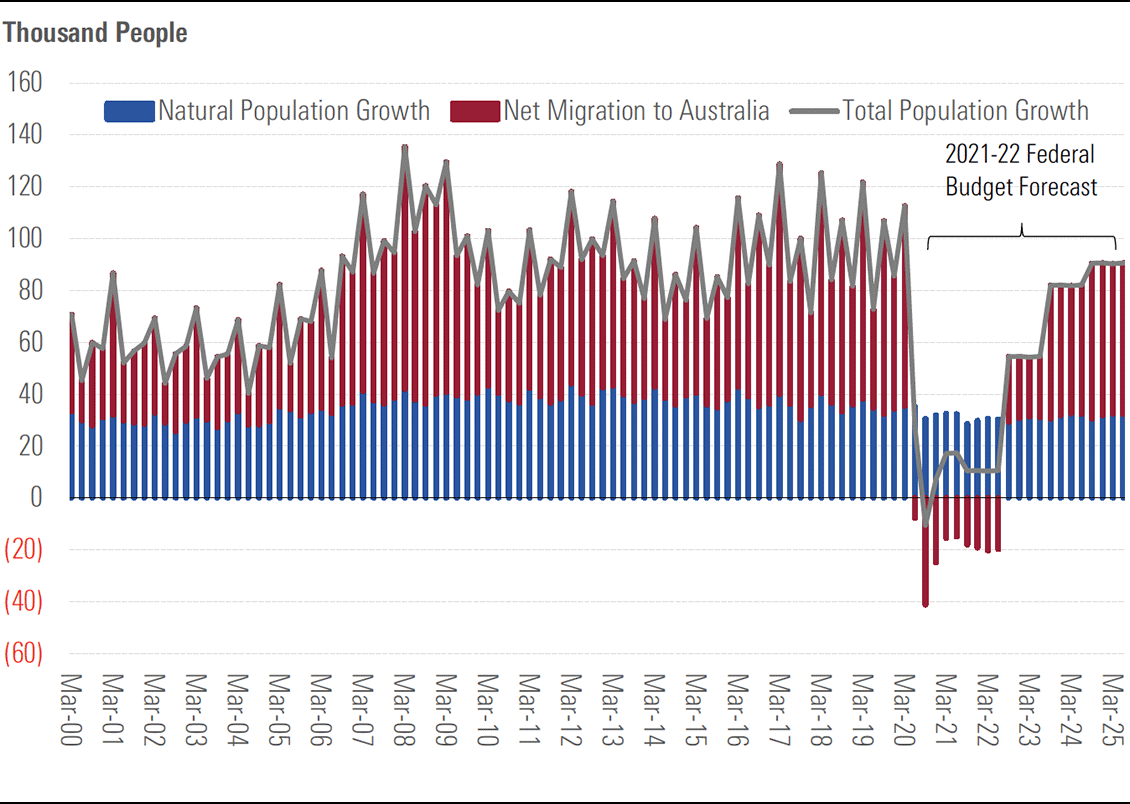
Source: Australian Bureau of Statistics, Australian federal Government, Morningstar
Identifying dividend sustainability and avoiding the yield traps
Income investing is about more than simply buying companies with high short-term dividend yields, which could signal future earnings and dividend weakness rather than relatively high returns, a situation known as a yield trap. In addition to Morningstar’s star ratings and price/fair value estimates, we recommend investors consider Morningstar’s proprietary ratings when evaluating income stocks. Income investors can also assess dividend sustainability via financial statement and earnings forecasts analysis, such as the following metrics:
Morningstar Economic Moat Rating: The Morningstar economic moat rating measures a company’s ability to protect its profits from competition. Narrow- and wide-moat-rated companies are more likely to sustain profits and therefore dividends than companies with no economic moat. Organic revenue growth: Organic revenue growth is arguably a more sustainable source of revenue growth than acquisitions or cost cutting. Income investors should therefore assess the extent to which revenue growth is organic and sustainable and if acquisitions are masking a weak core business which could threaten dividend sustainability.
Customer concentration: High customer concentration can pose a significant threat to revenue, earnings, and dividends. The loss of a large client or contract could significantly impact revenue and be exacerbated by operating leverage, causing profits and dividends to fall. Income investors should therefore assess the degree of customer concentration in addition to key contract terms and expiry dates.
Recurring revenue: Companies with a high proportion of recurring revenue should experience more sustainable dividends and resilience to economic downturns.
Margin compression: Strong businesses with economic moats should demonstrate resilient profit margins. Falling profit margins imply competition is eroding profits and may lead to future dividend cuts.
Dividend payout ratio: Dividend payout ratios should be sustainable. Morningstar analysts assess the suitability of dividends within their Capital Allocation analysis. However, paying dividends while increasing debt or raising equity, or a dividend payout ratio of over 90% may indicate unsustainable dividends.
10 franked income-stock ideas for Australian investors
Selection criteria
We have screened our Australia and New Zealand, or ANZ, coverage list of 189 stocks for attractive income stock ideas, including franking credits, for Australian investors. Factoring in the additional income from franking credits into our analysis, our screen highlights several companies with 3-star ratings which have significant forecast franked income streams. Our shortlist is based not only on the short-term dividend yield, but also on the gross yield including franking credits and other indicators of dividend sustainability, such as the Economic Moat and Capital Allocation ratings and took the following steps:
Remove companies with no economic moat: We removed companies with no economic moat to increase the likelihood of earnings, and therefore dividend, sustainability.
Remove companies with poor capital allocation: We removed companies with poor capital allocation ratings to reduce the likelihood of inappropriate dividend payout ratios and the likelihood of shareholder value destruction.
Remove New Zealand companies: Although New Zealand has a dividend imputation system, for simplicity, we have removed New Zealand companies from our screen.
Rank by fiscal 2022 gross yield: We ranked our coverage list based on the fiscal 2022 gross yield, including franking credits.
Remove 1- and 2-star-rated stocks: We removed 1 and 2 star rated companies to focus on the cheapest companies on our list.
Prioritise wide-moat stocks: We prioritised wide-moat-rated stocks due to their very high quality and strong likelihood of sustaining earnings and dividends over the long term.
A list of the resulting companies are provided below.
Aurizon Holdings
Dividend yield FY22: 7.7% | Gross yield FY22: 10.0%
Narrow-moat-rated Aurizon Holdings (ASX:AZJ) is trading at a 20% discount to our fair value estimate and offers a generous dividend yield over 7%, mostly franked. The coal-exposed businesses are relatively stable, and growth should come from the smaller bulk division. We think threats to coal exports are exaggerated, at least in the foreseeable future. Almost all Australian thermal coal exports head to Asia, where plans for new coal power stations underpin demand growth. Metallurgical coal is necessary for steel making, with demand growth driven by ongoing economic development in Asia and India. Further, coal prices have shot higher in recent months, which is good for Aurizon’s customers and suggests haulage volumes will improve shortly.
Perpetual
Dividend yield FY22: 5.2% | Gross yield FY22: 7.4%
Perpetual (ASX:PPT) is diversifying its business from being an active manager of Australian equities to deriving more earnings from offering new asset classes, providing financial advice to high-net-worth clients, and being the major provider of trustee services to the securitisation market and outsourced responsible entity services to funds. A notable change of tone has been a focus on inorganic growth to address the issue of net outflows—due to poor short-term performance and industry funds insourcing their investment management—from its Australian investments business. Recent acquisitions of U.S. fund managers Barrow Hanley and Trillium materially improve Perpetual’s earnings outlook. Unlike the investments business, we think both the private wealth and corporate trust segments can better withstand the threat of competition and can generate more predictable earnings growth.
Link Group
Dividend yield FY22: 4.9% | Gross yield FY22: 6.6%
Link (ASX:LNK) has been impacted by investor concerns about superannuation regulation reform, which will hurt the company’s superannuation business in the short term, in addition to the recent virus-related economic downturn. However, the superannuation business constitutes around one quarter of group EBITDA, and we believe the market has overreacted to the changes. The impact of superannuation sector uncertainty has been amplified by short-term weakness in Link’s U.K. businesses. However, we believe the market is being too short-term-focused in this regard. Around 70% of group revenue is recurring and should help ensure the company survives the COVID-19-related economic downturn. Link also owns 44% of electronic conveyancing platform Pexa, which has a first-mover advantage and looks likely to build a network effect in the large Australian real estate conveyancing market.
GWA Group
Dividend yield FY22: 5.2% | Gross yield FY22: 7.4%
GWA Group’s (ASX:GWA) sanitary-ware and bathroom fitting products enjoy strong reputation and brand awareness in the Australian market—particularly the Caroma brand. Good distribution channel relationships also underpin the firm’s strong competitive position. But competition is heating up with new entrants such as Spain’s Roca eyeing the fast-growing Asia Pacific region including Australia and have achieved access to local distribution channels. We expect GWA’s margins to come under pressure as the brand portfolios of recent Australian market entrants garner greater brand awareness.
Westpac Banking Corp
Dividend yield FY22: 4.3% | Gross yield FY22: 6.1%
Wide-moat Westpac (ASX:WBC) represents a reasonable value exposure to Australian banks. Recent results support our long-term view. The bank’s loan book is high-quality, cost-saving opportunities can offset the impact of rising compliance and regulatory costs, weak loan growth is likely to improve, and the balance sheet is strong enough to withstand the downturn. We think Westpac can comfortably lift the dividend payout ratio to 75% after being forced to cut it to 50% in 2020, with the bank sitting on around AUD 8 billion in equity above regulatory requirements. As it is the second-largest lender in Australia, we remain confident the funding cost advantages Westpac enjoys will see it through the turbulence and underpin a return to strong profits and returns on equity.
APA Group
Dividend yield FY22: 5.8% | Gross yield FY22: 6.7%
Narrow-moat APA Group (ASX:APA) trades broadly in line with our fair value estimate but it’s a good-quality company with a relatively big yield of 5.8% partly franked. Like Spark, APA should benefit from the transition to renewable energy. We expect ongoing investment in wind and solar farms while its core gas transmission networks benefit from growing gas use to backup intermittent renewable power supply. One of the more interesting growth avenues for APA is helping remote mines in Western Australia replace diesel generators with a mix of solar panels, batteries and gas turbines. This should reduce the mines’ carbon emissions and operating costs. The main reason we’re not more positive on APA is that its assets have shorter useful lives than other infrastructure stocks.
Telstra
Dividend yield FY22: 4.2% | Gross yield FY22: 6.0%
Telstra (ASX:TLS) is the dominant player in the Australian telecom industry. It is the market leader in fixed voice, broadband, mobile services, and the corporate market. Telstra’s mobile unit benefits from a network quality advantage that underpins a 44% subscriber market share position. Government investment in the National Broadband Network will change the structure of the broadband market. How management plugs the expected AUD 3 billion-plus EBITDA hole to be inflicted by the NBN is the key long-term issue, with significant bearing on sustainability of current dividends. The balance sheet is solid, and the group has a good track record of extracting productivity benefits and replacing lost earnings. TPG Telecom’s aborted plans to enter the mobile network market are likely to diminish fears of heightened competition for Telstra, although the merged TPG-Vodafone entity will be a more formidable competitor.
Magellan Financial Group
Dividend yield FY22: 4.4% | Gross yield FY22: 5.8%
Magellan (ASX:MFG) is a highly reputable asset manager that has retained client funds and won new money throughout market cycles. Concerns about Magellan’s temporary underperformance are overblown, in our view; while performance may lag further in the short term, this reflects the rerating of cyclical/deep value stocks, which should normalise. Growth initiatives are centred on product expansion, which is targeted toward underserved niches that play to its brand and investment strength. The latest move involves catering to retirees seeking predictable income via FuturePay, a fixed distribution equity income product that differs from most equity income funds. The deployment of cash into unlisted businesses in its principal investments portfolio also provides additional earnings upside.
Dexus
Dividend yield FY22: 5.1% | Gross yield FY22: 5.3%
Dexus Property Group (ASX:DXS) is a major Australian property owner, manager, investor and developer. About 75% of income comes from office rent, and about 90% of that portfolio is rated either premium or A grade. The majority is in the Sydney CBD or fringe (54% by book value), as well as CBD exposure in Melbourne (18%) and Brisbane (13%), and minor other holdings around Australia. The group has a sizable industrial property portfolio (14% of income), and small retail and healthcare property interests. Funds management and property management accounts for about 8% of income, with funds management the group’s fastest growth engine. The group targets gearing of 30–40%, so financial risk is moderate considering that revenue is underpinned by long leases with fixed or CPI uplifts. Its funds management business is sticky given lockups and switching costs (exit penalties, and tax/transaction costs).
Medibank Private
Dividend yield FY22: 3.6% | Gross yield FY22: 5.1%
The 2014 privatisation of Medibank Private (ASX:MPL) provided an attractive opportunity to invest in Australia’s largest private health insurer. Healthcare spending is expected to grow in the long term, underpinned by an increasing and ageing population. Operating in a heavily regulated industry, Australian health insurers typically produce stable and defensive earnings and, in our opinion, Medibank is well placed to produce solid long-term earnings growth. Future changes to regulations could hurt Medibank’s prospects, but we don’t believe the government would materially damage the viability of the private health insurance sector in Australia. Growth is supported by government reliance on private health insurers to partially fund escalating healthcare costs. Government policies and incentives encourage participation, with 53% of the population covered for private hospital or ancillary health insurance.